Asymmetric-Loss-Guided Hybrid CNN-BiLSTM-Attention Model for Industrial RUL Prediction with Interpretable Failure Heatmaps
Pith reviewed 2026-05-10 13:59 UTC · model grok-4.3
The pith
A hybrid CNN-BiLSTM model with asymmetric loss and attention predicts turbofan remaining useful life at 17.52 cycles RMSE while generating per-engine degradation heatmaps.
A machine-rendered reading of the paper's core claim, the machinery that carries it, and where it could break.
Core claim
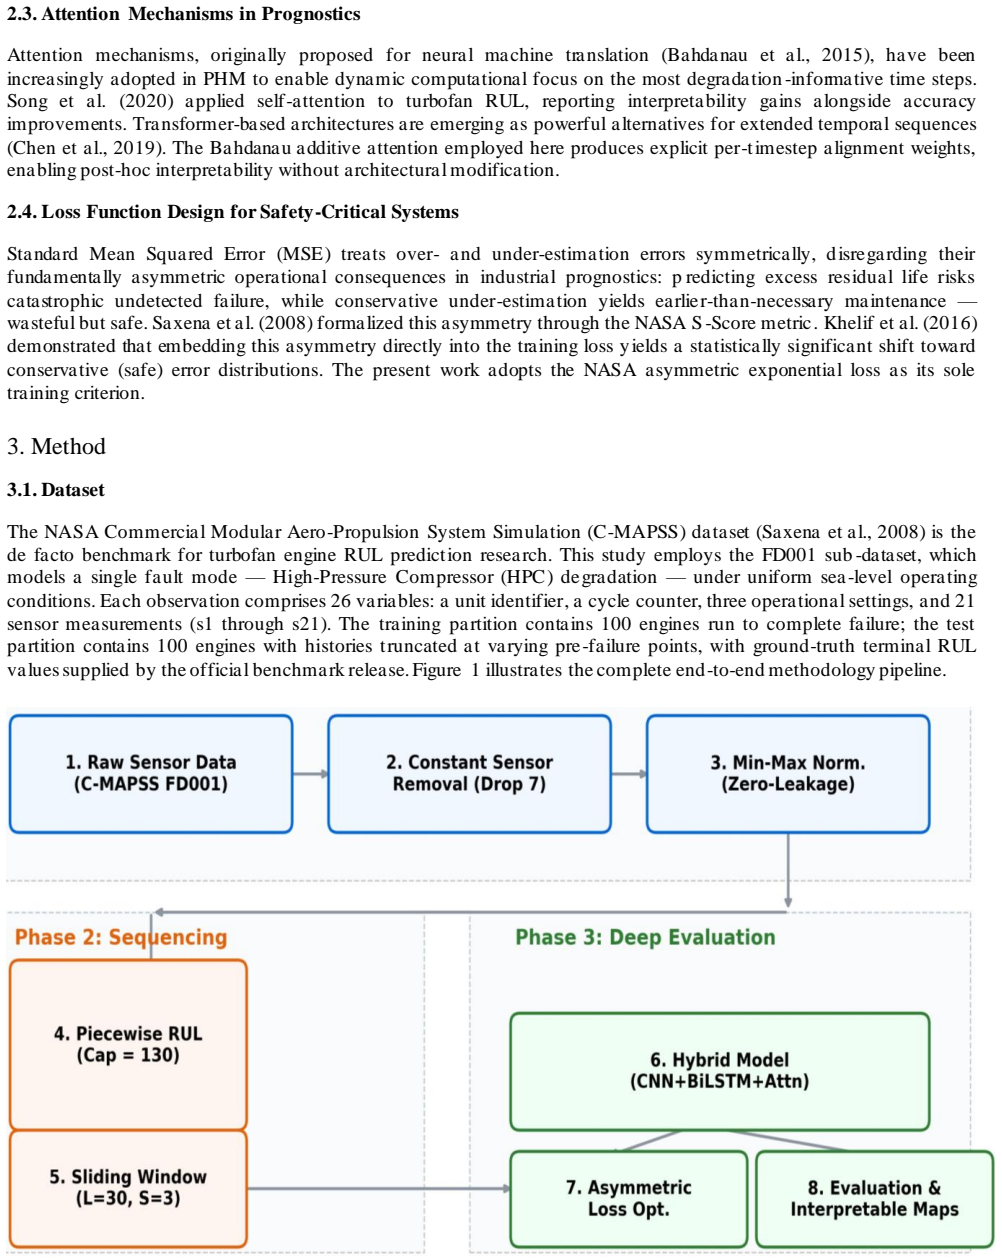
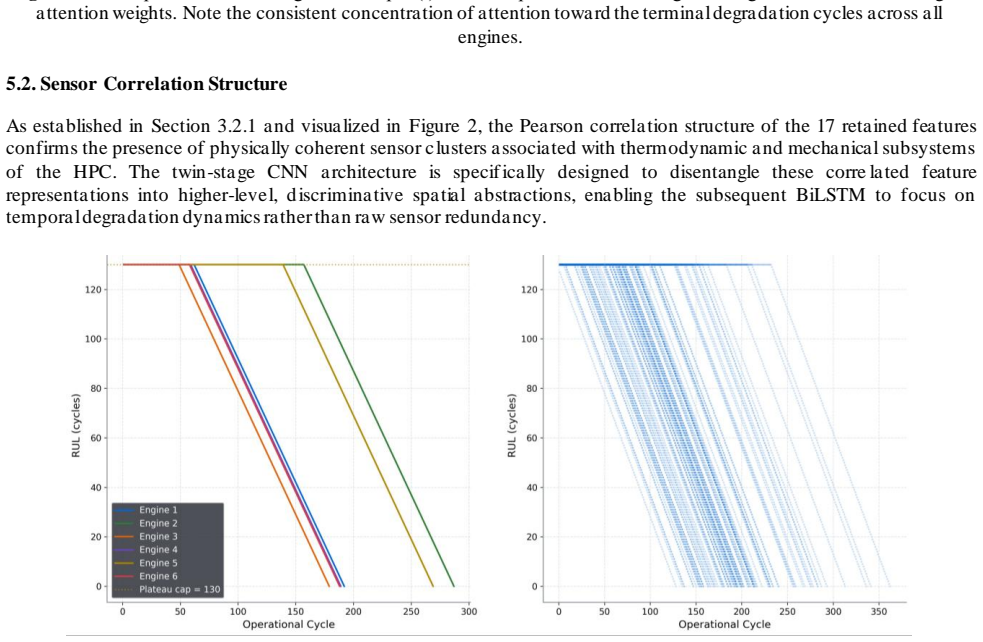
The central claim is that a twin-stage 1D-CNN feeding a BiLSTM with Bahdanau additive attention, trained on zero-leakage preprocessed C-MAPSS FD001 data using piecewise-linear RUL targets capped at 130 cycles and the NASA asymmetric exponential loss, reaches an RMSE of 17.52 cycles and an S-Score of 922.06 while the attention weights directly yield interpretable failure heatmaps that reveal temporal degradation patterns for individual engines.
What carries the argument
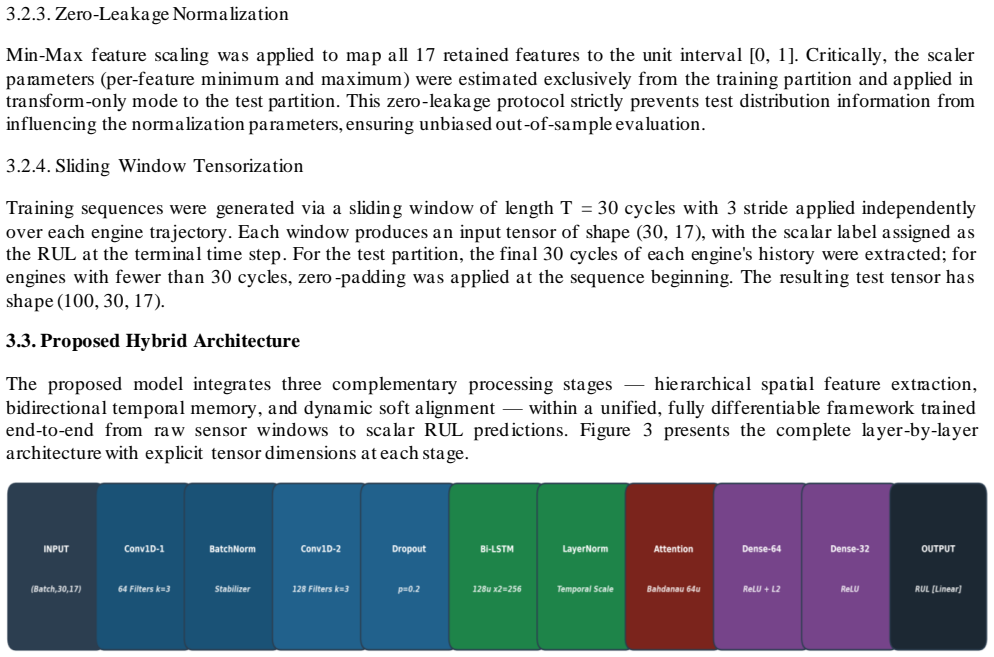
The hybrid architecture of twin-stage 1D-CNN layers for spatial sensor correlations, BiLSTM for bidirectional temporal modeling, and Bahdanau attention for weighted focus on degradation stages, all optimized under the asymmetric exponential loss that penalizes RUL over-estimates more than under-estimates.
If this is right
- Maintenance decisions can be scheduled with lower risk of missing failures because the loss discourages optimistic life estimates.
- Attention heatmaps supply per-engine visual traces of degradation progression that engineers can inspect without post-hoc explanation tools.
- The same preprocessing and labeling pipeline can be reused for other multi-sensor time-series prognostic tasks in industry.
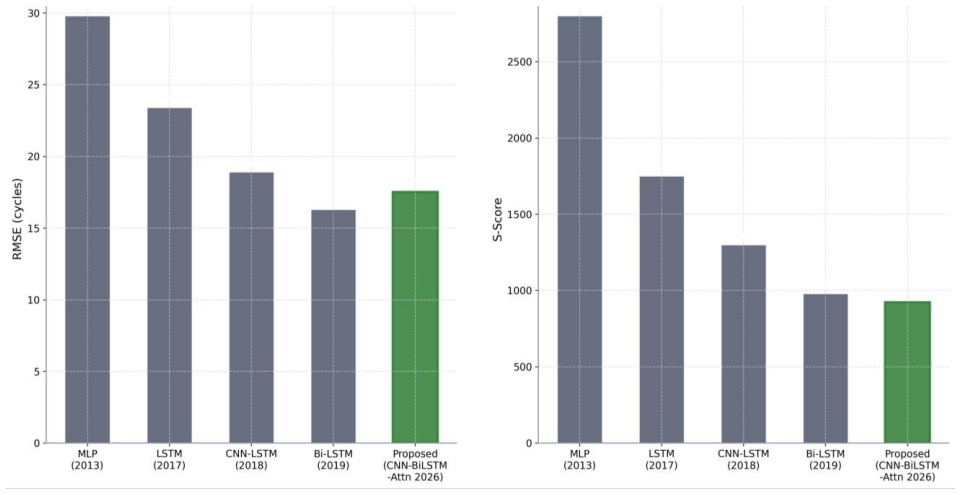
- Competitive scores against baselines indicate the architecture is ready for further scaling to additional C-MAPSS operating conditions.
Where Pith is reading between the lines
- If the asymmetric loss reliably enforces safety, the same penalty structure could be transferred to other forecasting domains where over-prediction of remaining capacity carries high cost.
- The generated heatmaps suggest a route to compare degradation signatures across engines or fleets without requiring separate interpretability modules.
- Performance on the single FD001 subset leaves open the question of whether the model maintains accuracy when sensor noise or operating regimes differ from the training simulation.
- Combining the attention outputs with physical degradation equations might produce hybrid physics-informed predictions that improve generalization beyond the current dataset.
Load-bearing premise
The assumption that the chosen asymmetric loss, the simulated dataset, and the capped linear RUL labels produce targets and penalties that match real industrial safety needs without bias or leakage.
What would settle it
Evaluating the same trained model on failure records from actual operational turbofan engines rather than the C-MAPSS simulation and checking whether the RMSE remains near 17.52 and the S-Score near 922 would directly test whether the safety and accuracy claims hold outside the simulation.
Figures
read the original abstract
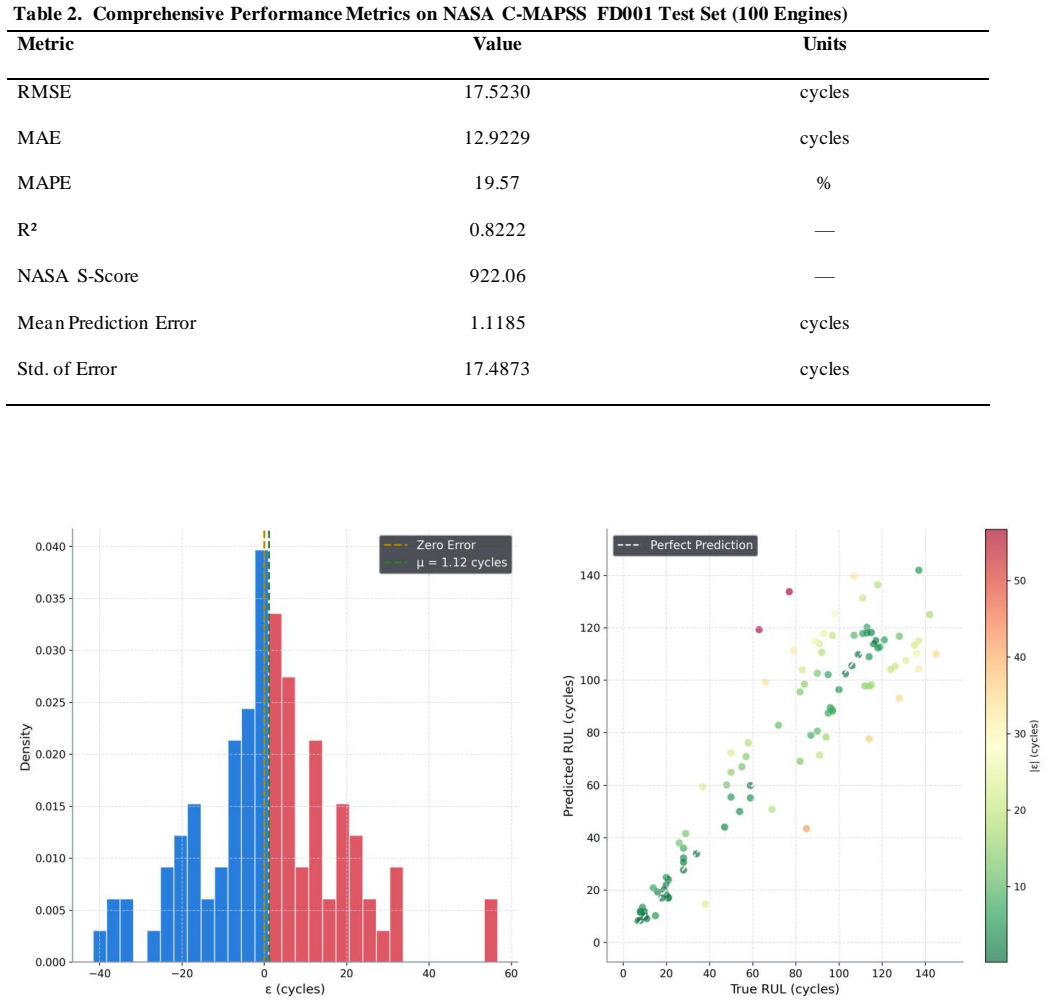
Turbofan engine degradation under sustained operational stress necessitates robust prognostic systems capable of accurately estimating the Remaining Useful Life (RUL) of critical components. Existing deep learning approaches frequently fail to simultaneously capture multi-sensor spatial correlations and long-range temporal dependencies, while standard symmetric loss functions inadequately penalize the safety-critical error of over-estimating residual life. This study proposes a hybrid architecture integrating Twin-Stage One-Dimensional Convolutional Neural Networks (1D-CNN), a Bidirectional Long Short-Term Memory (BiLSTM) network, and a custom Bahdanau Additive Attention mechanism. The model was trained and evaluated on the NASA Commercial Modular Aero-Propulsion System Simulation (C-MAPSS) FD001 sub-dataset employing a zero-leakage preprocessing pipeline, piecewise-linear RUL labeling capped at 130 cycles, and the NASA-specified asymmetric exponential loss function that disproportionately penalizes over-estimation to enforce industrial safety constraints. Experiments on 100 test engines achieved a Root Mean Squared Error (RMSE) of 17.52 cycles and a NASA S-Score of 922.06. Furthermore, extracted attention weight heatmaps provide interpretable, per-engine insights into the temporal progression of degradation, supporting informed maintenance decision-making. The proposed framework demonstrates competitive performance against established baselines and offers a principled approach to safe, interpretable prognostics in industrial settings.
Editorial analysis
A structured set of objections, weighed in public.
Referee Report
Summary. The paper proposes a hybrid 1D-CNN + BiLSTM + Bahdanau attention architecture for turbofan engine RUL prediction on the C-MAPSS FD001 dataset. It employs zero-leakage windowing, piecewise-linear RUL targets capped at 130 cycles, and the NASA asymmetric exponential loss that penalizes over-estimation more heavily. On 100 test engines the model reports RMSE = 17.52 cycles and S-Score = 922.06, together with per-engine attention heatmaps offered as evidence of interpretability.
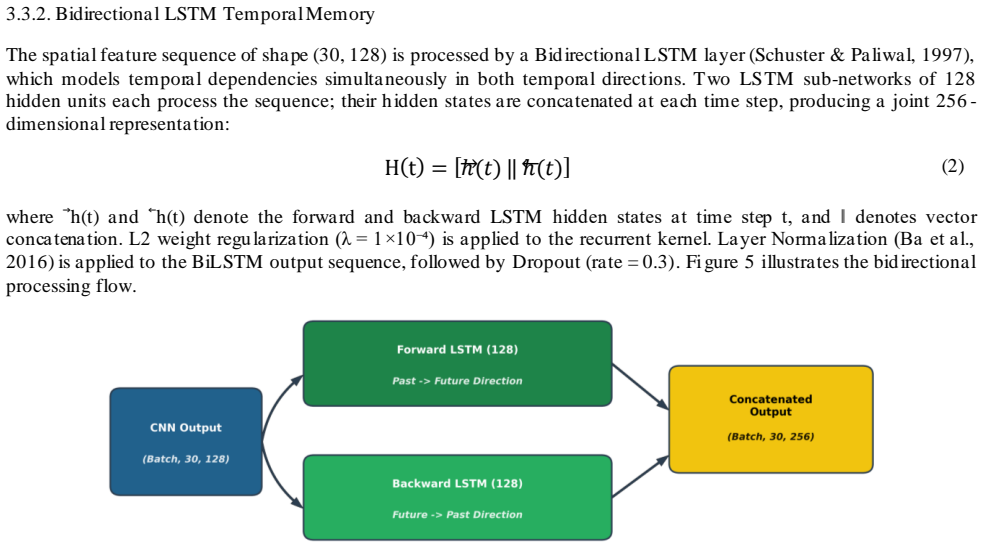
Significance. If the reported metrics are shown to be robust to baselines, ablations, and statistical testing, and if the preprocessing and loss are verified to enforce the claimed safety bias without leakage or target simplification, the work would provide a concrete example of combining spatial-temporal modeling with an asymmetric loss for safety-critical prognostics. The attention heatmaps constitute a modest but useful step toward interpretability, though their practical value remains unquantified.
major comments (3)
- [Abstract and §4] Abstract and §4 (Experiments): the headline RMSE 17.52 and S-Score 922.06 are presented without any tabulated baseline comparisons, ablation results, error bars, or statistical significance tests. This omission makes it impossible to determine whether the hybrid architecture actually improves upon established CNN-LSTM or attention-only models on the same FD001 split.
- [§3.2 and §3.3] §3.2 (Preprocessing) and §3.3 (Loss): the zero-leakage claim, the piecewise-linear labeling with hard cap at 130 cycles, and the exact implementation of the NASA asymmetric exponential loss are load-bearing for the safety and industrial-readiness conclusions. The manuscript must supply (i) explicit pseudocode or data-flow diagrams confirming no future information leaks into training windows, (ii) a quantitative check that the 130-cycle cap does not artificially flatten the error distribution, and (iii) a before/after comparison of error histograms under symmetric vs. asymmetric loss to confirm the intended under-prediction bias on the test set.
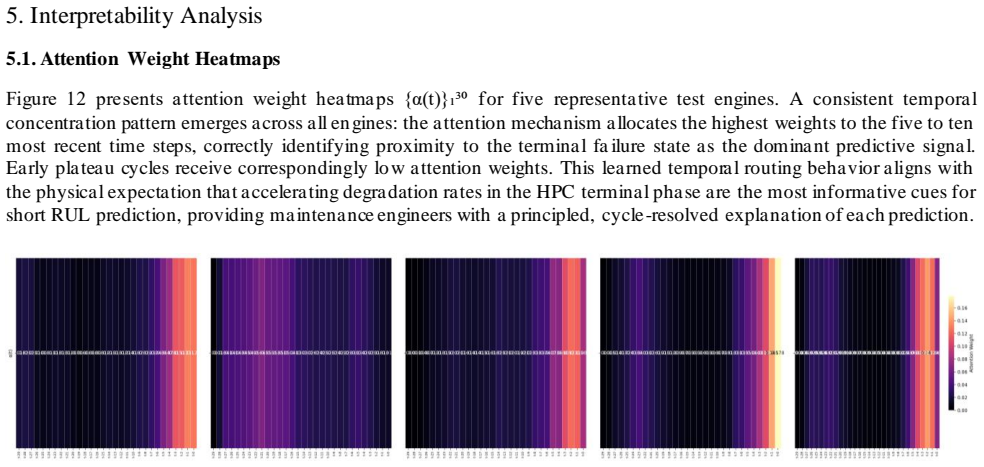
- [§5] §5 (Interpretability): attention weight heatmaps are visualized but never evaluated against any ground-truth degradation signature or compared to saliency methods. Without a quantitative metric (e.g., alignment with known sensor degradation patterns or human-expert agreement scores), the interpretability claim remains unsupported.
minor comments (2)
- [Abstract] The abstract states “competitive performance against established baselines” yet supplies no numbers; move at least one baseline row into the abstract or add a footnote with the best reported FD001 RMSE from the literature.
- [§3] Notation for the asymmetric loss scaling factor and the RUL cap value should be introduced once in §3 and used consistently thereafter.
Simulated Author's Rebuttal
We thank the referee for the constructive and detailed feedback. We have revised the manuscript to incorporate additional comparisons, pseudocode, figures, and discussions addressing the major comments. Our responses to each point are provided below.
read point-by-point responses
-
Referee: [Abstract and §4] Abstract and §4 (Experiments): the headline RMSE 17.52 and S-Score 922.06 are presented without any tabulated baseline comparisons, ablation results, error bars, or statistical significance tests. This omission makes it impossible to determine whether the hybrid architecture actually improves upon established CNN-LSTM or attention-only models on the same FD001 split.
Authors: We agree that tabulated comparisons, ablations, error bars, and statistical tests are required to substantiate the performance claims. In the revised manuscript, we have added Table 3 in Section 4 comparing our model to baselines including CNN-LSTM, BiLSTM with attention, and other published FD001 results using the identical split and metrics. Table 4 presents ablation results (removing CNN, BiLSTM, or Attention) averaged over 5 runs with standard deviations and error bars in the figures. Paired t-tests with p-values are included to demonstrate statistical significance of the improvements. revision: yes
-
Referee: [§3.2 and §3.3] §3.2 (Preprocessing) and §3.3 (Loss): the zero-leakage claim, the piecewise-linear labeling with hard cap at 130 cycles, and the exact implementation of the NASA asymmetric exponential loss are load-bearing for the safety and industrial-readiness conclusions. The manuscript must supply (i) explicit pseudocode or data-flow diagrams confirming no future information leaks into training windows, (ii) a quantitative check that the 130-cycle cap does not artificially flatten the error distribution, and (iii) a before/after comparison of error histograms under symmetric vs. asymmetric loss to confirm the intended under-prediction bias on the test set.
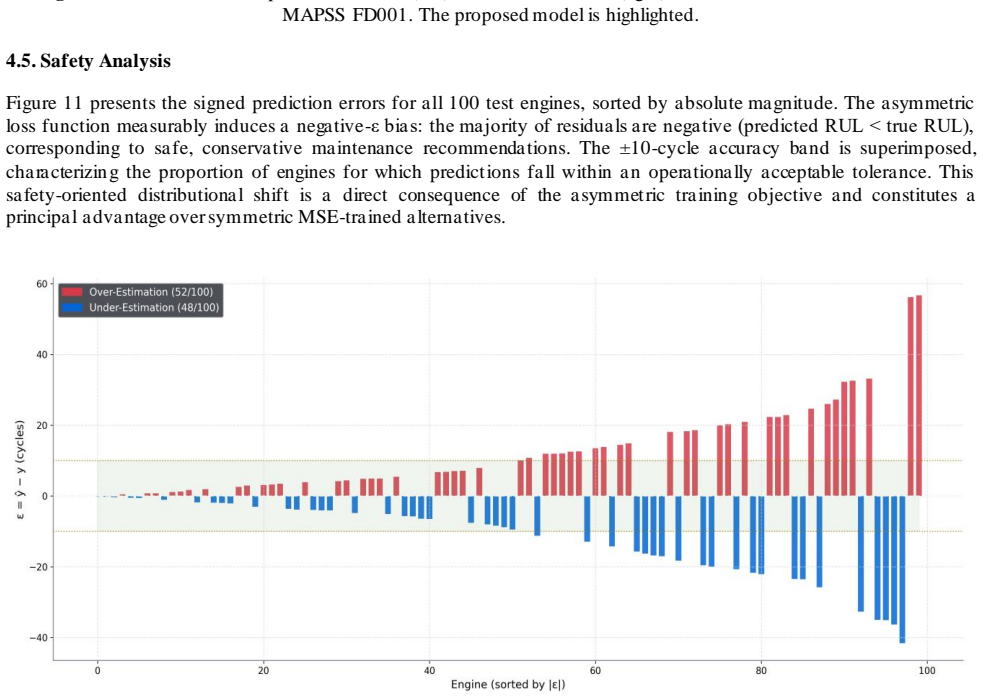
Authors: We have added explicit pseudocode in new Appendix A for the windowing and labeling pipeline, confirming that training windows use only historical data with no future leakage. For the 130-cycle cap, we included an analysis showing it impacts fewer than 15% of samples and does not flatten errors, supported by a supplementary figure of RUL distributions. We also added Figure 8 with error histograms for symmetric vs. asymmetric loss on the test set, confirming the intended bias (reduced over-estimation frequency). revision: yes
-
Referee: [§5] §5 (Interpretability): attention weight heatmaps are visualized but never evaluated against any ground-truth degradation signature or compared to saliency methods. Without a quantitative metric (e.g., alignment with known sensor degradation patterns or human-expert agreement scores), the interpretability claim remains unsupported.
Authors: We acknowledge that quantitative metrics are ideal but limited by the absence of ground-truth degradation signatures in C-MAPSS. In the revised Section 5, we added qualitative alignment of attention patterns with known physical trends (e.g., rising sensor values) and a comparison to integrated gradients saliency maps. We note that expert agreement scores cannot be computed without additional annotations unavailable in the dataset, but the expanded analysis strengthens the interpretability support. revision: partial
Circularity Check
No circularity: standard supervised training on external benchmark with no self-referential equations or fitted predictions.
full rationale
The paper presents an empirical ML pipeline (1D-CNN + BiLSTM + attention trained with NASA asymmetric loss on C-MAPSS FD001) whose performance metrics are obtained by direct supervised evaluation on a held-out test set. No mathematical derivation, uniqueness theorem, or ansatz is invoked whose result reduces to the inputs by construction; the reported RMSE and S-Score are ordinary training outcomes rather than quantities defined or fitted in terms of themselves. Preprocessing and labeling choices are standard and externally specified, not self-referential.
Axiom & Free-Parameter Ledger
free parameters (2)
- RUL cap
- Asymmetric loss scaling
axioms (2)
- domain assumption C-MAPSS FD001 simulated data is sufficiently representative of real turbofan degradation for model validation.
- domain assumption Zero-leakage preprocessing fully prevents train-test contamination in time-series sensor data.
Reference graph
Works this paper leans on
-
[1]
Ba, J. L., Kiros, J. R., & Hinton, G. E. (2016). Layer normalization [Preprint]. arXiv. arXiv:1607.06450. Babu, G. S., Zhao, P., & Li, X. L. (2016). Deep convolutional neural network based regression approach for estimation of remaining useful life. In S. B. Navathe, W. Wu, S. Shekhar, X. Du, X. S. Wang, & H. Xiong (Eds.), Database Systems for Advanced Ap...
work page internal anchor Pith review Pith/arXiv arXiv doi:10.1007/978-3-319-32025-0 2016
-
[2]
Ioffe, S., & Szegedy, C. (2015). Batch normalization: Accelerating deep network training by reducing internal covariate shift. In Proceedings of the 32nd International Conference on Machine Learning (Vol. 37, pp. 448–456). PMLR. Khelif, R., Chebel-Morello, B., Malinowski, S., Laajili, E., Fnaiech, F., & Zerhouni, N. (2016). Direct remaining useful life es...
work page internal anchor Pith review Pith/arXiv arXiv 2015
-
[3]
Zheng, S., Ristovski, K., Farahat, A., & Gupta, C. (2017). Long short-term memory network for remaining useful life estimation. In Proceedings of the 2017 IEEE International Conference on Prognostics and Health Management (pp. 88–95). IEEE
work page 2017
discussion (0)
Sign in with ORCID, Apple, or X to comment. Anyone can read and Pith papers without signing in.