Hole concentrations in doped gray {α}-Sn on InSb and CdTe measured with infrared ellipsometry
Pith reviewed 2026-05-10 10:09 UTC · model grok-4.3
The pith
Infrared ellipsometry extracts heavy hole concentration in α-Sn from the integrated strength of the 0.45 eV absorption peak.
A machine-rendered reading of the paper's core claim, the machinery that carries it, and where it could break.
Core claim
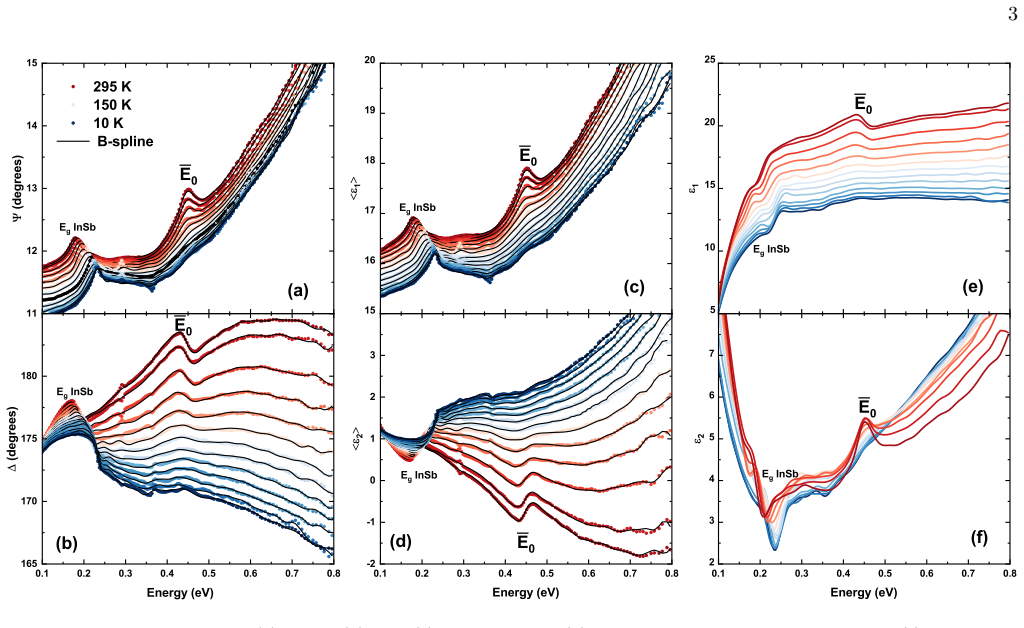
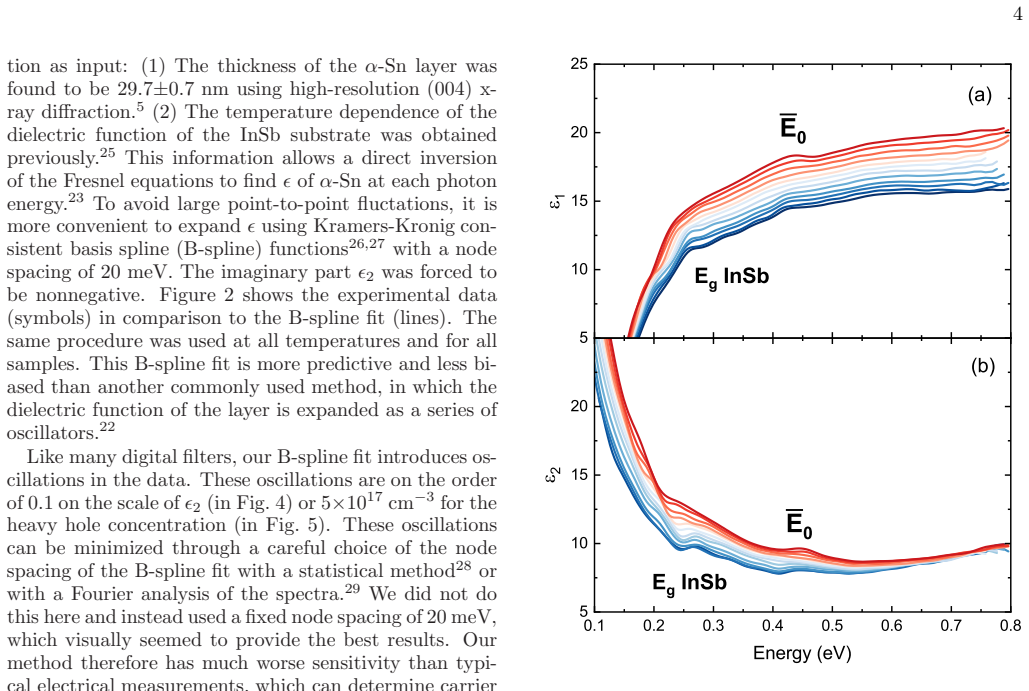
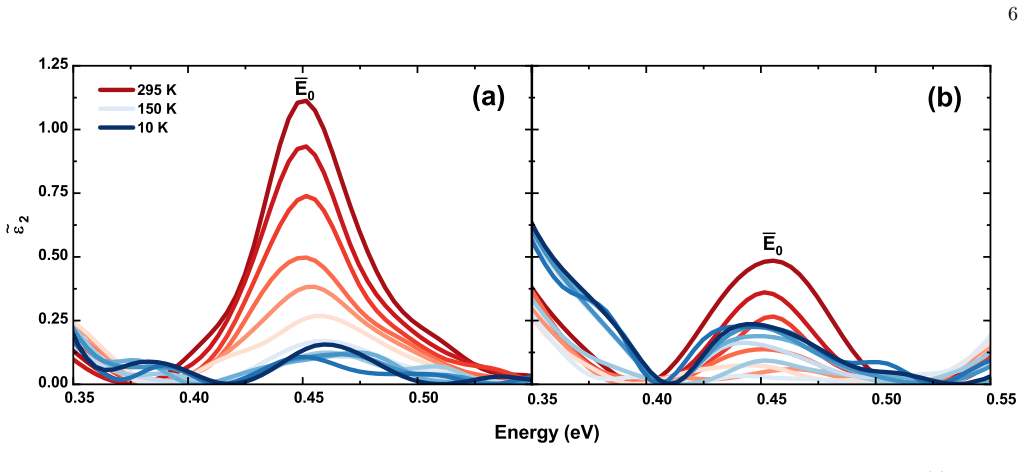
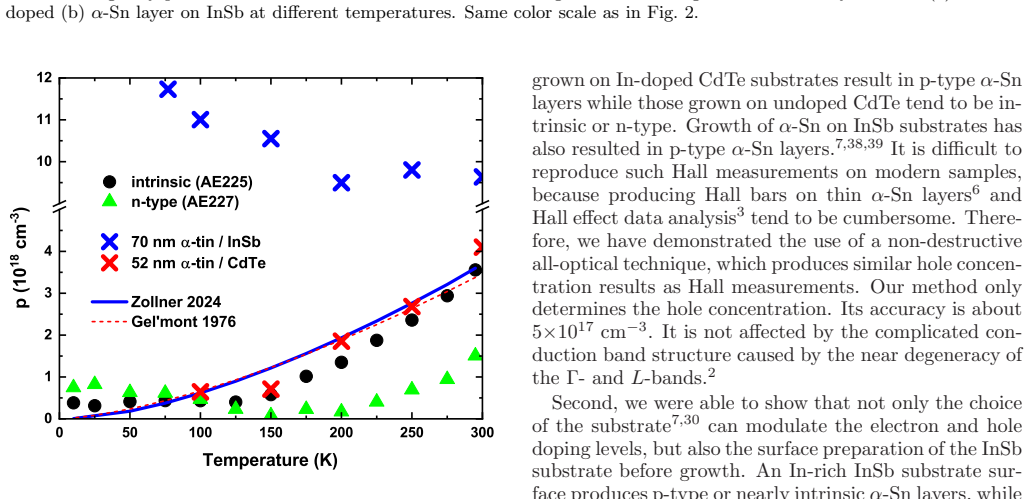
α-Sn layers of 30 nm thickness grown by molecular beam epitaxy on InSb (001) substrates display doping dependent on substrate surface preparation. Fourier-transform infrared ellipsometry determines the dielectric function between 0.03 and 0.8 eV at temperatures from 10 to 300 K. The inverted band structure produces a prominent absorption peak at 0.45 eV corresponding to transitions from the Γ7- to the Γ8+ valence bands. The integrated oscillator strength of this peak, interpreted through the Thomas-Reiche-Kuhn f-sum rule, directly yields the heavy hole concentration. For samples with minimal doping this concentration follows predictions from degenerate Fermi-Dirac statistics, while larger or
What carries the argument
Application of the Thomas-Reiche-Kuhn f-sum rule to the oscillator strength of the 0.45 eV inter-valence-band absorption peak observed in the ellipsometric dielectric function.
Load-bearing premise
The observed absorption peak at 0.45 eV originates exclusively from transitions between the inverted Γ7- valence band and the Γ8+ heavy hole valence band with negligible interference from other optical processes.
What would settle it
If independent measurements of hole concentration such as Hall effect fail to match the values calculated from the integrated peak strength at matching temperatures, the validity of applying the f-sum rule here would be questioned.
Figures
read the original abstract
Gray tin ({\alpha}-Sn) layers with 30 nm thickness were grown on InSb (001) substrates using molecular beam epitaxy. The surface preparation of the substrates was adjusted to achieve either n-type or p-type doping in the {\alpha}-Sn layer. Fourier-transform infrared ellipsometry was used to find the temperature-dependent dielectric function of the {\alpha}-Sn layers from 0.03 to 0.8 eV and from 10 to 300 K. Because of the inverted band structure of {\alpha}-Sn, the spectra show a strong absorption peak at 0.45 eV due to transitions from the inverted {\Gamma_-^7} "electron" valence band to the {\Gamma_+^8} heavy hole valence band. Applying the Thomas-Reiche-Kuhn f-sum rule, the integrated oscillator strength of this peak was used to calculate the heavy hole concentration as a function of temperature. For a nearly intrinsic {\alpha}-Sn layer, the heavy hole concentration agrees well with predictions based on degenerate Fermi-Dirac statistics. Deviations from the intrinsic {\alpha}-Sn carrier concentrations are attributed to substrate surface preparation leading to the diffusion of donor or acceptor ions into the {\alpha}-Sn layer causing n-type or p-type doping.
Editorial analysis
A structured set of objections, weighed in public.
Referee Report
Summary. The manuscript reports MBE growth of 30 nm α-Sn layers on InSb(001) with substrate surface preparation tuned to induce n- or p-type doping. Temperature-dependent FTIR ellipsometry (0.03–0.8 eV, 10–300 K) reveals a strong absorption peak at 0.45 eV attributed to Γ7− → Γ8+ inter-valence-band transitions arising from the inverted band structure. The Thomas-Reiche-Kuhn f-sum rule is applied to the integrated oscillator strength of this peak to extract the heavy-hole concentration p(T). For nearly intrinsic layers this p(T) matches predictions from degenerate Fermi-Dirac statistics; deviations are ascribed to substrate-induced diffusion of donor or acceptor ions.
Significance. If the peak assignment and background subtraction hold, the work supplies a practical optical route to quantify hole densities in thin α-Sn films without Hall contacts, which is useful for characterizing doping in this inverted-band material relevant to topological and spintronic studies. The explicit comparison to Fermi-Dirac statistics for the intrinsic case provides a useful internal consistency check.
major comments (2)
- [Abstract and f-sum-rule analysis section] Abstract and f-sum-rule analysis section: the extraction of heavy-hole concentration from the integrated strength of the 0.45 eV peak via the Thomas-Reiche-Kuhn sum rule assumes that ε2(ω) in the 0.3–0.6 eV window arises solely from Γ7− → Γ8+ transitions. No quantitative bound is given on possible overlapping contributions from light-hole Γ8 branches, Γ6–Γ8 transitions, or residual Drude absorption, nor on the sensitivity of the integrated strength to the precise energy limits chosen for integration. This assumption is load-bearing for the reported p(T) values.
- [Ellipsometric inversion and thin-film modeling section] Ellipsometric inversion and thin-film modeling section: for a 30 nm α-Sn layer on InSb or CdTe, the extracted ε2(ω) depends on accurate knowledge of the substrate dielectric functions, any interface diffusion layers, and surface roughness. The manuscript should supply the specific multilayer model, fitted parameters, and residual errors to demonstrate that these do not introduce systematic artifacts into the 0.3–0.6 eV range used for the sum-rule integral.
minor comments (2)
- [Abstract] The abstract states the temperature range but does not indicate whether spectra were acquired at every temperature or interpolated; explicit statement would improve clarity.
- Figure captions for the dielectric-function spectra should note the integration window used for the f-sum rule and any uncertainty estimates on the extracted concentrations.
Simulated Author's Rebuttal
We thank the referee for the careful reading of our manuscript and the constructive comments. We respond to each major comment below, indicating planned revisions where appropriate.
read point-by-point responses
-
Referee: [Abstract and f-sum-rule analysis section] Abstract and f-sum-rule analysis section: the extraction of heavy-hole concentration from the integrated strength of the 0.45 eV peak via the Thomas-Reiche-Kuhn sum rule assumes that ε2(ω) in the 0.3–0.6 eV window arises solely from Γ7− → Γ8+ transitions. No quantitative bound is given on possible overlapping contributions from light-hole Γ8 branches, Γ6–Γ8 transitions, or residual Drude absorption, nor on the sensitivity of the integrated strength to the precise energy limits chosen for integration. This assumption is load-bearing for the reported p(T) values.
Authors: We agree that the spectral isolation of the 0.45 eV feature requires more explicit support. The peak assignment rests on the established inverted band structure of α-Sn, where the Γ7−–Γ8+ separation is known to lie near 0.45 eV. Light-hole (Γ8) to heavy-hole transitions are expected at much lower energies, Γ6–Γ8 transitions lie above ~0.6 eV, and Drude absorption is restricted to <0.1 eV for the carrier densities in our films. To strengthen the manuscript, we will add a quantitative estimate of possible overlap by integrating model ε2(ω) contributions derived from literature band parameters, showing that extraneous terms contribute less than 10 % to the 0.3–0.6 eV integral. We will also tabulate the extracted p(T) for integration windows shifted by ±0.05 eV to demonstrate that the temperature dependence remains robust. These additions will appear in a revised version. revision: partial
-
Referee: [Ellipsometric inversion and thin-film modeling section] Ellipsometric inversion and thin-film modeling section: for a 30 nm α-Sn layer on InSb or CdTe, the extracted ε2(ω) depends on accurate knowledge of the substrate dielectric functions, any interface diffusion layers, and surface roughness. The manuscript should supply the specific multilayer model, fitted parameters, and residual errors to demonstrate that these do not introduce systematic artifacts into the 0.3–0.6 eV range used for the sum-rule integral.
Authors: We concur that full documentation of the optical model is necessary. The data were inverted with a four-layer stack (substrate / thin interface diffusion layer / 30 nm α-Sn / surface roughness layer treated via Bruggeman effective-medium approximation). Substrate ε(ω) values were taken from separate measurements on bare InSb and CdTe. To address the comment, the revised manuscript will include the exact layer thicknesses and roughness parameters obtained from the fits, together with the mean-squared-error values and representative plots of measured versus modeled Ψ and Δ over 0.03–0.8 eV. These will confirm that fit residuals remain low across the 0.3–0.6 eV window used for the sum-rule integral, with no evidence of systematic artifacts. revision: yes
Circularity Check
No circularity: hole concentration extracted via standard f-sum rule from measured absorption, then compared to independent statistics
full rationale
The derivation proceeds from ellipsometric measurement of ε(ω) (0.03–0.8 eV, 10–300 K) on 30 nm α-Sn films, identification of the 0.45 eV peak as Γ7− → Γ8+ transitions (based on known inverted band structure), integration of oscillator strength, and direct application of the Thomas-Reiche-Kuhn f-sum rule to obtain p(T). This p(T) is compared to separate predictions from degenerate Fermi-Dirac statistics. No equation reduces the reported concentration to a fitted parameter, self-referential definition, or load-bearing self-citation. The f-sum rule is an external physical identity; deviations are attributed to substrate diffusion but do not alter the extraction step. The paper is self-contained against external benchmarks.
Axiom & Free-Parameter Ledger
axioms (1)
- standard math Thomas-Reiche-Kuhn f-sum rule relates integrated oscillator strength of the 0.45 eV peak directly to heavy-hole concentration
Reference graph
Works this paper leans on
-
[1]
S.\ Groves and W.\ Paul, Phys.\ Rev.\ Lett.\ 11 , 194 (1963)
work page 1963
-
[2]
A.\ W.\ Ewald, Helvetica Physica Acta 41 , 795 (1968)
work page 1968
-
[3]
C.\ F.\ Lavine and A.\ W.\ Ewald, J.\ Phys.\ Chem.\ Solids 32 , 1121 (1971)
work page 1971
-
[4]
B.\ L.\ Gel'mont, V.\ I.\ Ivanov-Omski , and I.\ M.\ Tsidilkovski , Sov.\ Phys.\ Usp.\ 19 , 879 (1976)
work page 1976
-
[5]
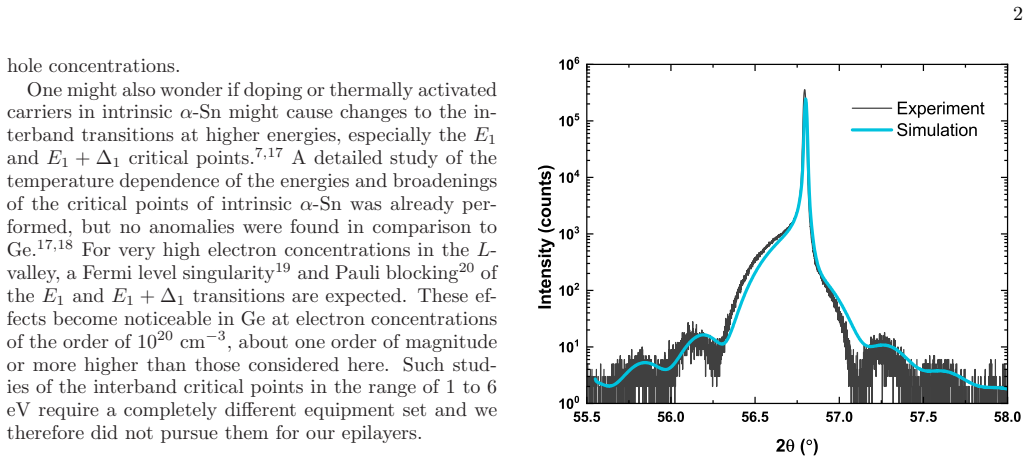
R.\ A.\ Carrasco, S.\ Zollner, S.\ A.\ Chastang, J.\ Duan, G.\ J.\ Grzybowski, B.\ B.\ Claflin, and A.\ M.\ Kiefer, Appl.\ Phys.\ Lett.\ 114 , 062012 (2019)
work page 2019
-
[6]
A.\ N.\ Engel, C.\ P.\ Dempsey, H.\ S.\ Inbar, J.\ T.\ Dong, S.\ Nishihaya, Y.\ Chang, A.\ V.\ Fedorov, M.\ Hashimoto, D.\ Lu, Donghui, and C.\ J.\ Palmstr m, Phys.\ Rev.\ Mater.\ 8 , 044202 (2024)
work page 2024
-
[7]
R.\ A.\ Carrasco, C.\ M.\ Zamarripa, S.\ Zollner, J.\ Men\'endez, S.\ A.\ Chastang, J.\ Duan, G.\ J.\ Grzybowski, B.\ B.\ Claflin, and A.\ M.\ Kiefer, Appl.\ Phys.\ Lett.\ 113 , 232104 (2018)
work page 2018
-
[8]
S.\ H.\ Groves, C.\ R.\ Pidgeon, A.\ W.\ Ewald, and R.\ J.\ Wagner, J.\ Phys.\ Chem.\ Solids 31 , 2031 (1970)
work page 2031
-
[9]
Y.\ Guldner, C.\ Rigaux, M.\ Grynberg, and A.\ Mycielski, Phys.\ Rev.\ B 8 , 3875 (1973)
work page 1973
-
[10]
M.\ Dobrowolska, A.\ Mycielski, and W.\ Dobrowolski, Solid State Commun.\ 27 , 1233 (1978)
work page 1978
-
[11]
F.\ Raymond and C.\ Verie, Surf.\ Sci.\ 37 , 515 (1973)
work page 1973
-
[12]
S.\ Zollner, J.\ Vac.\ Sci.\ Technol.\ B 42 , 022203 (2024)
work page 2024
-
[13]
S.\ Zollner, F.\ Abadizaman, C.\ Emminger, and N.\ Samarasingha, Adv.\ Opt.\ Techn.\ 11 , 117 (2022)
work page 2022
-
[14]
F.\ Stern, in Solid-State Physics , edited by F.\ Seitz and D.\ Turnbull, vol.\ 15 (Academic, New York, 1963), p.\ 300
work page 1963
-
[15]
Nussenzveig, and D.\ Y.\ Smith, Phys.\ Rev.\ B 6 , 4502 (1972)
M.\ Altarelli, D.\ L.\ Dexter, H.\ M. Nussenzveig, and D.\ Y.\ Smith, Phys.\ Rev.\ B 6 , 4502 (1972)
work page 1972
-
[16]
D.\ Y.\ Smith, in Handbook of Optical Constants of Solids , edited by E.\ D.\ Palik (Academic, San Diego, 1998), p.\ 35
work page 1998
-
[17]
L.\ Vi\ na, H. H\"ochst, and M. Cardona, Phys.\ Rev.\ B.\ 31 , 958 (1985)
work page 1985
-
[18]
L.\ Vi\ na, S.\ Logothetidis, and M.\ Cardona, Phys.\ Rev.\ B.\ 30 , 1979 (1984)
work page 1979
-
[19]
C.\ Xu, N.\ S.\ Fernando, S.\ Zollner, J.\ Kouvetakis, and Jose Menendez, Phys.\ Rev.\ Lett.\ 118 , 267402 (2017)
work page 2017
-
[20]
C.\ A.\ Armenta, M.\ Zahradnik, M.\ Rebarz, C.\ Emminger, S.\ Espinoza, S.\ Vazquez-Miranda, J.\ Andreasson, and S.\ Zollner, J.\ Appl.\ Phys.\ 138 , 205702 (2025)
work page 2025
-
[21]
Malvern Panalytical B.V., Almelo, Netherlands
-
[22]
H.\ Fujiwara, Spectroscopic Ellipsometry (Wiley, Chichester, 2007)
work page 2007
-
[23]
H.\ G.\ Tompkins and J.\ N.\ Hilfiker, Spectroscopic Ellipsometry: Practical Application to Thin-Film Characterization (Momentum, New York, 2016)
work page 2016
-
[24]
M.\ Schubert, Infrared Ellipsometry on Semiconductor Layer Structures: Phonons, Plasmons, and Polaritons (Springer, Berlin, 2004)
work page 2004
-
[25]
Love, S.\ Yadav, and S.\ Zollner, J.\ Vac.\ Sci.\ Technol.\ B 41 , 022203 (2023)
M.\ Rivero Arias, C.\ A.\ Armenta, C.\ Emminger, C.\ M.\ Zamarripa, N.\ S.\ Samarasingha, J.\ R. Love, S.\ Yadav, and S.\ Zollner, J.\ Vac.\ Sci.\ Technol.\ B 41 , 022203 (2023)
work page 2023
-
[26]
J.\ Mohrmann, T.\ E.\ Tiwald, J.\ S.\ Hale, J.\ N.\ Hilfiker, A.\ C.\ Martin, J.\ Vac.\ Sci.\ Technol.\ B 38 , 014001 (2020)
work page 2020
-
[27]
D.\ V.\ Likhachev, Thin Solid Films 636 , 519 (2017)
work page 2017
-
[28]
D.\ V.\ Likhachev, Thin Solid Films 762 , 139545 (2022)
work page 2022
-
[29]
V.\ L.\ Le, T.\ J.\ Kim, Y.\ D.\ Kim, and D.\ E.\ Aspnes, J.\ Vac.\ Sci.\ Technol.\ B 37 , 052903 (2019)
work page 2019
-
[30]
C.\ A.\ Hoffman, J.\ R.\ Meyer, R.\ J.\ Wagner, F.\ J.\ Bartoli, M.\ A.\ Engelhardt, and H.\ H\"ochst, Phys.\ Rev.\ B 40 , 11693 (1989)
work page 1989
-
[31]
B.\ V.\ Olson, E.\ A.\ Kaldec, J.\ K.\ Kim, J.\ F.\ Klem, S.\ D.\ Hawkins, E.\ A.\ Shaner, and M.\ E.\ Flatt\'e, Phys.\ Rev.\ Appl.\ 3 , 044010 (2015)
work page 2015
-
[32]
E.\ O.\ Kane, J.\ Phys.\ Chem.\ Solids 1 , 249 (1957)
work page 1957
-
[33]
J. J. Hopfield, Phys. Rev. B 2 , 973 (1970)
work page 1970
-
[34]
Wooten, Optical Properties of Solids (Academic, New York, 1972)
F. Wooten, Optical Properties of Solids (Academic, New York, 1972)
work page 1972
-
[35]
D.\ V.\ Tsu and N.\ Baule, J.\ Vac.\ Sci.\ Technol.\ A 43 , 052201 (2025)
work page 2025
-
[36]
Z. Li, L. Zhang, W. Liu, Y. Yu, S. Huang, X. Li, Y. Yang, K. Jiang, F. Meng, and Z. Liu, Eur.\ Phys.\ J.\ Plus 137 , 862 (2022)
work page 2022
-
[37]
S. Zollner, C. Lin, E.\ Sch\"onherr, A.\ B\"ohringer, and M.\ Cardona, J.\ Appl.\ Phys.\ 66 , 383 (1989)
work page 1989
-
[38]
A.\ Barfuss, L.\ Dudy, M.\ R.\ Scholz, H.\ Roth, P.\ H\"opfner, C.\ Blumenstein, G.\ Landolt, J.\ H.\ Dil, N.\ C.\ Plumb, M.\ Radovic, A.\ Bostwick, E.\ Rotenberg, A.\ Fleszar, G.\ Bihlmayer, D.\ Wortmann, G.\ Li, W.\ Hanke, R.\ Claessen, and J.\ Sch\"afer, Phys.\ Rev.\ Lett.\ 111 , 157205 (2013); 112 , 239903 (2014) (E)
work page 2013
-
[39]
H.\ U.\ Middelmann, L.\ Sorba, V.\ Hinkel, and K.\ Horn, Phys. Rev. B 35 , 718 (1987)
work page 1987
discussion (0)
Sign in with ORCID, Apple, or X to comment. Anyone can read and Pith papers without signing in.