Quantifying the Salience of Geo-Cultural Values for Pluralistic Safety Alignment
Pith reviewed 2026-06-28 19:36 UTC · model grok-4.3
The pith
Geo-cultural zone membership explains variance in safety ratings beyond standard demographics.
A machine-rendered reading of the paper's core claim, the machinery that carries it, and where it could break.
Core claim
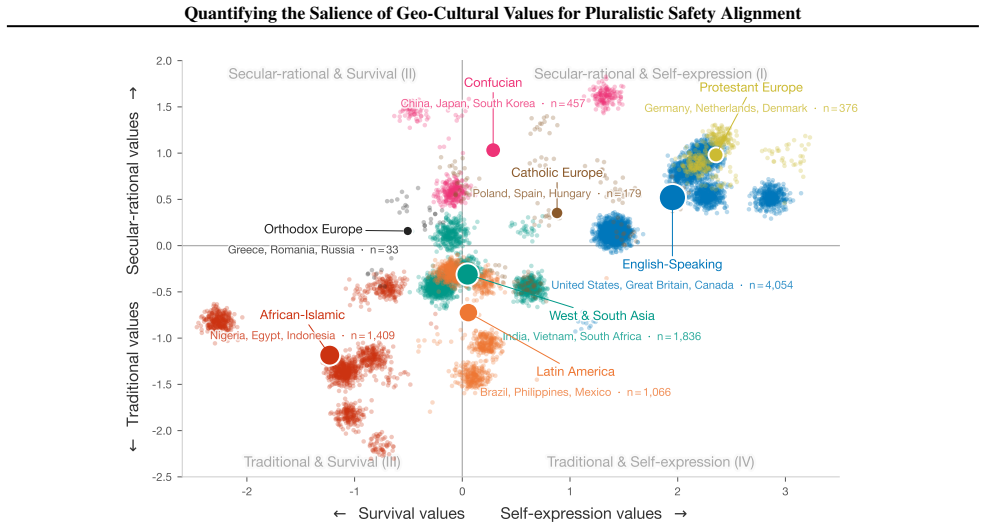
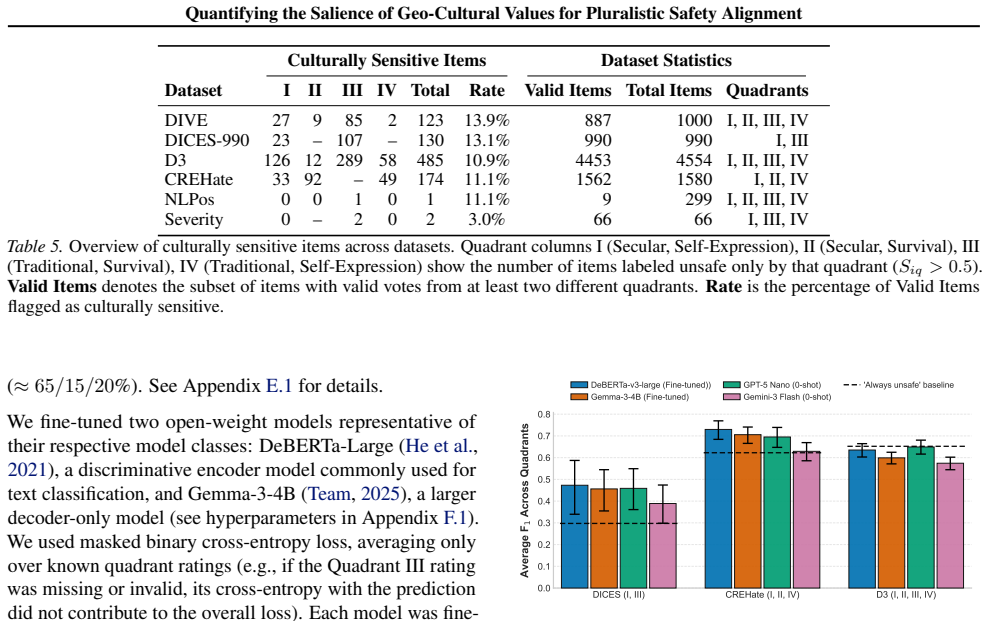
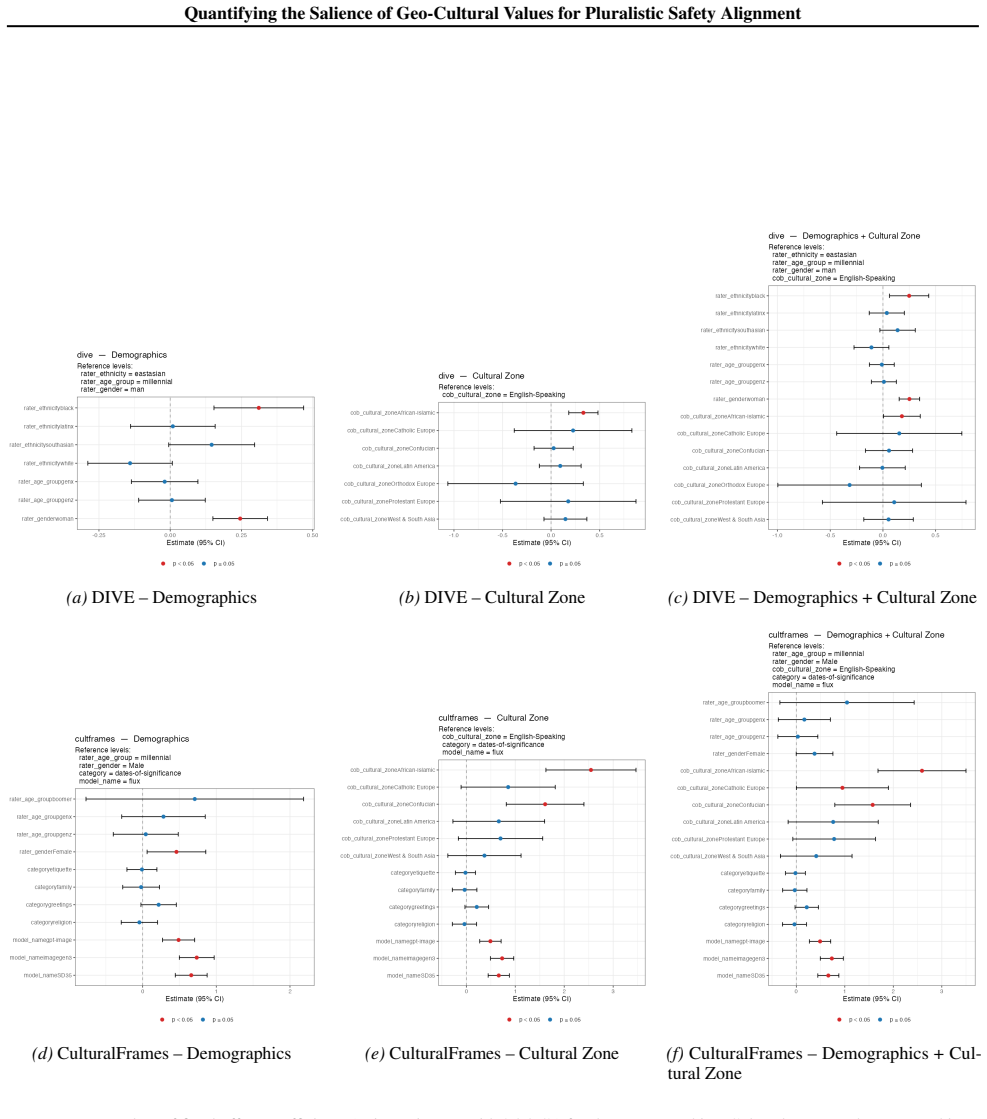
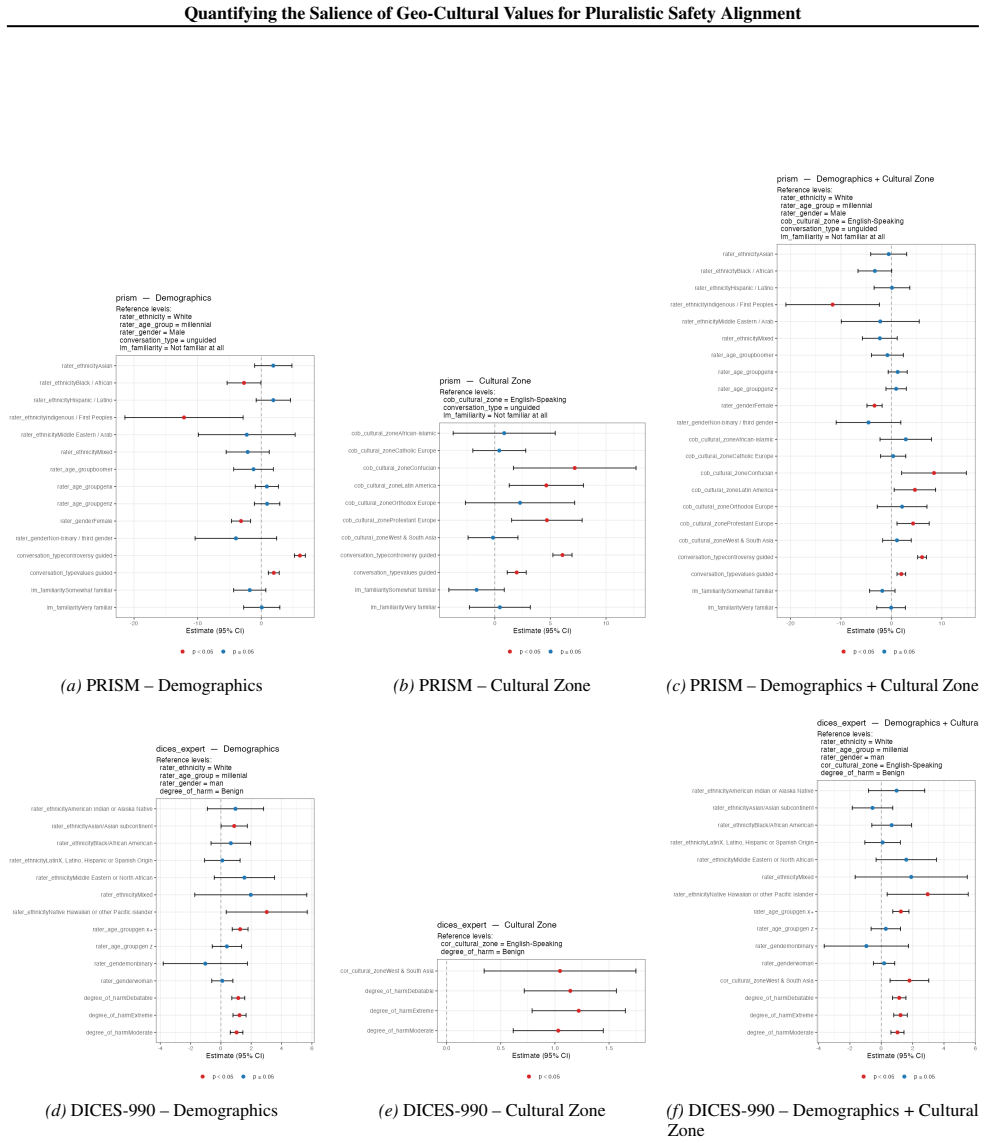
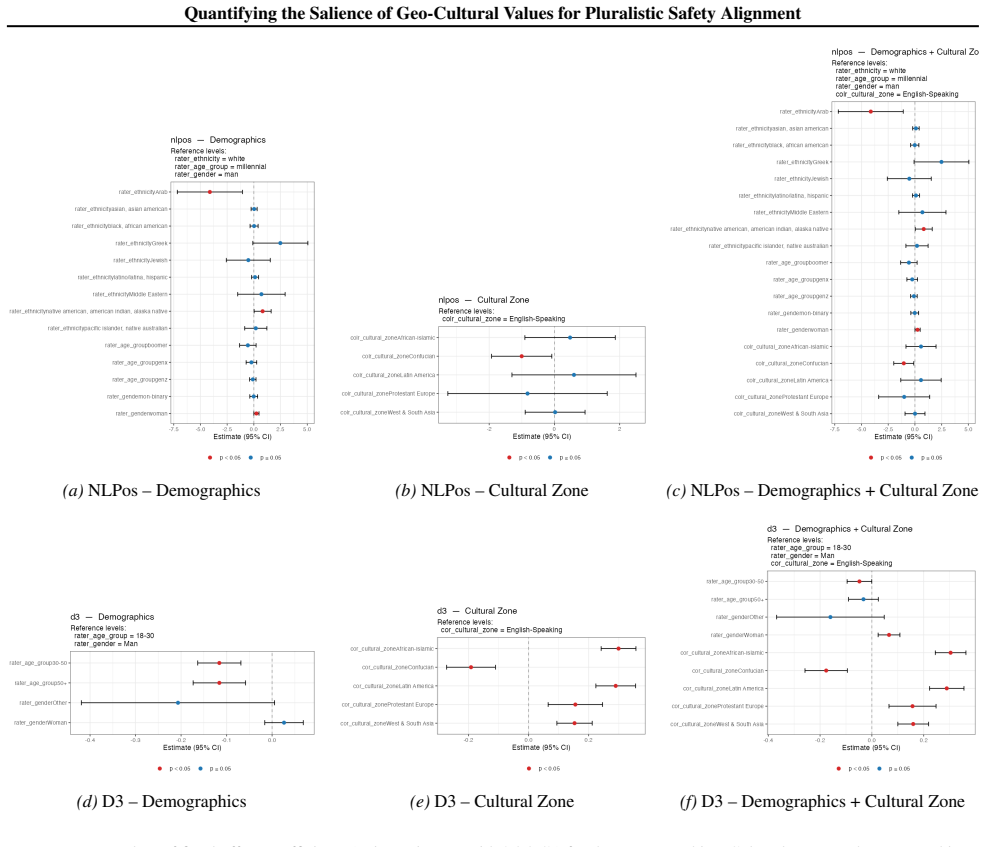
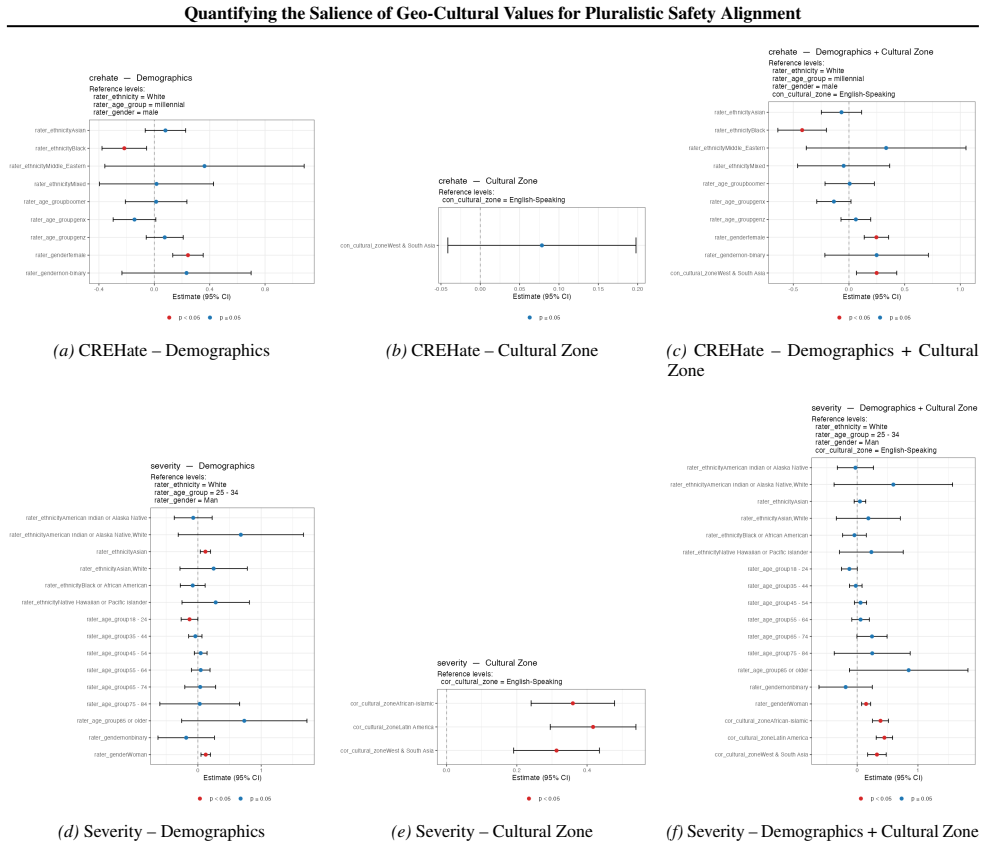
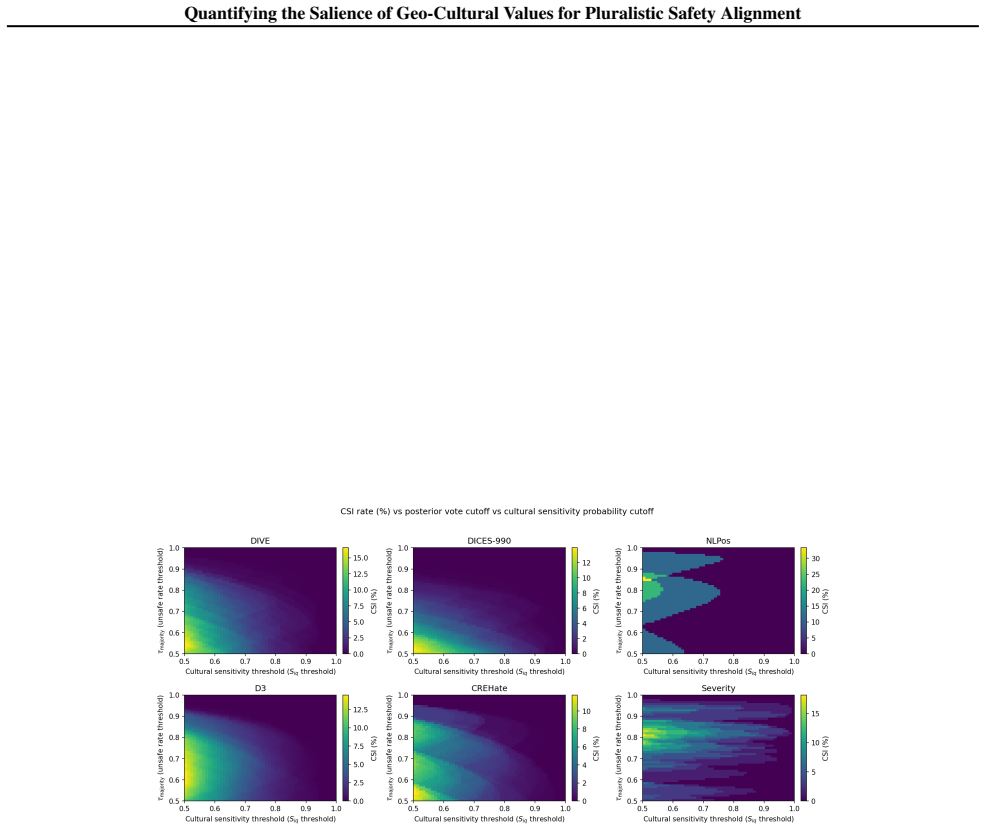
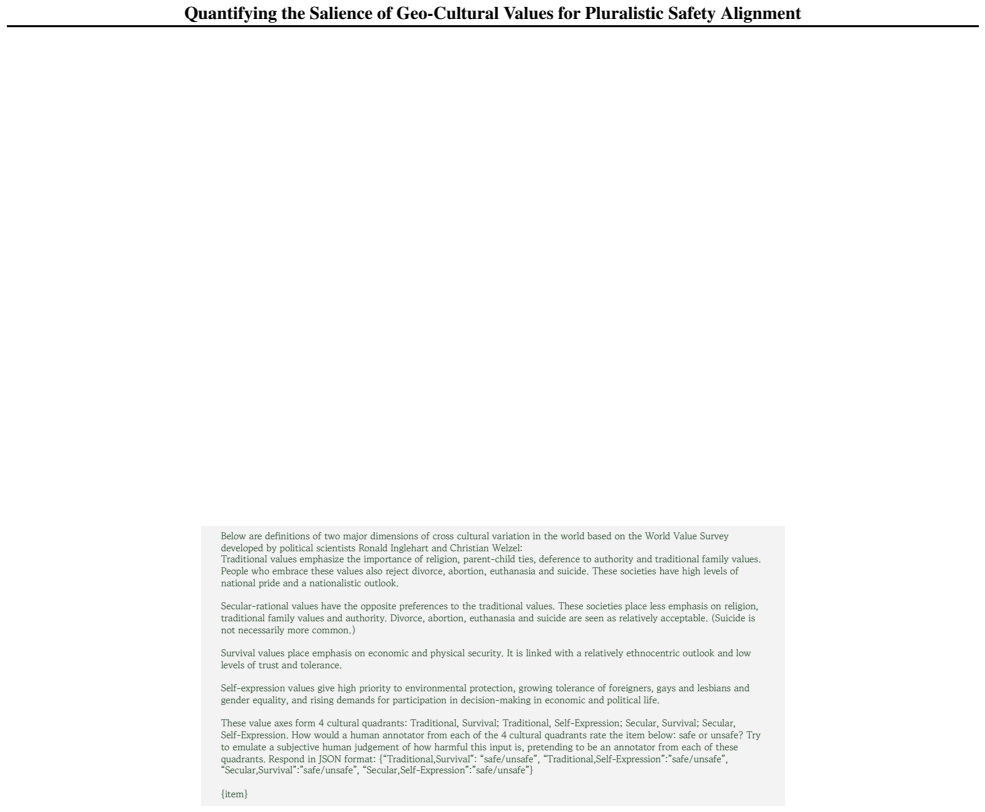
Using multilevel modeling on safety datasets and Inglehart-Welzel cultural dimensions, cultural zone membership accounts for additional variance in safety ratings beyond demographics with p less than 0.05 across six datasets. Roughly 10 percent of items in the examined datasets are culturally sensitive and likely to be misclassified as safe without adequate cultural representation in rater pools.
What carries the argument
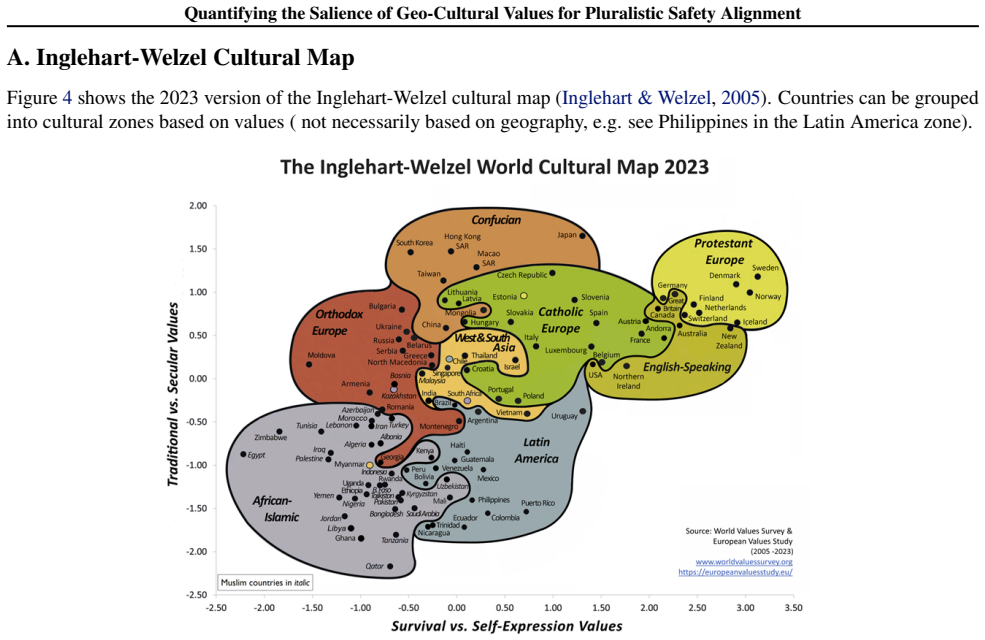
Multilevel modeling that isolates the extra variance explained by cultural zone membership after demographic controls, using Inglehart-Welzel dimensions to define the zones.
If this is right
- Most safety datasets lack geo-cultural metadata and a consistent way to analyze it jointly with demographics.
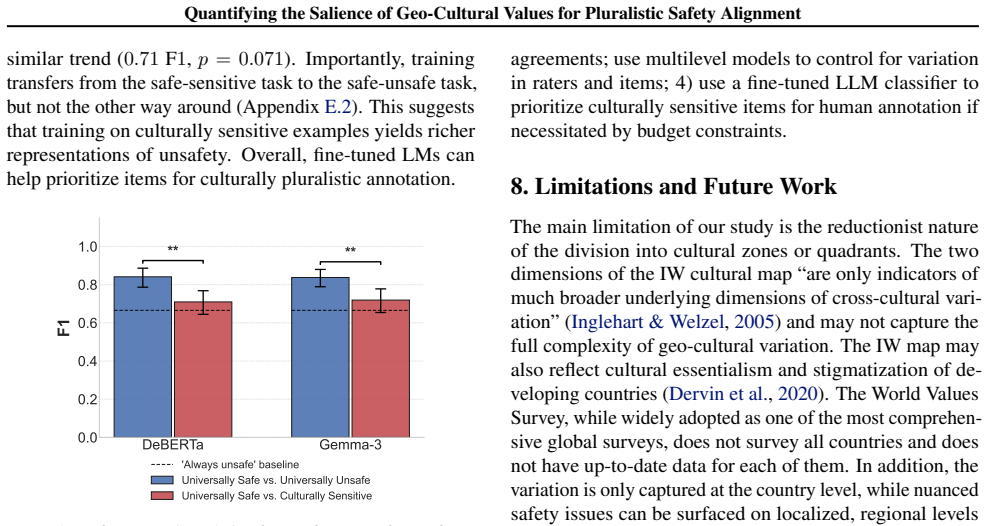
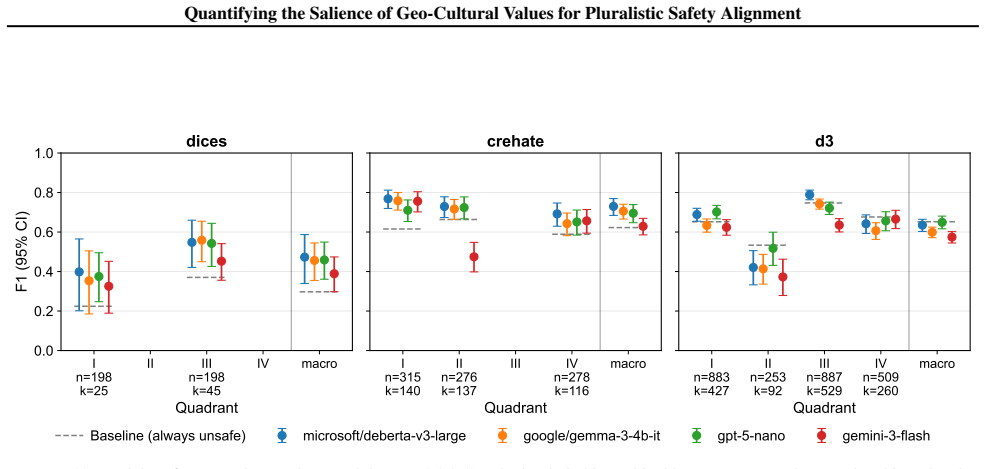
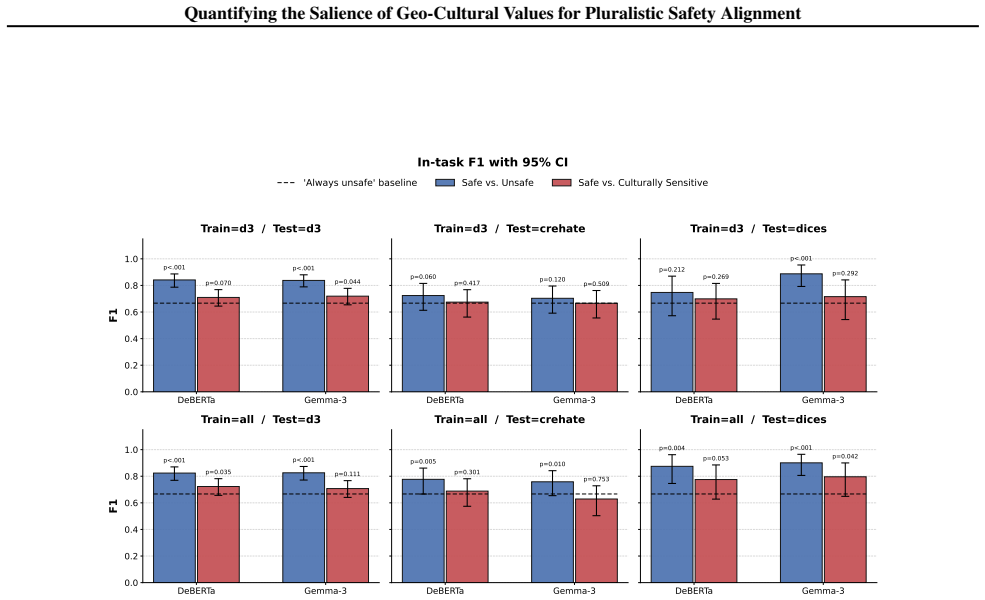
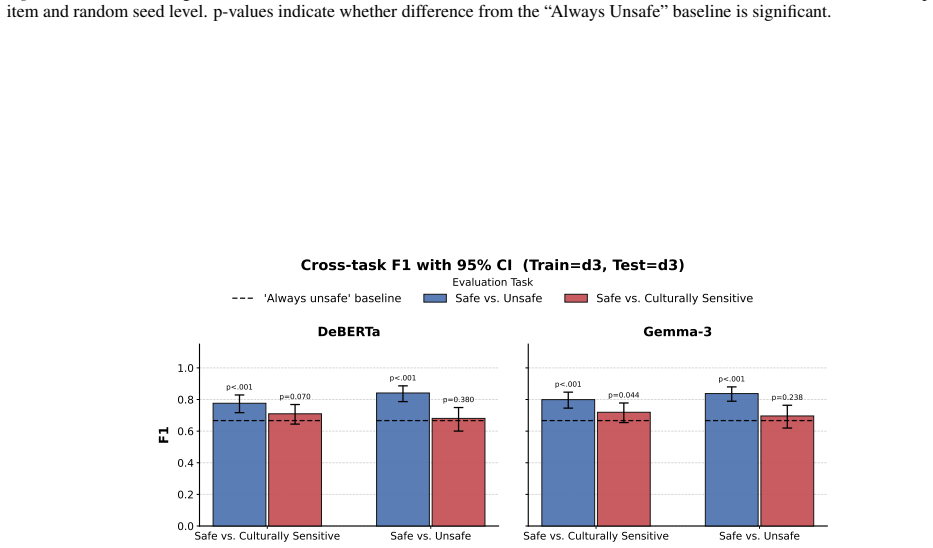
- Current LLMs cannot reliably replace human raters from varied cultural zones but can triage culturally sensitive items for targeted human review.
- Safety evaluation protocols should expand rater pools to include multiple cultural zones to reduce misclassification of roughly 10 percent of items.
- Pluralistic alignment requires deliberate collection of geo-cultural information alongside standard demographic variables.
Where Pith is reading between the lines
- Safety benchmarks could be stratified by cultural zone to produce separate performance reports rather than a single aggregate score.
- Region-specific fine-tuning or guardrails might be needed for models deployed in zones that diverge strongly on the sensitive items identified here.
- New datasets should record both cultural zone and exact location to allow finer-grained checks on whether the Inglehart-Welzel grouping captures the relevant variation.
Load-bearing premise
The Inglehart-Welzel cultural dimensions and the available safety datasets provide a valid, non-confounded basis for isolating geo-cultural effects after demographic controls.
What would settle it
Re-running the multilevel models on the same datasets and finding that cultural zone membership no longer adds significant explanatory power once demographics are included, with p values above 0.05.
Figures
read the original abstract
Safe global deployment of AI models requires alignment with human values that vary across cultures. Yet rater pools in safety evaluation datasets remain largely geographically homogeneous, failing to capture geo-cultural differences. Further, it remains unclear whether such differences persist after controlling for demographics such as age, gender, and ethnicity. Through a meta-analysis of safety datasets, we find that most do not report geo-cultural information, and those that do lack a unified methodology to jointly analyze geo-cultural and demographic correlates. Using the Inglehart-Welzel dimensions of cross-cultural variation, we demonstrate via multilevel modeling that cultural zone membership explains variance in safety ratings beyond standard demographics (p<0.05 across 6 datasets). Moreover, our analysis indicates that roughly 10% of items in the datasets we examined are culturally sensitive: likely to be misclassified as safe without adequate cultural representation. We evaluate LLMs as both rater surrogates and triage tools, finding that current LLMs do not reliably stand in for raters, though they can help prioritize culturally sensitive items for human annotation. Our findings motivate more culturally pluralistic safety evaluation and offer practical takeaways to support it.
Editorial analysis
A structured set of objections, weighed in public.
Referee Report
Summary. The manuscript conducts a meta-analysis of safety evaluation datasets for AI models, finding that most lack geo-cultural information and those that report it lack unified methodology for joint analysis with demographics. Using Inglehart-Welzel cultural dimensions, the authors apply multilevel modeling to six datasets and report that cultural zone membership explains additional variance in safety ratings beyond controls for age, gender, and ethnicity (p<0.05). They estimate that roughly 10% of items are culturally sensitive (likely misclassified without cultural representation) and evaluate LLMs as rater surrogates and triage tools, concluding that current LLMs are unreliable substitutes for human raters but can help prioritize items for annotation.
Significance. If the central empirical results hold after addressing modeling details, the work is significant for AI safety and computational social science. It supplies quantitative evidence that geo-cultural factors contribute to safety judgments independently of standard demographics, quantifies the scale of culturally sensitive items, and provides practical guidance on using LLMs for triage. Strengths include the cross-dataset meta-analysis, use of established cultural dimensions, and falsifiable statistical claims (p-values and percentage estimates). This supports calls for pluralistic safety evaluation with concrete, testable implications for dataset design and annotation practices.
major comments (3)
- [§3] §3 (Methods, multilevel modeling): The central claim that cultural zone membership explains variance beyond demographics (p<0.05) requires explicit reporting of the model specification, including random effects structure, zone coding (e.g., dummy variables vs. random intercepts), and diagnostics for multicollinearity or correlation between zone assignment and the demographic controls. Without these, it is impossible to confirm that the additional variance is not an artifact of collinearity or zone-assignment method, which directly bears on the skeptic's concern about isolation of geo-cultural effects.
- [§4] §4 (Results, dataset selection): The criteria used to select the six datasets from those reporting geo-cultural data, and the precise geo-coding procedure applied to them, are not described in sufficient detail. This is load-bearing because the abstract acknowledges that most datasets lack such information and lack unified methodology; selection effects could confound the reported cultural contribution.
- [§4.2] §4.2 (Results, 10% culturally sensitive items): The operational definition of 'culturally sensitive' items and any sensitivity analyses to alternative thresholds, zone definitions, or model specifications are not provided. This percentage is used to motivate the practical takeaways and must be shown to be robust.
minor comments (2)
- [Abstract] Abstract: While statistical significance is reported, effect sizes (e.g., variance explained or odds ratios) should be included to allow readers to assess practical significance alongside p<0.05.
- [Figures] Figure clarity: The figures showing model results or zone distributions would benefit from clearer labeling of confidence intervals and sample sizes per zone.
Simulated Author's Rebuttal
We thank the referee for their constructive comments, which highlight important areas for improving the transparency and robustness of our analysis. We address each major comment below and will revise the manuscript accordingly where details were insufficiently reported.
read point-by-point responses
-
Referee: [§3] §3 (Methods, multilevel modeling): The central claim that cultural zone membership explains variance beyond demographics (p<0.05) requires explicit reporting of the model specification, including random effects structure, zone coding (e.g., dummy variables vs. random intercepts), and diagnostics for multicollinearity or correlation between zone assignment and the demographic controls. Without these, it is impossible to confirm that the additional variance is not an artifact of collinearity or zone-assignment method, which directly bears on the skeptic's concern about isolation of geo-cultural effects.
Authors: We agree that the model specification details are necessary for full evaluation of the results. In the revised manuscript, we will explicitly report the multilevel model formula, the random effects structure (random intercepts for datasets and items), the use of dummy variables for cultural zone membership based on Inglehart-Welzel classifications, and multicollinearity diagnostics including variance inflation factors and correlation matrices between zone indicators and demographic controls. These additions will demonstrate that the reported variance is not attributable to collinearity. revision: yes
-
Referee: [§4] §4 (Results, dataset selection): The criteria used to select the six datasets from those reporting geo-cultural data, and the precise geo-coding procedure applied to them, are not described in sufficient detail. This is load-bearing because the abstract acknowledges that most datasets lack such information and lack unified methodology; selection effects could confound the reported cultural contribution.
Authors: The six datasets were selected from those reporting geo-cultural metadata with sufficient sample sizes to support multilevel modeling (minimum of 500 ratings per dataset). Geo-coding mapped respondent countries to Inglehart-Welzel cultural zones using established country-level assignments. We will expand §4 to include the full inclusion/exclusion criteria, the list of all candidate datasets considered, and the exact geo-coding procedure with references to the zone mappings used. revision: yes
-
Referee: [§4.2] §4.2 (Results, 10% culturally sensitive items): The operational definition of 'culturally sensitive' items and any sensitivity analyses to alternative thresholds, zone definitions, or model specifications are not provided. This percentage is used to motivate the practical takeaways and must be shown to be robust.
Authors: Culturally sensitive items were operationalized as those exhibiting statistically significant differences in safety ratings across cultural zones after controlling for age, gender, and ethnicity in the multilevel models (p<0.05 at the item level). We will add this definition to §4.2 along with sensitivity analyses varying the significance threshold, alternative zone groupings, and model specifications to confirm the robustness of the ~10% estimate. revision: yes
Circularity Check
No significant circularity: empirical meta-analysis on external datasets
full rationale
The paper performs a meta-analysis of existing safety datasets using Inglehart-Welzel cultural dimensions and multilevel modeling to test whether cultural zone membership explains additional variance in safety ratings after demographic controls. This is a standard statistical procedure on independent external data sources; the reported p<0.05 findings and 10% culturally sensitive items are outputs of the regression, not inputs redefined as predictions. No self-definitional steps, fitted parameters renamed as predictions, or load-bearing self-citations appear in the provided text. The derivation chain is self-contained against external benchmarks and does not reduce to its own inputs by construction.
Axiom & Free-Parameter Ledger
Reference graph
Works this paper leans on
-
[2]
emnlp-main.912/
URL https://aclanthology.org/2025. emnlp-main.912/. Akaike, H. A new look at the statistical model identification. IEEE Transactions on Automatic Control, 19(6):716–723,
2025
-
[3]
Akaike, A new look at the statistical model identification
doi: 10.1109/TAC.1974.1100705. AlKhamissi, M., Xiao, Y ., AlKhamissi, B., and Diab, M. Hire your anthropologist! rethinking culture bench- marks through an anthropological lens.arXiv preprint arXiv:2510.05931, 2025. Amironesei, R. and Díaz, M. Relationality and offensive speech: A research agenda. InThe 7th Workshop on Online Abuse and Harms (WOAH), pp. 8...
-
[5]
acl-long.782/
URL https://aclanthology.org/2025. acl-long.782/. Chiu, Y . Y ., Jiang, L., Lin, B. Y ., Park, C. Y ., Li, S. S., Ravi, S., Bhatia, M., Antoniak, M., Tsvetkov, Y ., Shwartz, V ., and Choi, Y . CulturalBench: A robust, diverse and challenging benchmark for measuring LMs’ cul- tural knowledge through human-AI red-teaming. In Che, W., Nabende, J., Shutova, E...
2025
-
[6]
Association for Computational Linguistics. ISBN 979-8-89176-251-0. doi: 10.18653/v1/2025.acl-long
-
[7]
acl-long.1247/
URL https://aclanthology.org/2025. acl-long.1247/. Cui, J., Chiang, W.-L., Stoica, I., and Hsieh, C.-J. OR-bench: An over-refusal benchmark for large language models,
2025
-
[8]
Davani, A., Díaz, M., Baker, D., and Prabhakaran, V
URL https://openreview.net/forum? id=obYVdcMMIT. Davani, A., Díaz, M., Baker, D., and Prabhakaran, V . Disen- tangling perceptions of offensiveness: Cultural and moral correlates. InProceedings of the 2024 ACM Conference on Fairness, Accountability, and Transparency, FAccT ’24, pp. 2007–2021, New York, NY , USA, 2024. Associa- tion for Computing Machinery...
-
[9]
Llama Guard: LLM-based Input-Output Safeguard for Human-AI Conversations
Association for Computational Linguistics. doi: 10.18653/v1/2024.emnlp-demo.42. URL https:// aclanthology.org/2024.emnlp-demo.42/. Haerpfer, C., Inglehart, R., Moreno, A., Welzel, C., Kizilova, K., Diez-Medrano, J., Lagos, M., Norris, P., Ponarin, E., Puranen, B., et al. World values survey: Round seven- country-pooled datafile version 5.0, 2022. URL http...
work page internal anchor Pith review Pith/arXiv arXiv doi:10.18653/v1/2024.emnlp-demo.42 2024
-
[10]
New Routes to Phylogeography: A Bayesian Structured Coalescent Approximation
URL https://aclanthology.org/2024. findings-emnlp.887/. 12 Quantifying the Salience of Geo-Cultural Values for Pluralistic Safety Alignment Jiang, J. A., Scheuerman, M. K., Fiesler, C., and Brubaker, J. R. Understanding international percep- tions of the severity of harmful content online.PLOS ONE, 16(8):1–22, 08 2021. doi: 10.1371/journal. pone.0256762. ...
-
[11]
URL https: //aclanthology.org/2025.acl-long.336/
doi: 10.18653/v1/2025.acl-long.336. URL https: //aclanthology.org/2025.acl-long.336/. Jindal, M., Shrawgi, H., Agrawal, P., and Dandapat, S. SAGE: A generic framework for LLM safety evalu- ation. In Potdar, S., Rojas-Barahona, L., and Mon- tella, S. (eds.),Proceedings of the 2025 Conference on Empirical Methods in Natural Language Process- ing: Industry T...
-
[13]
Wang, Y ., Qu, W., Zhai, S., Jiang, Y ., Zichen, L., Liu, Y ., Dong, Y ., and Zhang, J
URL https://aclanthology.org/2025. emnlp-main.2/. Kennedy, R., Clifford, S., Burleigh, T., Waggoner, P. D., Jewell, R., and Winter, N. J. The shape of and solutions to the mturk quality crisis.Political Science Research and Methods, 8(4):614–629, 2020. Kirk, H. R., Whitefield, A., Rottger, P., Bean, A. M., Mar- gatina, K., Mosquera-Gomez, R., Ciro, J., Ba...
-
[14]
Mitigating catastrophic forgetting in large language models with forgetting-aware pruning
URL https://aclanthology.org/2024. naacl-long.236/. Li, J.-J., Mire, J., Fleisig, E., Pyatkin, V ., Collins, A., Sap, M., and Levine, S. Pluriharms: Benchmarking the full spectrum of human judgments on AI harm. InThe Four- teenth International Conference on Learning Represen- tations, 2026. URL https://openreview.net/ forum?id=u7lXflJQX9. Liu, H., Li, Q.,...
-
[15]
URL https://aclanthology.org/2025. emnlp-main.928/. Masoud, R., Liu, Z., Ferianc, M., Treleaven, P. C., and Ro- drigues, M. R. Cultural alignment in large language mod- els: An explanatory analysis based on hofstede’s cultural dimensions. In Rambow, O., Wanner, L., Apidianaki, M., Al-Khalifa, H., Eugenio, B. D., and Schockaert, S. (eds.), Proceedings of t...
-
[16]
emnlp-main.511/
URL https://aclanthology.org/2024. emnlp-main.511/. Mushkani, R., Berard, H., Cohen, A., and Koseki, S. Po- sition: The right to AI. InForty-second International Conference on Machine Learning Position Paper Track,
2024
-
[17]
Nayak, S., Bhatia, M., Zhang, X., Rieser, V ., Hendricks, L
URL https://openreview.net/forum? id=IxCvgUme5S. Nayak, S., Bhatia, M., Zhang, X., Rieser, V ., Hendricks, L. A., Steenkiste, S. V ., Goyal, Y ., Stanczak, K., and Agrawal, A. CulturalFrames: Assessing cultural ex- pectation alignment in text-to-image models and eval- uation metrics. In Christodoulopoulos, C., Chakraborty, T., Rose, C., and Peng, V . (eds...
-
[18]
findings-emnlp.1141/
URL https://aclanthology.org/2025. findings-emnlp.1141/. Nice, M. L. Exploring the relationships and differences of cultural identity salience, life satisfaction, and cultural de- mographics among emerging adults.Adultspan Journal, 23(1):1, 2024. Orlikowski, M., Pei, J., Röttger, P., Cimiano, P., Jur- gens, D., and Hovy, D. Beyond demographics: Fine- tuni...
2025
-
[19]
URL https: //aclanthology.org/2025.acl-long.104/
doi: 10.18653/v1/2025.acl-long.104. URL https: //aclanthology.org/2025.acl-long.104/. Ouyang, L., Wu, J., Jiang, X., Almeida, D., Wainwright, C., Mishkin, P., Zhang, C., Agarwal, S., Slama, K., Ray, A., et al. Training language models to follow instructions with human feedback.Advances in neural information processing systems, 35:27730–27744, 2022. Petrov...
-
[20]
URL https://openreview.net/forum? id=kVaE2kYjtV. Plank, B. The “problem” of human label variation: On ground truth in data, modeling and evaluation. In Gold- berg, Y ., Kozareva, Z., and Zhang, Y . (eds.),Proceedings of the 2022 Conference on Empirical Methods in Natu- ral Language Processing, pp. 10671–10682, Abu Dhabi, United Arab Emirates, December 202...
-
[21]
Going PLACES: Participatory Localized Red Teaming for Text-to-Image Safety in the Global South
URL https://aclanthology.org/2024. naacl-long.190/. Qiu, H., Huang, K.-H., Zheng, R., Sun, J., and Peng, N. Multimodal cultural safety: Evaluation framework and alignment strategies.Transactions on Machine Learning Research, 2025. ISSN 2835-8856. URL https:// openreview.net/forum?id=mkFBmxgnRh. Rastogi, C., Teh, T. H., Mishra, P., Patel, R., Wang, D., Dia...
work page internal anchor Pith review Pith/arXiv arXiv doi:10.1080/00273171.2019 2024
-
[22]
URL https://openreview.net/forum? id=gQpBnRHwxM. Team, G. Gemma 3 technical report, 2025. URL https: //arxiv.org/abs/2503.19786. Thomas, K., Kelley, P. G., Tao, D., Meiklejohn, S., Vallis, O., Tan, S., Brataniˇc, B., Ferreira, F. T., Eranti, V . K., and Bursztein, E. Supporting human raters with the detection of harmful content using large language models...
work page internal anchor Pith review Pith/arXiv arXiv 2025
-
[23]
Journal of Artificial Intelligence Research , author =
IEEE, 2025. Uma, A. N., Fornaciari, T., Hovy, D., Paun, S., Plank, B., and Poesio, M. Learning from disagreement: A survey. J. Artif. Int. Res., 72:1385–1470, January 2022. ISSN 1076-9757. doi: 10.1613/jair.1.12752. URL https: //doi.org/10.1613/jair.1.12752. Varimalla, N. R., Xu, Y ., Saakyan, A., Wang, M. F., and Muresan, S. Videonorms: Benchmarking cult...
discussion (0)
Sign in with ORCID, Apple, or X to comment. Anyone can read and Pith papers without signing in.