pith. sign in

arxiv: 2606.04525 · v3 · pith:EMKRBS7Tnew · submitted 2026-06-03 · 💻 cs.CL · cs.LG· q-bio.GN

GENEB: Why Genomic Models Are Hard to Compare

Pith reviewed 2026-06-28 06:21 UTC · model grok-4.3

classification 💻 cs.CL cs.LGq-bio.GN
keywords genomic foundation modelsbenchmark evaluationmodel comparisonleaderboard instabilityprobing protocoltask categoriesgenomic machine learning
0
0 comments X

The pith

GENEB shows that genomic model rankings vary sharply across task categories and architecture often outweighs scale.

A machine-rendered reading of the paper's core claim, the machinery that carries it, and where it could break.

The paper introduces GENEB to compare 40 genomic foundation models on 100 tasks across 13 categories using one probing protocol on frozen representations in few-shot settings. It establishes that overall leaderboards are unstable because model order changes markedly by task type. Scale yields only modest and inconsistent gains while architectural design and pretraining data alignment matter more than parameter count. This matters because researchers cannot confidently claim one genomic model is generally superior without knowing how performance breaks down by functional category.

Core claim

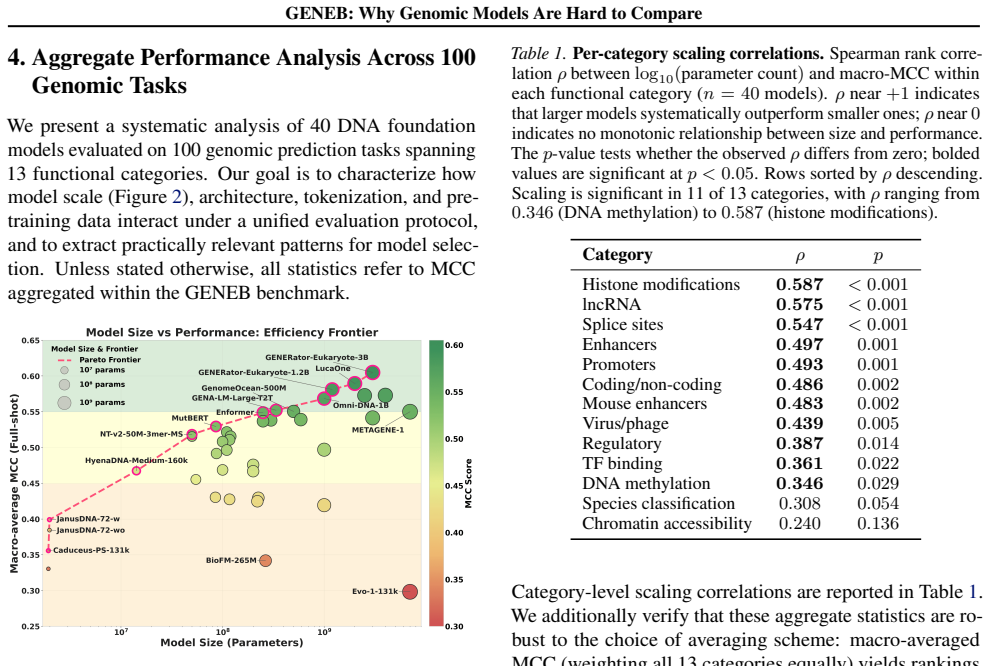
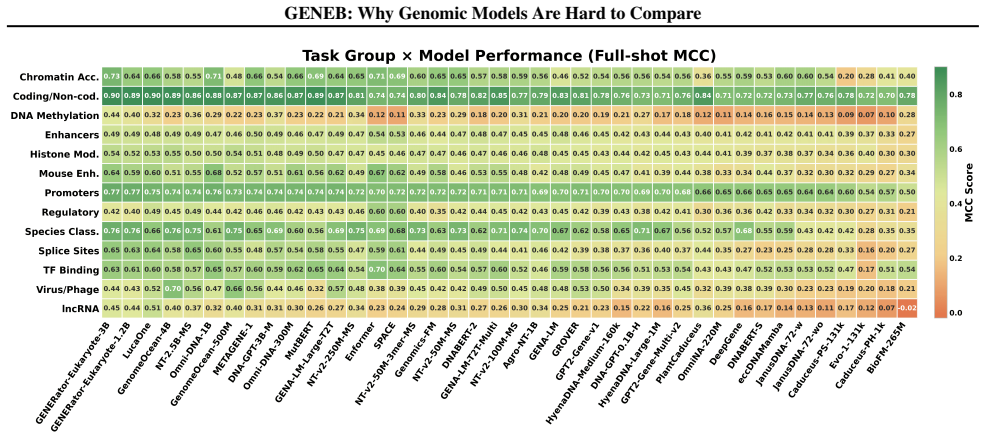
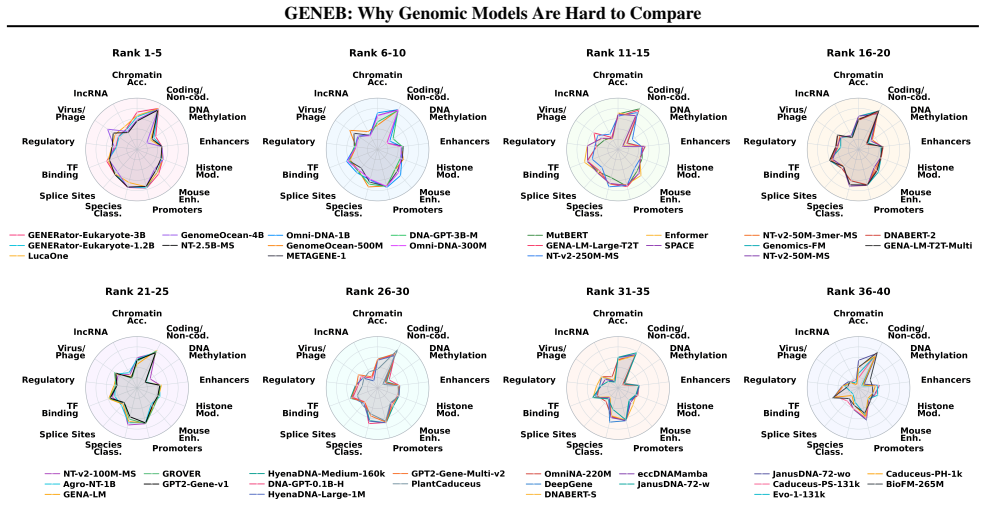
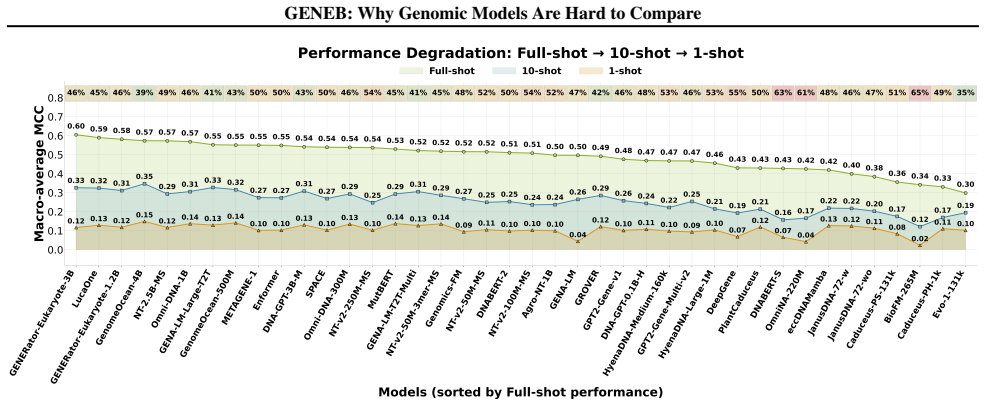
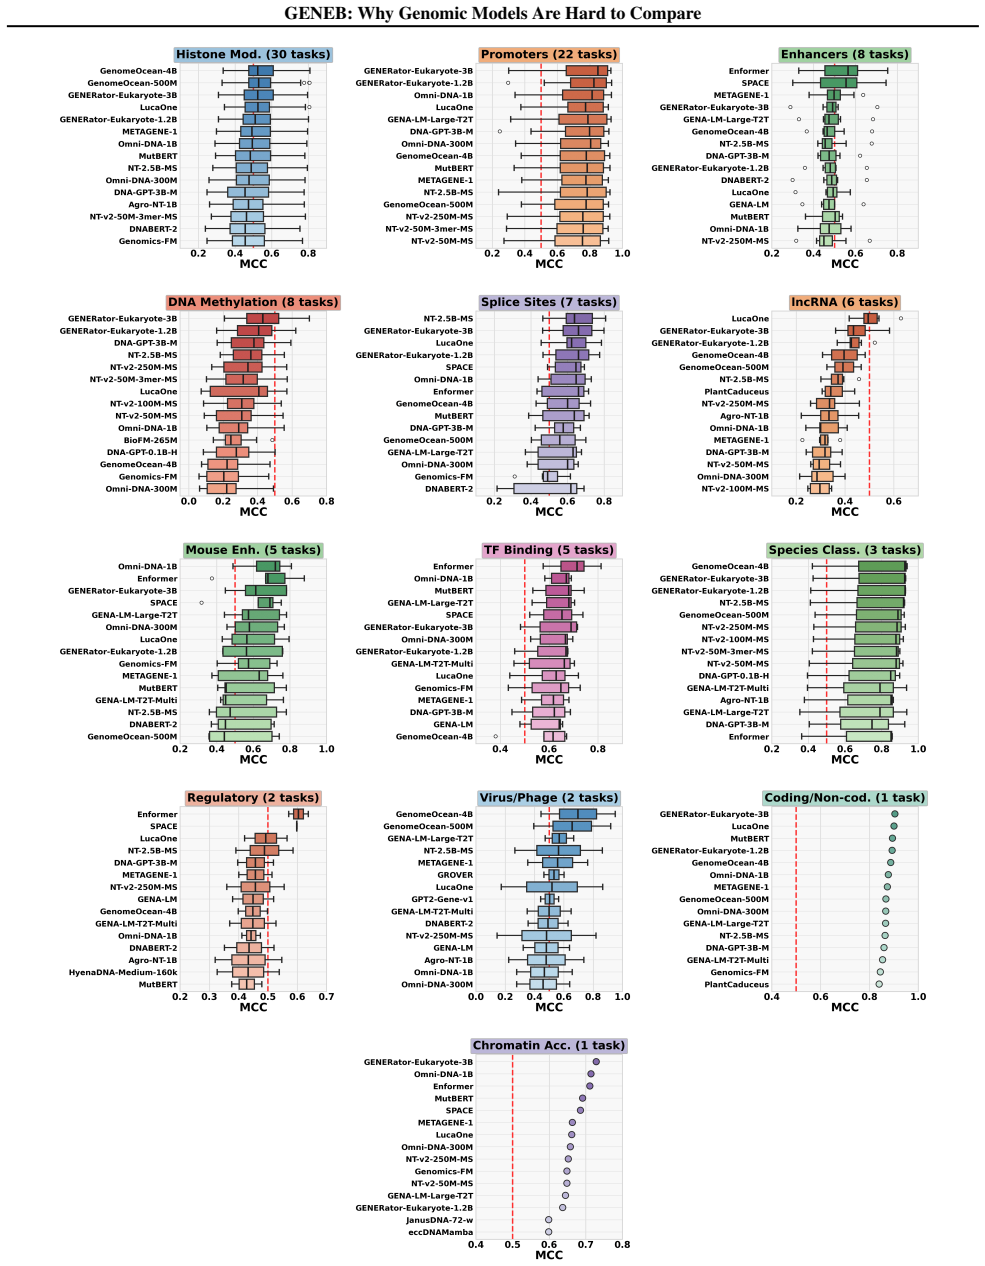
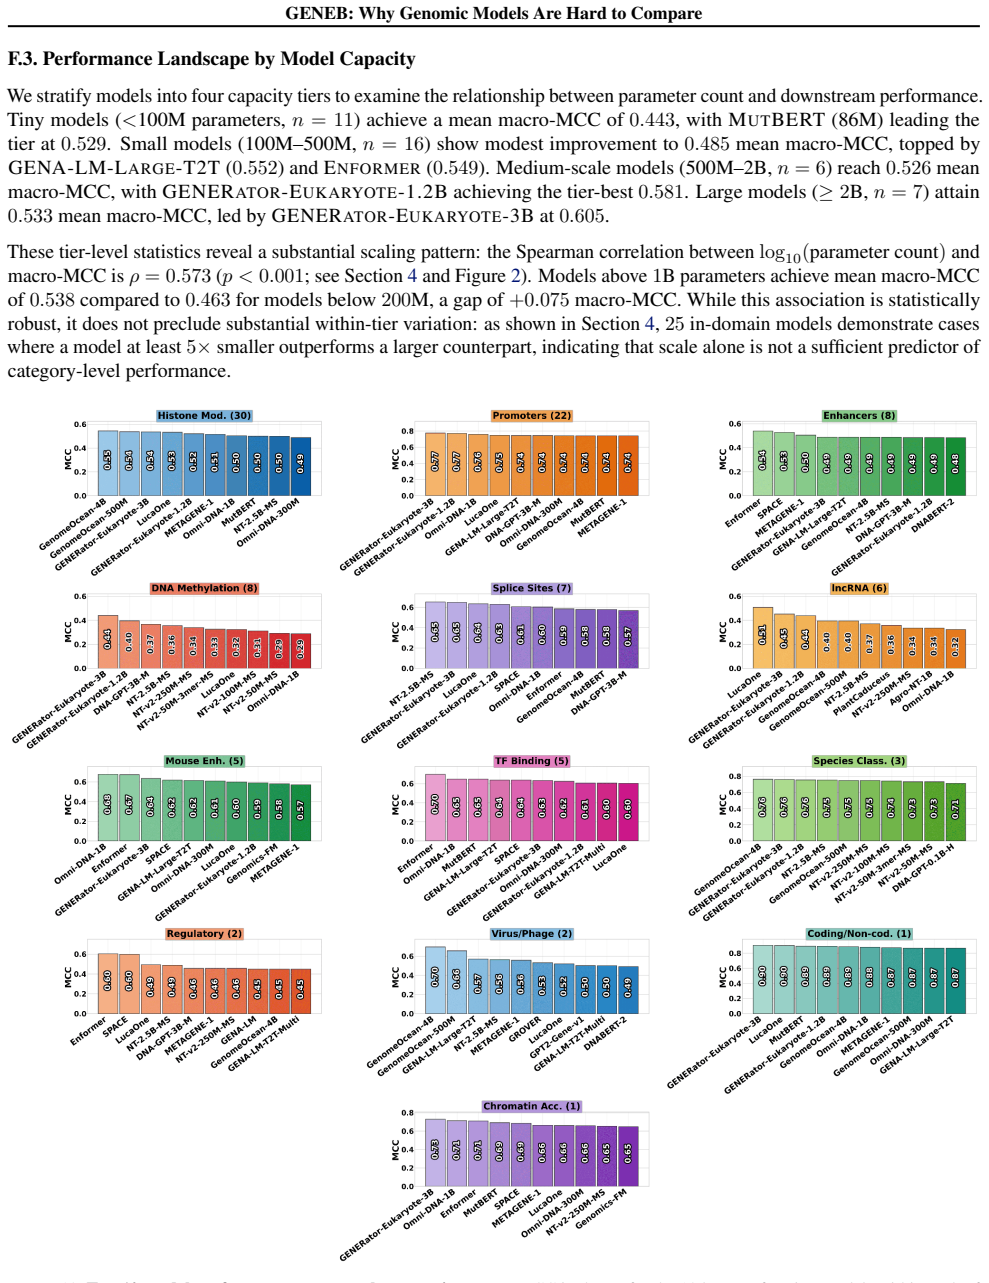
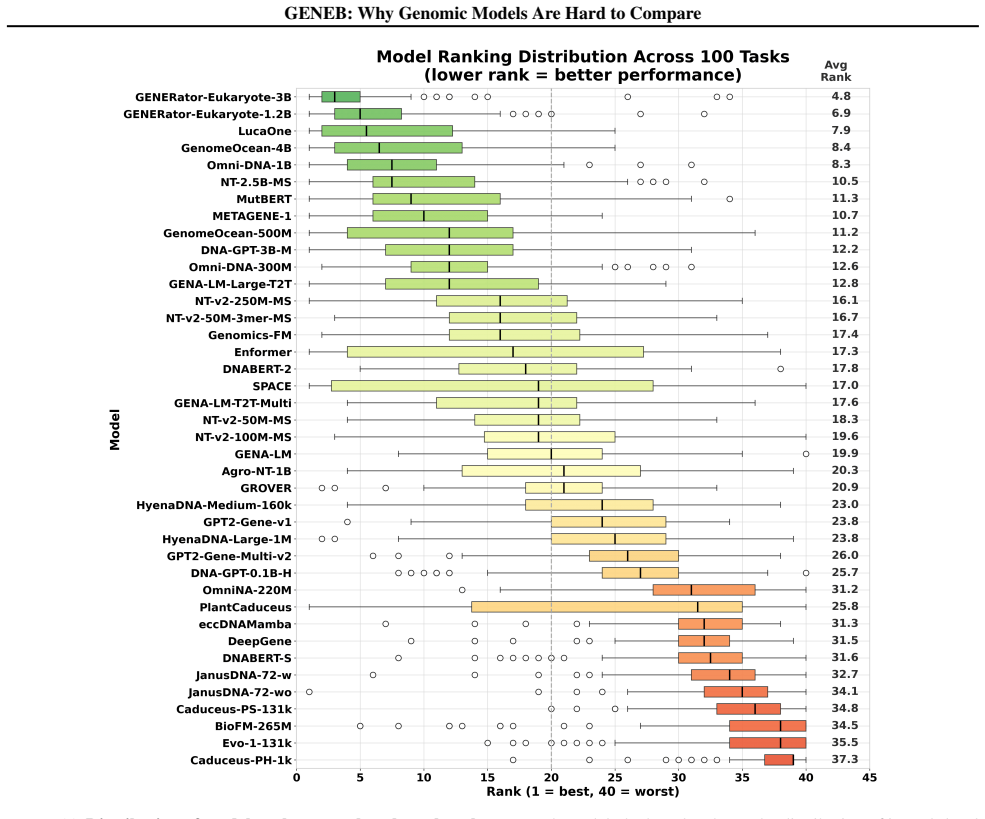
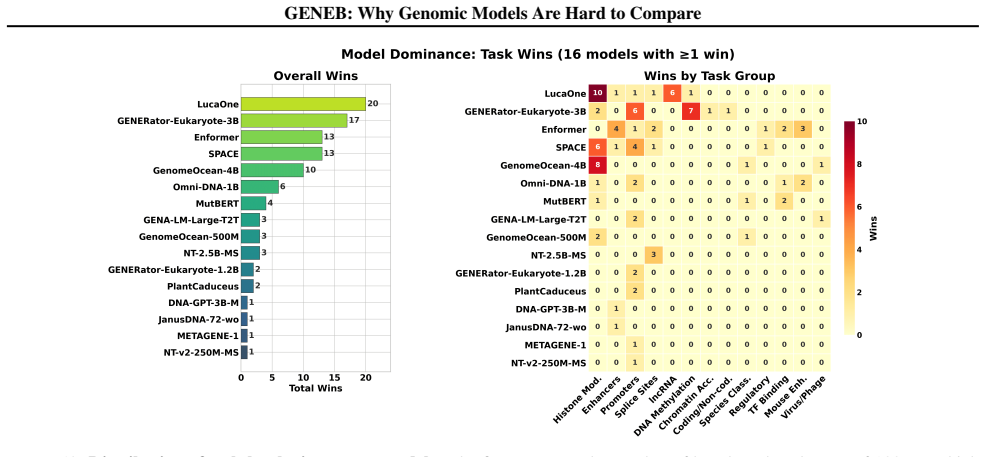
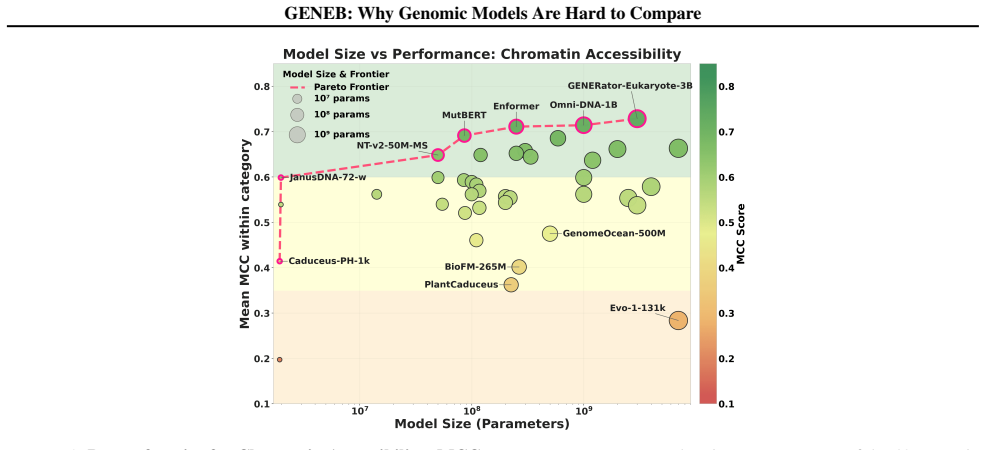
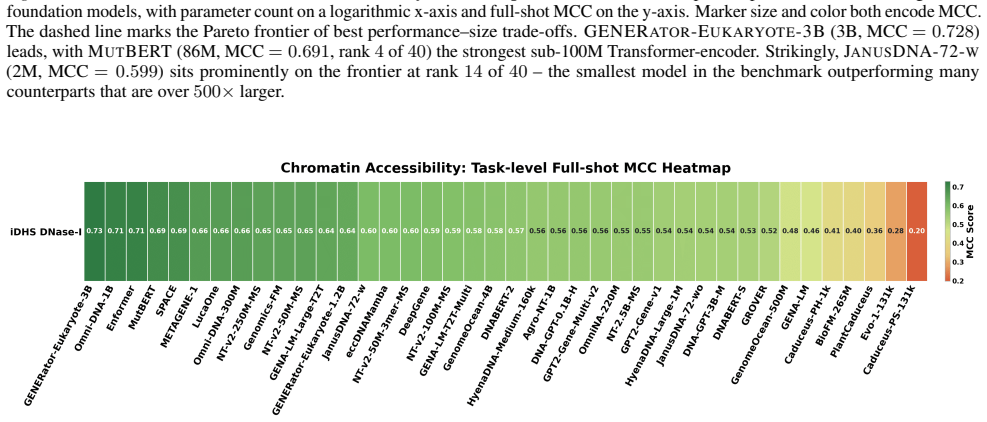
GENEB applies a unified probing-based protocol to frozen representations from 40 genomic foundation models across 100 tasks in 13 functional categories and finds that aggregate leaderboards are unstable, with rankings varying sharply across categories, scale providing only modest and inconsistent gains, and architectural and pretraining alignment frequently outweighing parameter count.

What carries the argument

GENEB, the diagnostic benchmark that runs a single probing protocol on frozen representations across 100 genomic tasks in 13 categories to expose task-level trade-offs.

Load-bearing premise

That one probing protocol on frozen representations across many tasks produces fair comparisons of true model capabilities without task-specific fine-tuning.

What would settle it

Re-running the 40 models with task-specific fine-tuning and finding that scale then dominates or rankings stabilize would undermine the claim that architecture outweighs scale under the frozen protocol.
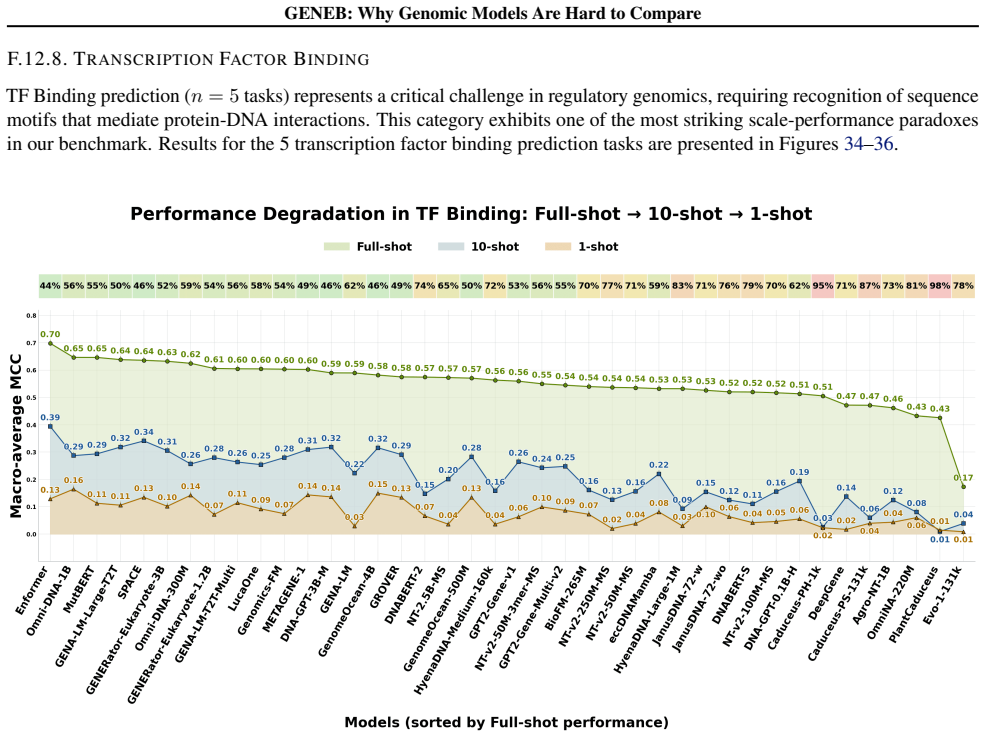
Figures

Figures reproduced from arXiv: 2606.04525 by Daria Ledneva, Denis Kuznetsov, Mikhail Nuridinov.

Figure 1
Figure 1. Figure 1: Fragmented comparison landscape of genomic foun￾dation models. Each node represents a published model; directed edges denote models explicitly used as baselines or comparators in the corresponding paper. The sparse, disconnected graph reflects the absence of unified cross-model evaluation in genomic machine learning. This fragmentation makes even basic questions difficult to answer. Principled comparison b… view at source ↗
Figure 2
Figure 2. Figure 2: Pareto frontier of model efficiency: macro-MCC vs. parameter count. Each point represents one of the 40 genomic foundation models, with parameter count on a logarithmic x-axis and full-shot macro-average MCC on the y-axis. Marker size and color both encode macro-MCC. The dashed line marks the Pareto frontier of best performance–size trade-offs. Spearman correlation between log(params) and macro-MCC is ρ = … view at source ↗
Figure 3
Figure 3. Figure 3: Model performance across task groups. Heatmap shows full-shot MCC averaged within each task group for 40 genomic foundation models, sorted by overall full-shot macro-average MCC. Cell values report category-level mean MCC, with colors ranging from red/orange for lower scores to green for higher scores. The results reveal substantial task-level heterogeneity: some categories, such as promoter, coding/non-co… view at source ↗
Figure 4
Figure 4. Figure 4: Radar plots for category-aware model selection. Each subplot shows full-shot macro-MCC across the 13 GENEB task categories for a group of five models, grouped by overall macro-MCC rank from strongest to weakest. The plots expose category-specific strengths not captured by aggregate rankings: ENFORMER has a moderate overall rank but leads on TF binding (0.698), enhancers (0.539), and regulatory tasks (0.604… view at source ↗
Figure 5
Figure 5. Figure 5: Few-shot performance degradation. Macro-average MCC of genomic foundation models under full-data, 10-shot, and 1-shot evaluation regimes. Models are sorted by full-data performance. The top band reports the relative performance drop from full-data to 10-shot evaluation, highlighting the sensitivity of each model to limited supervision [PITH_FULL_IMAGE:figures/full_fig_p006_5.png] view at source ↗
Figure 6
Figure 6. Figure 6: High-variance tasks reveal the role of pretraining data. (A) GENEB tasks with cross-model standard deviation above 0.12, corresponding to settings where model selection most strongly affects downstream performance. (B) Pretraining-data composition of top-3 and bottom-3 placements across these tasks. Multi-species and eukaryotic-gene pretraining dominate top place￾ments, while human-only, prokaryotic, and m… view at source ↗
Figure 7
Figure 7. Figure 7: Architectural taxonomy of genomic foundation models. Transformer-Based Encoder Models. Early DNA language models predominantly adopted BERT-style encoder archi￾tectures with masked language modeling (MLM) objectives. DNABERT-2 (Zhou et al., 2024a) addressed computational inefficiencies of k-mer tokenization by replacing it with Byte-Pair Encoding (BPE), achieving comparable performance with 21× fewer param… view at source ↗
Figure 8
Figure 8. Figure 8: Robustness of GENEB aggregate rankings to averaging scheme. For each of the 40 models, ∆ = MCCmacro − MCCmicro is shown in the left panel; the side panel reports the underlying micro- and macro-averaged MCC values. Models are sorted from largest negative shift to largest positive shift. Out-of-domain models are highlighted: prokaryotic-only EVO-1-131K (red, ∆ = −0.044), microbial-only DNABERT-S (orange, ∆ … view at source ↗
Figure 9
Figure 9. Figure 9: Category-wise MCC distributions across top-performing models. For each functional category, the figure reports the top-15 models ranked by mean MCC. Boxplots show the distribution of per-task MCC values within the category: boxes denote the interquartile range, central lines indicate medians, whiskers show the non-outlier range, and points mark outlier tasks. For single-task categories, individual MCC valu… view at source ↗
Figure 10
Figure 10. Figure 10: Top-10 model performance across task categories. Mean MCC is shown for the 10 best-performing models within each of the 13 functional task categories. Models are ranked independently within each category by category-level mean MCC, highlighting task-specific leaders and performance differences across genomic prediction settings. 31 [PITH_FULL_IMAGE:figures/full_fig_p031_10.png] view at source ↗
Figure 11
Figure 11. Figure 11: Distribution of model ranks across benchmark tasks. For each model, the boxplot shows the distribution of its task-level ranks across 100 benchmark tasks, where lower rank indicates better performance. Models are ordered by median rank, and the right column reports the average rank across all tasks. The leading models combine low median rank with relatively compact rank distributions, indicating consisten… view at source ↗
Figure 12
Figure 12. Figure 12: Distribution of task-level wins across models. The figure reports the number of benchmark tasks, out of 100, on which each model achieves the highest MCC. Only models with at least one task-level win are included. The left panel summarizes total wins per model, while the right panel decomposes these wins by functional task category. The dispersed pattern of wins across models and categories indicates that… view at source ↗
Figure 13
Figure 13. Figure 13: Few-shot performance degradation on Histone Modifications. For each of the 40 models, macro-average MCC across 30 histone modification tasks under full-shot, 10-shot, and 1-shot regimes; models ordered by full-shot performance. The top band shows the relative drop from full-shot to 10-shot per model. Benchmark-wide mean degradation: 51.0% for 10-shot, 80.3% for 1-shot. The 1-shot regime collapses to near-… view at source ↗
Figure 14
Figure 14. Figure 14: Pareto frontier for Histone Modifications: mean MCC vs. parameter count. Each point represents one of the 40 genomic foundation models, with parameter count on a logarithmic x-axis and mean full-shot Histone Modifications MCC on the y-axis. Marker size and color both encode MCC. The dashed line marks the Pareto frontier of best performance–size trade-offs. Scale shows a positive but non-deterministic asso… view at source ↗
Figure 15
Figure 15. Figure 15: Per-task MCC for Histone Modifications. Heatmap shows full-shot MCC for each of the 40 genomic foundation models on the 30 histone modification tasks, with models sorted by mean Histone Modifications MCC. Cell values report per-task MCC, with colors ranging from red/orange for lower scores to green for higher scores. Task difficulty varies substantially across marks: H4-family tasks (H4, H4ac, H4K20me1) a… view at source ↗
Figure 16
Figure 16. Figure 16: Few-shot performance degradation on Promoter Recognition. For each of the 40 models, macro-average MCC across 22 promoter prediction tasks under full-shot, 10-shot, and 1-shot regimes; models ordered by full-shot performance. The top band shows the relative drop from full-shot to 10-shot per model. Benchmark-wide mean degradation: 30.7% for 10-shot, 61.2% for 1-shot. Unlike histone modifications, the 1-sh… view at source ↗
Figure 17
Figure 17. Figure 17: Pareto frontier for Promoter Recognition: mean MCC vs. parameter count. Each point represents one of the 40 genomic foundation models, with parameter count on a logarithmic x-axis and mean full-shot Promoter MCC on the y-axis. Marker size and color both encode MCC. The dashed line marks the Pareto frontier of best performance–size trade-offs. Scaling is comparatively weak on this category (Spearman ρ = 0.… view at source ↗
Figure 18
Figure 18. Figure 18: Per-task MCC for Promoter Recognition. Heatmap shows full-shot MCC for each of the 40 genomic foundation models on the 22 promoter prediction tasks, with models sorted by mean Promoter MCC. Cell values report per-task MCC, with colors ranging from red/orange for lower scores to green for higher scores. Task difficulty varies substantially with sequence source and host species: cell-type-specific human pro… view at source ↗
Figure 19
Figure 19. Figure 19: Few-shot performance degradation on Enhancer Prediction. For each of the 40 models, macro-average MCC across 8 enhancer prediction tasks under full-shot, 10-shot, and 1-shot regimes; models ordered by full-shot performance. The top band shows the relative drop from full-shot to 10-shot per model. Benchmark-wide mean degradation: 37.6% for 10-shot, 70.0% for 1-shot. The 1-shot regime collapses to near-rand… view at source ↗
Figure 20
Figure 20. Figure 20: Pareto frontier for Enhancer Prediction: mean MCC vs. parameter count. Each point represents one of the 40 genomic foundation models, with parameter count on a logarithmic x-axis and mean full-shot Enhancer MCC on the y-axis. Marker size and color both encode MCC. The dashed line marks the Pareto frontier of best performance–size trade-offs. Scaling on this category is moderate (Spearman ρ = 0.497; tier g… view at source ↗
Figure 21
Figure 21. Figure 21: Per-task MCC for Enhancer Prediction. Heatmap shows full-shot MCC for each of the 40 genomic foundation models on the 8 enhancer prediction tasks, with models sorted by mean Enhancer MCC. Cell values report per-task MCC, with colors ranging from red/orange for lower scores to green for higher scores. Task difficulty varies substantially: the multi-class NT Enhancers (types) task is the most challenging (m… view at source ↗
Figure 22
Figure 22. Figure 22: Few-shot performance degradation on DNA Methylation. For each of the 40 models, macro-average MCC across 8 DNA methylation tasks under full-shot, 10-shot, and 1-shot regimes; models ordered by full-shot performance. The top band shows the relative drop from full-shot to 10-shot per model. Benchmark-wide mean degradation: 74.7% for 10-shot, 93.2% for 1-shot – among the most severe of any task category. Bot… view at source ↗
Figure 23
Figure 23. Figure 23: Pareto frontier for DNA Methylation: mean MCC vs. parameter count. Each point represents one of the 40 genomic foundation models, with parameter count on a logarithmic x-axis and mean full-shot DNA Methylation MCC on the y-axis. Marker size and color both encode MCC. The dashed line marks the Pareto frontier of best performance–size trade-offs. NT-V2-50M-3MER-MS (50M, mean MCC = 0.326) is the strongest su… view at source ↗
Figure 24
Figure 24. Figure 24: Per-task MCC for DNA Methylation. Heatmap shows full-shot MCC for each of the 40 genomic foundation models on the 8 DNA methylation tasks (six 4mC, one 5mC, one 6mA), with models sorted by mean DNA Methylation MCC. Cell values report per-task MCC, with colors ranging from red/orange for lower scores to green for higher scores. Model specialization is particularly striking. BIOFM-265M achieves rank 10.4 on… view at source ↗
Figure 25
Figure 25. Figure 25: Few-shot performance degradation on Splice Site Detection. For each of the 40 models, macro-average MCC across 7 splice site tasks under full-shot, 10-shot, and 1-shot regimes; models ordered by full-shot performance. The top band shows the relative drop from full-shot to 10-shot per model. Benchmark-wide mean degradation: 67.6% for 10-shot, 86.4% for 1-shot. The 10-shot regime retains discriminative sign… view at source ↗
Figure 26
Figure 26. Figure 26: Pareto frontier for Splice Site Detection: mean MCC vs. parameter count. Each point represents one of the 40 genomic foundation models, with parameter count on a logarithmic x-axis and mean full-shot Splice Sites MCC on the y-axis. Marker size and color both encode MCC. The dashed line marks the Pareto frontier of best performance–size trade-offs. Scaling on this category is strong (Spearman ρ = 0.547, p … view at source ↗
Figure 27
Figure 27. Figure 27: Per-task MCC for Splice Site Detection. Heatmap shows full-shot MCC for each of the 40 genomic foundation models on the 7 splice site tasks, with models sorted by mean Splice Sites MCC. Cell values report per-task MCC, with colors ranging from red/orange for lower scores to green for higher scores. Donor and acceptor classification tasks (NT and NT-revised sources) are consistently easier than the joint s… view at source ↗
Figure 28
Figure 28. Figure 28: Few-shot performance degradation on lncRNA Classification. For each of the 40 models, macro-average MCC across 6 plant lncRNA tasks under full-shot, 10-shot, and 1-shot regimes; models ordered by full-shot performance. The top band shows the relative drop from full-shot to 10-shot per model. Benchmark-wide mean degradation: 79.8% for 10-shot, 91.3% for 1-shot. Both regimes collapse to near-random performa… view at source ↗
Figure 29
Figure 29. Figure 29: Pareto frontier for lncRNA Classification: mean MCC vs. parameter count. Each point represents one of the 40 genomic foundation models, with parameter count on a logarithmic x-axis and mean full-shot lncRNA MCC on the y-axis. Marker size and color both encode MCC. The dashed line marks the Pareto frontier of best performance–size trade-offs. Scaling on this category is moderate (Spearman ρ = 0.575, p < 0.… view at source ↗
Figure 30
Figure 30. Figure 30: Per-task MCC for lncRNA Classification. Heatmap shows full-shot MCC for each of the 40 genomic foundation models on the 6 plant lncRNA classification tasks, with models sorted by mean lncRNA MCC. Cell values report per-task MCC, with colors ranging from red/orange for lower scores to green for higher scores. Multi-species (LUCAONE) and eukaryotic gene-focused (GENERATOR) models dominate the top of the ord… view at source ↗
Figure 31
Figure 31. Figure 31: Few-shot performance degradation on Mouse Enhancer Prediction. For each of the 40 models, macro-average MCC across 5 mouse enhancer tasks under full-shot, 10-shot, and 1-shot regimes; models ordered by full-shot performance. The top band shows the relative drop from full-shot to 10-shot per model. Benchmark-wide mean degradation: 67.4% for 10-shot, 89.2% for 1-shot. Unlike on the (human-centric) Enhancers… view at source ↗
Figure 32
Figure 32. Figure 32: Pareto frontier for Mouse Enhancer Prediction: mean MCC vs. parameter count. Each point represents one of the 40 genomic foundation models, with parameter count on a logarithmic x-axis and mean full-shot Mouse Enhancer MCC on the y-axis. Marker size and color both encode MCC. The dashed line marks the Pareto frontier of best performance–size trade-offs. Scaling on this category is moderate (Spearman ρ = 0… view at source ↗
Figure 33
Figure 33. Figure 33: Per-task MCC for Mouse Enhancer Prediction. Heatmap shows full-shot MCC for each of the 40 genomic foundation models on the 5 mouse enhancer tasks (GUE mouse 0 through 4), with models sorted by mean Mouse Enhancer MCC. Cell values report per-task MCC, with colors ranging from red/orange for lower scores to green for higher scores. Tasks 1 and 2 are uniformly easier across models (mean MCC > 0.65) than tas… view at source ↗
Figure 34
Figure 34. Figure 34: Few-shot performance degradation on TF Binding. For each of the 40 models, macro-average MCC across 5 TF binding tasks under full-shot, 10-shot, and 1-shot regimes; models ordered by full-shot performance. The top band shows the relative drop from full-shot to 10-shot per model. Benchmark-wide mean degradation: 62.6% for 10-shot, 85.9% for 1-shot. The 10-shot regime retains discriminative signal (maximum … view at source ↗
Figure 35
Figure 35. Figure 35: Pareto frontier for TF Binding: mean MCC vs. parameter count. Each point represents one of the 40 genomic foundation models, with parameter count on a logarithmic x-axis and mean full-shot TF Binding MCC on the y-axis. Marker size and color both encode MCC. The dashed line marks the Pareto frontier of best performance–size trade-offs. Scaling on this category is modest (Spearman ρ = 0.361, p = 0.022; ρ = … view at source ↗
Figure 36
Figure 36. Figure 36: Per-task MCC for TF Binding. Heatmap shows full-shot MCC for each of the 40 genomic foundation models on the 5 TF binding tasks (GUE human TF 0 through 4), with models sorted by mean TF Binding MCC. Cell values report per-task MCC, with colors ranging from red/orange for lower scores to green for higher scores. Task difficulty varies from GUE TF-3 (mean MCC = 0.385, hardest) to GUE TF-1 (mean MCC = 0.652,… view at source ↗
Figure 37
Figure 37. Figure 37: Few-shot performance degradation on Species Classification. For each of the 40 models, macro-average MCC across 3 species classification tasks under full-shot, 10-shot, and 1-shot regimes; models ordered by full-shot performance. The top band shows the relative drop from full-shot to 10-shot per model. Benchmark-wide mean degradation: 33.0% for 10-shot, 69.9% for 1-shot – among the mildest few-shot degrad… view at source ↗
Figure 38
Figure 38. Figure 38: Pareto frontier for Species Classification: mean MCC vs. parameter count. Each point represents one of the 40 genomic foundation models, with parameter count on a logarithmic x-axis and mean full-shot Species Classification MCC on the y-axis. Marker size and color both encode MCC. The dashed line marks the Pareto frontier of best performance–size trade-offs. Scaling on this category is among the weakest i… view at source ↗
Figure 39
Figure 39. Figure 39: Per-task MCC for Species Classification. Heatmap shows full-shot MCC for each of the 40 genomic foundation models on the 3 species classification tasks, with models sorted by mean Species Classification MCC. Cell values report per-task MCC, with colors ranging from red/orange for lower scores to green for higher scores. The cross-kingdom GB Human-or-worm task is uniformly easy across models (mean MCC = 0.… view at source ↗
Figure 40
Figure 40. Figure 40: Few-shot performance degradation on Regulatory Element Prediction. For each of the 40 models, macro-average MCC across 2 regulatory element tasks under full-shot, 10-shot, and 1-shot regimes; models ordered by full-shot performance. The top band shows the relative drop from full-shot to 10-shot per model. Benchmark-wide mean degradation: 62.1% for 10-shot, 81.9% for 1-shot. The 10-shot ranking differs mod… view at source ↗
Figure 41
Figure 41. Figure 41: Pareto frontier for Regulatory Element Prediction: mean MCC vs. parameter count. Each point represents one of the 40 genomic foundation models, with parameter count on a logarithmic x-axis and mean full-shot Regulatory MCC on the y-axis. Marker size and color both encode MCC. The dashed line marks the Pareto frontier of best performance–size trade-offs. Scaling on this category is modest (Spearman ρ = 0.3… view at source ↗
Figure 42
Figure 42. Figure 42: Per-task MCC for Regulatory Element Prediction. Heatmap shows full-shot MCC for each of the 40 genomic foundation models on the 2 regulatory element tasks, with models sorted by mean Regulatory MCC. Cell values report per-task MCC, with colors ranging from red/orange for lower scores to green for higher scores. The GB Ensembl regulatory task is easier (mean MCC = 0.471) than GB OCR Ensembl (mean MCC = 0.3… view at source ↗
Figure 43
Figure 43. Figure 43: Few-shot performance degradation on Virus/Phage Detection. For each of the 40 models, macro-average MCC across 2 virus/phage tasks under full-shot, 10-shot, and 1-shot regimes; models ordered by full-shot performance. The top band shows the relative drop from full-shot to 10-shot per model. Benchmark-wide mean degradation: 71.3% for 10-shot, 93.5% for 1-shot – the largest 1-shot degradation of any task ca… view at source ↗
Figure 44
Figure 44. Figure 44: Pareto frontier for Virus/Phage Detection: mean MCC vs. parameter count. Each point represents one of the 40 genomic foundation models, with parameter count on a logarithmic x-axis and mean full-shot Virus/Phage MCC on the y-axis. Marker size and color both encode MCC. The dashed line marks the Pareto frontier of best performance–size trade-offs. The GENOMEOCEAN multi-species decoders dominate the frontie… view at source ↗
Figure 45
Figure 45. Figure 45: Per-task MCC for Virus/Phage Detection. Heatmap shows full-shot MCC for each of the 40 genomic foundation models on the 2 virus/phage tasks, with models sorted by mean Virus/Phage MCC. Cell values report per-task MCC, with colors ranging from red/orange for lower scores to green for higher scores. GUE Phage fragments (mean MCC = 0.633) is substantially easier than GUE COVID variants (0.200). Multi-species… view at source ↗
Figure 46
Figure 46. Figure 46: Few-shot performance degradation on Coding/Non-coding Classification. For each of the 40 models, MCC on the coding vs. non-coding task under full-shot, 10-shot, and 1-shot regimes; models ordered by full-shot performance. The top band shows the relative drop from full-shot to 10-shot per model. Benchmark-wide mean degradation: 26.6% for 10-shot, 71.7% for 1-shot – among the mildest 10-shot degradation obs… view at source ↗
Figure 47
Figure 47. Figure 47: Pareto frontier for Coding/Non-coding Classification: MCC vs. parameter count. Each point represents one of the 40 genomic foundation models, with parameter count on a logarithmic x-axis and full-shot MCC on the y-axis. Marker size and color both encode MCC. The dashed line marks the Pareto frontier of best performance–size trade-offs. Eukaryotic gene-focused GENERATOR￾EUKARYOTE-3B (3B, MCC = 0.904) leads… view at source ↗
Figure 48
Figure 48. Figure 48: Per-model MCC for Coding/Non-coding Classification. Heatmap shows full-shot MCC for each of the 40 genomic foundation models on the single coding vs. non-coding task, with models sorted by MCC. Cell values report per-model MCC, with colors ranging from red/orange for lower scores to green for higher scores. Multi-species decoder models (GENERATOR-EUKARYOTE-3B, LUCAONE), Transformer-encoder models (MUTBERT… view at source ↗
Figure 49
Figure 49. Figure 49: Few-shot performance degradation on Chromatin Accessibility. For each of the 40 models, MCC on the iDHS DNase-I task under full-shot, 10-shot, and 1-shot regimes; models ordered by full-shot performance. The top band shows the relative drop from full-shot to 10-shot per model. Benchmark-wide mean degradation: 26.8% for 10-shot, 73.6% for 1-shot – among the mildest 10-shot degradation observed across task … view at source ↗
Figure 50
Figure 50. Figure 50: Pareto frontier for Chromatin Accessibility: MCC vs. parameter count. Each point represents one of the 40 genomic foundation models, with parameter count on a logarithmic x-axis and full-shot MCC on the y-axis. Marker size and color both encode MCC. The dashed line marks the Pareto frontier of best performance–size trade-offs. GENERATOR-EUKARYOTE-3B (3B, MCC = 0.728) leads, with MUTBERT (86M, MCC = 0.691,… view at source ↗
Figure 51
Figure 51. Figure 51: Per-model MCC for Chromatin Accessibility. Heatmap shows full-shot MCC for each of the 40 genomic foundation models on the single iDHS DNase-I task, with models sorted by MCC. Cell values report per-model MCC, with colors ranging from red/orange for lower scores to green for higher scores. Eukaryotic gene-focused (GENERATOR-EUKARYOTE-3B), multi-species decoders (OMNI-DNA-1B), and human-mouse epigenomic-pr… view at source ↗
read the original abstract

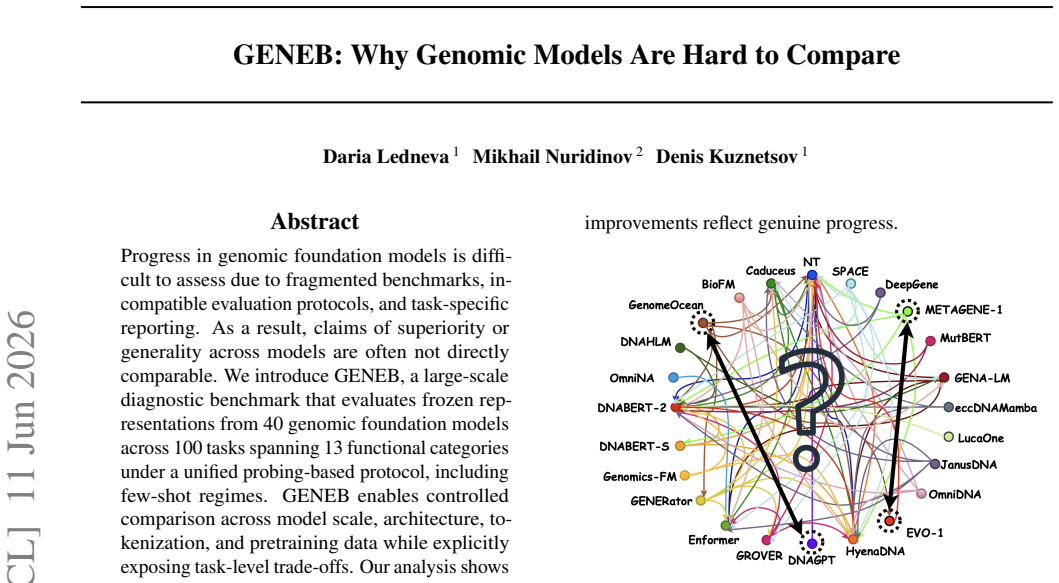
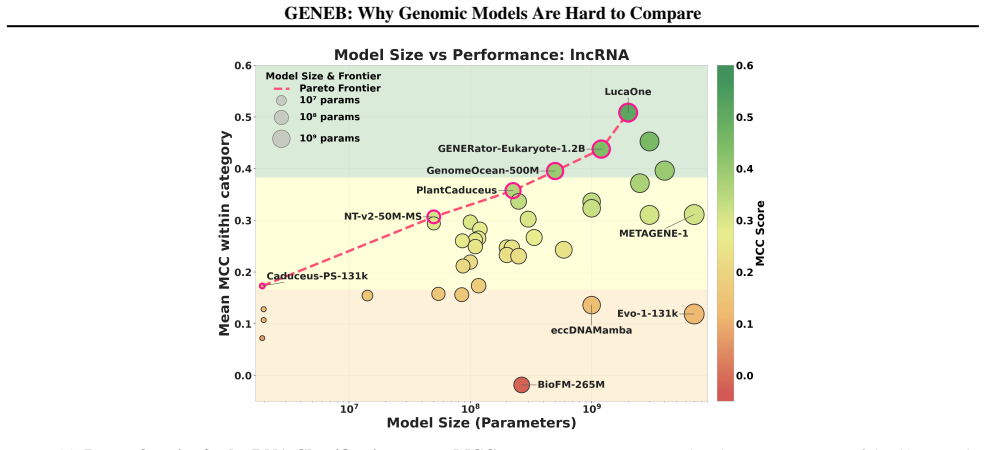
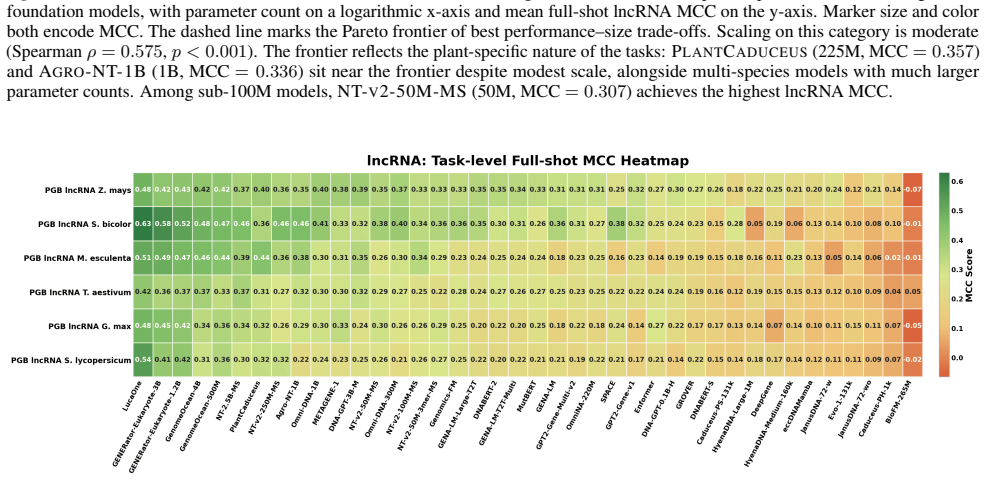
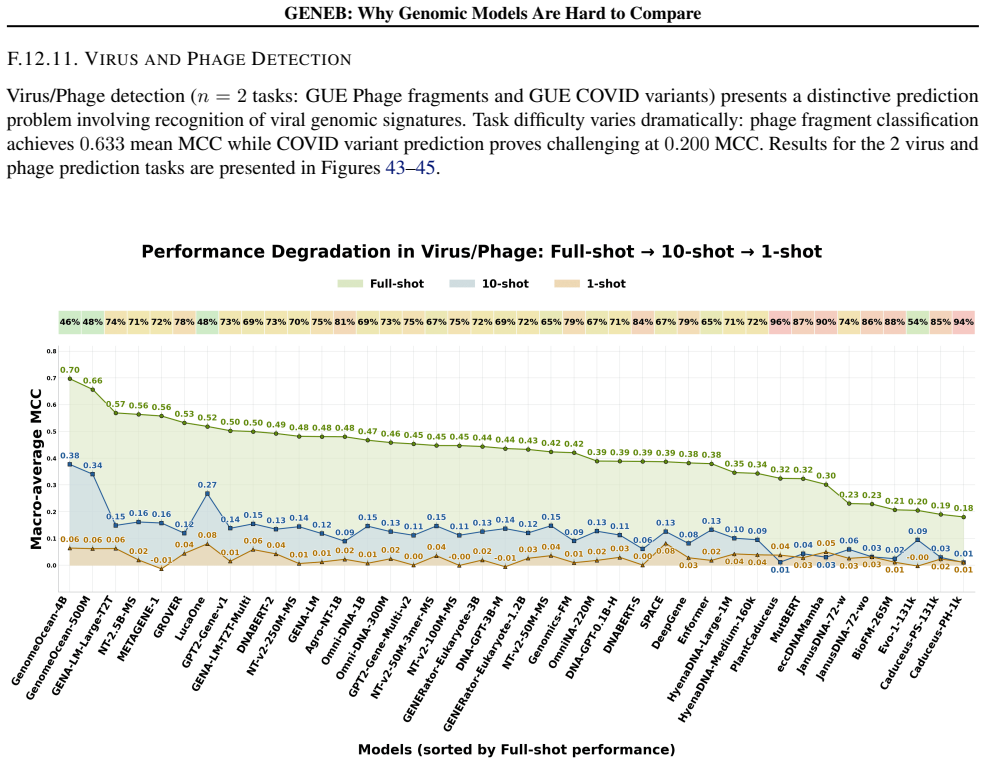
Progress in genomic foundation models is difficult to assess due to fragmented benchmarks, incompatible evaluation protocols, and task-specific reporting. As a result, claims of superiority or generality across models are often not directly comparable. We introduce GENEB, a large-scale diagnostic benchmark that evaluates frozen representations from 40 genomic foundation models across 100 tasks spanning 13 functional categories under a unified probing-based protocol, including few-shot regimes. GENEB enables controlled comparison across model scale, architecture, tokenization, and pretraining data while explicitly exposing task-level trade-offs. Our analysis shows that aggregate leaderboards are unstable: model rankings vary sharply across task categories, scale provides only modest and inconsistent gains, and architectural and pretraining alignment frequently outweigh parameter count. These results highlight limitations of current evaluation practices and position GENEB as a reference framework for principled comparison and category-aware model selection in genomic machine learning.

Editorial analysis

A structured set of objections, weighed in public.

Desk editor's note, referee report, simulated authors' rebuttal, and a circularity audit. Tearing a paper down is the easy half of reading it; the pith above is the substance, this is the friction.

Referee Report

2 major / 2 minor

Summary. The paper introduces GENEB, a diagnostic benchmark that applies a unified probing protocol to frozen representations from 40 genomic foundation models across 100 tasks in 13 functional categories (including few-shot settings). It claims that aggregate leaderboards are unstable because model rankings vary sharply across task categories, that scale yields only modest and inconsistent gains, and that architectural and pretraining alignment frequently outweigh parameter count.

Significance. If the empirical findings are robust, the work provides concrete evidence of the limitations of current fragmented evaluation practices in genomic ML and supplies a controlled reference framework that could support category-aware model selection and more reliable comparisons.

major comments (2)
  1. [Evaluation protocol (unified probing description)] The central claims (leaderboard instability, modest scale effects, and architecture/pretraining dominance) rest entirely on orderings produced by one fixed probing protocol applied to frozen representations. No ablation or sensitivity analysis is reported for alternative probes (linear vs. MLP, regularization strength, pooling method), so it remains possible that the observed instabilities and trade-offs are artifacts of that specific protocol rather than intrinsic model properties.
  2. [Results and analysis sections] The manuscript does not report variance estimates, statistical significance tests, or confidence intervals on the ranking variations across the 13 categories or on the scale-gain inconsistencies; without these, it is difficult to determine whether the reported instabilities are load-bearing or could arise from task sampling or probe variance.
minor comments (2)
  1. Provide an explicit list or table of all 40 models, their scales, architectures, tokenizers, and pretraining corpora to enable direct replication of the controlled comparisons.
  2. Clarify the precise definition and implementation of the 'few-shot regimes' (number of shots, sampling strategy, and how they differ from the main probing setup).

Simulated Author's Rebuttal

2 responses · 0 unresolved

We thank the referee for the detailed and constructive comments. The feedback highlights important aspects of robustness that we will address in revision. We respond point-by-point to the major comments below.

read point-by-point responses
  1. Referee: The central claims (leaderboard instability, modest scale effects, and architecture/pretraining dominance) rest entirely on orderings produced by one fixed probing protocol applied to frozen representations. No ablation or sensitivity analysis is reported for alternative probes (linear vs. MLP, regularization strength, pooling method), so it remains possible that the observed instabilities and trade-offs are artifacts of that specific protocol rather than intrinsic model properties.

    Authors: The unified fixed probing protocol was deliberately chosen to isolate model-intrinsic differences (architecture, scale, pretraining alignment) by removing confounding variation from the evaluation method itself; varying the probe would undermine the controlled comparison that GENEB is designed to provide. We acknowledge that probe sensitivity is a valid concern for generalizability. In the revised manuscript we will add a targeted sensitivity analysis on a representative subset of tasks and models, comparing linear vs. MLP probes and alternative pooling/regularization choices, to quantify how much the reported instabilities persist under protocol variation. revision: yes

  2. Referee: The manuscript does not report variance estimates, statistical significance tests, or confidence intervals on the ranking variations across the 13 categories or on the scale-gain inconsistencies; without these, it is difficult to determine whether the reported instabilities are load-bearing or could arise from task sampling or probe variance.

    Authors: We agree that statistical quantification of the ranking instability and scale effects would strengthen the claims. The revised version will include bootstrap-derived confidence intervals on per-category rankings and on the scale-gain deltas, together with permutation tests assessing whether observed rank changes across categories exceed what would be expected from task sampling variance alone. revision: yes

Circularity Check

0 steps flagged

No circularity; empirical observations only

full rationale

The paper introduces GENEB as an empirical benchmark and reports direct observations from running a fixed probing protocol on 40 models across 100 tasks. No equations, derivations, fitted parameters, or self-citations appear as load-bearing steps in any claimed result. All central claims (unstable rankings, modest scale gains, architecture outweighing parameter count) are presented as outcomes of the benchmark execution itself, with no reduction to prior inputs by construction. This is the standard case of a self-contained empirical study.

Axiom & Free-Parameter Ledger

0 free parameters · 0 axioms · 0 invented entities

The central claims rest on the validity of the unified probing protocol and the representativeness of the 100 tasks; abstract provides no free parameters, axioms, or invented entities.

pith-pipeline@v0.9.1-grok · 5684 in / 1078 out tokens · 40882 ms · 2026-06-28T06:21:20.593666+00:00 · methodology

discussion (0)

Sign in with ORCID, Apple, or X to comment. Anyone can read and Pith papers without signing in.

Reference graph

Works this paper leans on

48 extracted references · 2 canonical work pages

  1. [1]

    Effective gene expression prediction from sequence by integrating long-range interactions , volume =

    Avsec, Ziga and Agarwal, Vikram and Visentin, Daniel and Ledsam, Joseph and Grabska-Barwinska, Agnieszka and Taylor, Kyle and Assael, Yannis and Jumper, John and Kohli, Pushmeet and Kelley, David , year =. Effective gene expression prediction from sequence by integrating long-range interactions , volume =. Nature Methods , doi =

  2. [2]

    2024 , eprint=

    DNABERT-2: Efficient Foundation Model and Benchmark For Multi-Species Genome , author=. 2024 , eprint=

  3. [3]

    2023 , eprint=

    MTEB: Massive Text Embedding Benchmark , author=. 2023 , eprint=

  4. [4]

    2024 , eprint=

    DNABERT-S: Pioneering Species Differentiation with Species-Aware DNA Embeddings , author=. 2024 , eprint=

  5. [5]

    2025 , eprint=

    GENERator: A Long-Context Generative Genomic Foundation Model , author=. 2025 , eprint=

  6. [6]

    DNA language model GROVER learns sequence context in the human genome , volume =

    Sanabria, Melissa and Hirsch, Jonas and Joubert, Pierre and Poetsch, Anna , year =. DNA language model GROVER learns sequence context in the human genome , volume =. Nature Machine Intelligence , doi =

  7. [7]

    2025 , doi =

    Zhou, Zhihan and Riley, Robert and Kautsar, Satria and Wu, Weimin and Egan, Rob and Hofmeyr, Steven and Goldhaber-Gordon, Shira and Yu, Mutian and Ho, Harrison and Liu, Fengchen and Chen, Feng and Morgan-Kiss, Rachael and Shi, Lizhen and Liu, Han and Wang, Zhong , title =. 2025 , doi =. https://www.biorxiv.org/content/early/2025/02/05/2025.01.30.635558.fu...

  8. [8]

    2025 , eprint=

    JanusDNA: A Powerful Bi-directional Hybrid DNA Foundation Model , author=. 2025 , eprint=

  9. [9]

    2025 , eprint=

    METAGENE-1: Metagenomic Foundation Model for Pandemic Monitoring , author=. 2025 , eprint=

  10. [10]

    2025 , eprint=

    Omni-DNA: A Unified Genomic Foundation Model for Cross-Modal and Multi-Task Learning , author=. 2025 , eprint=

  11. [11]

    bioRxiv , pages=

    A Foundational Large Language Model for Edible Plant Genomes , author=. bioRxiv , pages=. 2023 , publisher=

  12. [12]

    2024 , eprint=

    Caduceus: Bi-Directional Equivariant Long-Range DNA Sequence Modeling , author=. 2024 , eprint=

  13. [13]

    2023 , eprint=

    DNAGPT: A Generalized Pre-trained Tool for Versatile DNA Sequence Analysis Tasks , author=. 2023 , eprint=

  14. [14]

    2025 , eprint=

    eccDNAMamba: A Pre-Trained Model for Ultra-Long eccDNA Sequence Analysis , author=. 2025 , eprint=

  15. [15]

    Durrant and Brian Kang and Dhruva Katrekar and David B

    Eric Nguyen and Michael Poli and Matthew G. Durrant and Brian Kang and Dhruva Katrekar and David B. Li and Liam J. Bartie and Armin W. Thomas and Samuel H. King and Garyk Brixi and Jeremy Sullivan and Madelena Y. Ng and Ashley Lewis and Aaron Lou and Stefano Ermon and Stephen A. Baccus and Tina Hernandez-Boussard and Christopher Ré and Patrick D. Hsu and ...

  16. [16]

    2023 , doi =

    Veniamin Fishman and Yuri Kuratov and Maxim Petrov and Aleksei Shmelev and Denis Shepelin and Nikolay Chekanov and Olga Kardymon and Mikhail Burtsev , title =. 2023 , doi =. https://www.biorxiv.org/content/early/2023/06/13/2023.06.12.544594.full.pdf , journal =

  17. [17]

    2023 , eprint=

    HyenaDNA: Long-Range Genomic Sequence Modeling at Single Nucleotide Resolution , author=. 2023 , eprint=

  18. [18]

    bioRxiv , pages=

    The Nucleotide Transformer: Building and Evaluating Robust Foundation Models for Human Genomics , author=. bioRxiv , pages=. 2023 , publisher=

  19. [19]

    2025 , eprint=

    SPACE: Your Genomic Profile Predictor is a Powerful DNA Foundation Model , author=. 2025 , eprint=

  20. [20]

    2024 , doi =

    Shen, Xilin and Li, Xiangchun , title =. 2024 , doi =. https://www.biorxiv.org/content/early/2024/01/15/2024.01.14.575543.full.pdf , journal =

  21. [21]

    2024 , eprint=

    BEND: Benchmarking DNA Language Models on biologically meaningful tasks , author=. 2024 , eprint=

  22. [22]

    Miller and Armin Scheben and Michelle C

    Jingjing Zhai and Aaron Gokaslan and Yair Schiff and Ana Berthel and Zong-Yan Liu and Wei-Yun Lai and Zachary R. Miller and Armin Scheben and Michelle C. Stitzer and M. Cinta Romay and Edward S. Buckler and Volodymyr Kuleshov , title =. Proceedings of the National Academy of Sciences , volume =. 2025 , doi =. https://www.pnas.org/doi/pdf/10.1073/pnas.2421...

  23. [23]

    and Ng, Madelena Y and Pannu, Jaspreet and Re, Christopher and Schmok, Jonathan C and St

    Brixi, Garyk and Durrant, Matthew G and Ku, Jerome and Poli, Michael and Brockman, Greg and Chang, Daniel and Gonzalez, Gabriel A and King, Samuel H and Li, David B and Merchant, Aditi T and Naghipourfar, Mohsen and Nguyen, Eric and Ricci-Tam, Chiara and Romero, David W and Sun, Gwanggyu and Taghibakshi, Ali and Vorontsov, Anton and Yang, Brandon and Deng...

  24. [24]

    2025 , doi =

    Cheng, Wenduo and Song, Zhenqiao and Zhang, Yang and Wang, Shike and Wang, Danqing and Yang, Muyu and Li, Lei and Ma, Jian , title =. 2025 , doi =. https://www.biorxiv.org/content/early/2025/01/08/2025.01.06.631595.full.pdf , journal =

  25. [25]

    2025 , eprint=

    Gene42: Long-Range Genomic Foundation Model With Dense Attention , author=. 2025 , eprint=

  26. [26]

    BiDNAMamba: Pre-trained Bidirectional State Space Model for Motif Analysis in DNA , doi =

    Zeng, Guangjian and Yu, Xiaxia and Tao, Siyuan and Zhou, Weiye and Xiong, Momiao and Fang, Shenying , year =. BiDNAMamba: Pre-trained Bidirectional State Space Model for Motif Analysis in DNA , doi =

  27. [27]

    BioToken and BioFM

    Medvedev, Aleksandr and Viswanathan, Karthik and Kanithi, Praveenkumar and Vishniakov, Kirill and Munjal, Prateek and Christophe, Cl. BioToken and BioFM. 2025 , doi =. https://www.biorxiv.org/content/early/2025/04/01/2025.03.27.645711.full.pdf , journal =

  28. [28]

    2024 , doi =

    Zhang, Xiang and Yang, Mingjie and Yin, Xunhang and Qian, Yining and Sun, Fei , title =. 2024 , doi =. https://www.biorxiv.org/content/early/2024/04/28/2024.04.24.590879.full.pdf , journal =

  29. [29]

    2024 , doi =

    Ye, Peng and Bai, Weiqing and Ren, Yuchen and Li, Wenran and Qiao, Lifeng and Liang, Chaoqi and Wang, Linxiao and Cai, Yuchen and Sun, Jianle and Yang, Zejun and Zheng, Peng and Dong, Nanqing and Chen, Tao and Wang, Zhihui and Liu, Xihui and Ma, Xinzhu and Yan, Hongliang and Wang, Zhen and Wang, Sijia and Ouyang, Wanli , title =. 2024 , doi =. https://www...

  30. [30]

    and Ye, Jieping and Li, Jun and Shu, Yuelong and Shi, Mang and Li, Zhaorong , title =

    He, Yong and Fang, Pan and Shan, Yongtao and Pan, Yuanfei and Wei, Yanhong and Chen, Yichang and Chen, Yihao and Liu, Yi and Zeng, Zhenyu and Zhou, Zhan and Zhu, Feng and Holmes, Edward C. and Ye, Jieping and Li, Jun and Shu, Yuelong and Shi, Mang and Li, Zhaorong , title =. 2024 , doi =. https://www.biorxiv.org/content/early/2024/05/14/2024.05.10.592927....

  31. [31]

    2025 , doi =

    Long, Weicai and Su, Houcheng and Xiong, Jiaqi and Zhang, Yanlin , title =. 2025 , doi =. https://www.biorxiv.org/content/early/2025/01/25/2025.01.23.634452.full.pdf , journal =

  32. [32]

    2025 , eprint=

    HybriDNA: A Hybrid Transformer-Mamba2 Long-Range DNA Language Model , author=. 2025 , eprint=

  33. [33]

    2024 , eprint=

    Model Decides How to Tokenize: Adaptive DNA Sequence Tokenization with MxDNA , author=. 2024 , eprint=

  34. [34]

    2024 , eprint=

    VQDNA: Unleashing the Power of Vector Quantization for Multi-Species Genomic Sequence Modeling , author=. 2024 , eprint=

  35. [35]

    2025 , eprint=

    BMFM-DNA: A SNP-aware DNA foundation model to capture variant effects , author=. 2025 , eprint=

  36. [36]

    and Ku, Jerome and Poli, Michael and Brockman, Greg and Chang, Daniel and Gonzalez, Gabriel A

    Brixi, Garyk and Durrant, Matthew G. and Ku, Jerome and Poli, Michael and Brockman, Greg and Chang, Daniel and Gonzalez, Gabriel A. and King, Samuel H. and Li, David B. and Merchant, Aditi T. and Naghipourfar, Mohsen and Nguyen, Eric and Ricci-Tam, Chiara and Romero, David W. and Sun, Gwanggyu and Taghibakshi, Ali and Vorontsov, Anton and Yang, Brandon an...

  37. [37]

    and Dalla-Torre, Hugo and Blum, Christopher and Hexemer, Lorenz and Pandey, Priyanka and Laurent, Stefan and Lopez, Marie and Laterre, Alexandre and Lang, Maren and

    Richard, Guillaume and de Almeida, Bernardo P. and Dalla-Torre, Hugo and Blum, Christopher and Hexemer, Lorenz and Pandey, Priyanka and Laurent, Stefan and Lopez, Marie and Laterre, Alexandre and Lang, Maren and. ChatNT: A Multimodal Conversational Agent for DNA, RNA and Protein Tasks , elocation-id =. 2024 , doi =. https://www.biorxiv.org/content/early/2...

  38. [38]

    Boshar, Sam and Evans, Benjamin and Tang, Ziqi and Picard, Armand and Adel, Yanis and Lorbeer, Franziska K. and Rajesh, Chandana and Karch, Tristan and Sidbon, Shawn and Emms, David and Mendoza-Revilla, Javier and Al-Ani, Fatimah and Seitz, Evan and Schiff, Yair and Bornachot, Yohan and Hernandez, Ariana and Lopez, Marie and Laterre, Alexandre and Beguir,...

  39. [39]

    and Ahanger, Sajad H

    Mclaughlin, Shae M. and Ahanger, Sajad H. and Lim, Daniel A. , title =. 2024 , doi =. https://www.biorxiv.org/content/early/2024/12/03/2024.11.27.625761.full.pdf , journal =

  40. [40]

    2023 , doi =

    Gao, Zijing and Liu, Qiao and Zeng, Wanwen and Wong, Wing Hung and Jiang, Rui , title =. 2023 , doi =. https://www.biorxiv.org/content/early/2023/07/18/2023.07.15.549134.full.pdf , journal =

  41. [41]

    Understanding the natural language of DNA using encoder–decoder foundation models with byte-level precision , volume=

    Malusare, Aditya and Kothandaraman, Harish and Tamboli, Dipesh and Lanman, Nadia A and Aggarwal, Vaneet , editor=. Understanding the natural language of DNA using encoder–decoder foundation models with byte-level precision , volume=. Bioinformatics Advances , publisher=. doi:10.1093/bioadv/vbae117 , number=

  42. [42]

    2025 , eprint=

    HAD: Hybrid Architecture Distillation Outperforms Teacher in Genomic Sequence Modeling , author=. 2025 , eprint=

  43. [43]

    C.La.P.: Enhancing transformer-based genomic signal modeling by integrating DNA sequences and chromatin accessibility data , elocation-id =

    Nisantzis, Panos Firbas and Gon. C.La.P.: Enhancing transformer-based genomic signal modeling by integrating DNA sequences and chromatin accessibility data , elocation-id =. 2025 , doi =. https://www.biorxiv.org/content/early/2025/02/23/2025.02.19.638643.full.pdf , journal =

  44. [44]

    2022 , doi =

    Gresova, Katarina and Martinek, Vlastimil and Cechak, David and Simecek, Petr and Alexiou, Panagiotis , title =. 2022 , doi =. https://www.biorxiv.org/content/early/2022/06/10/2022.06.08.495248.full.pdf , journal =

  45. [45]

    2025 , eprint=

    OmniGenBench: A Modular Platform for Reproducible Genomic Foundation Models Benchmarking , author=. 2025 , eprint=

  46. [46]

    2024 , doi =

    Feng, Haonan and Wu, Lang and Zhao, Bingxin and Huff, Chad and Zhang, Jianjun and Wu, Jia and Lin, Lifeng and Wei, Peng and Wu, Chong , title =. 2024 , doi =. https://www.biorxiv.org/content/early/2024/08/18/2024.08.16.608288.full.pdf , journal =

  47. [47]

    2025 , eprint=

    OmniGenBench: A Benchmark for Omnipotent Multimodal Generation across 50+ Tasks , author=. 2025 , eprint=

  48. [48]

    bioRxiv preprint bioRxiv:2025.06.25.661622 , year=

    Genomic Touchstone: Benchmarking Genomic Language Models in the Context of the Central Dogma , author=. bioRxiv preprint bioRxiv:2025.06.25.661622 , year=