TABVERSE: Benchmarking Cross-Format Table Understanding in LLMs and VLMs
Pith reviewed 2026-06-27 16:45 UTC · model grok-4.3
The pith
Table representation substantially affects how LLMs and VLMs understand the same content.
A machine-rendered reading of the paper's core claim, the machinery that carries it, and where it could break.
Core claim
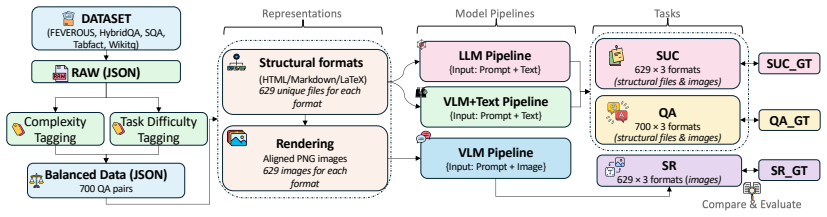
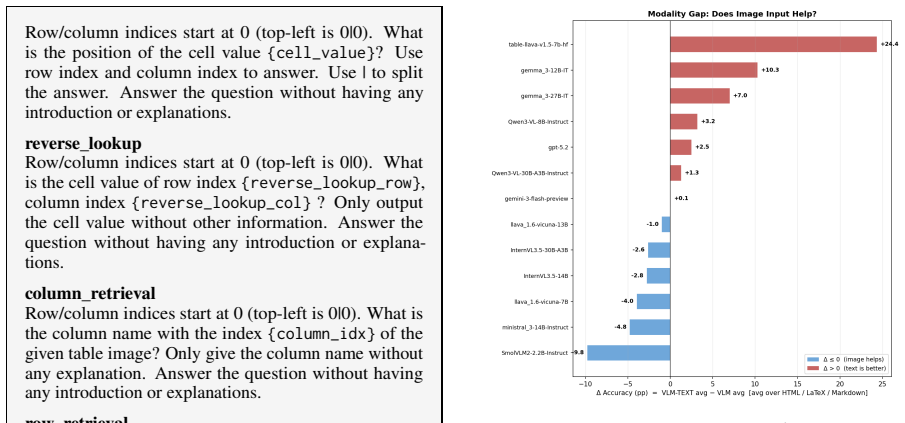
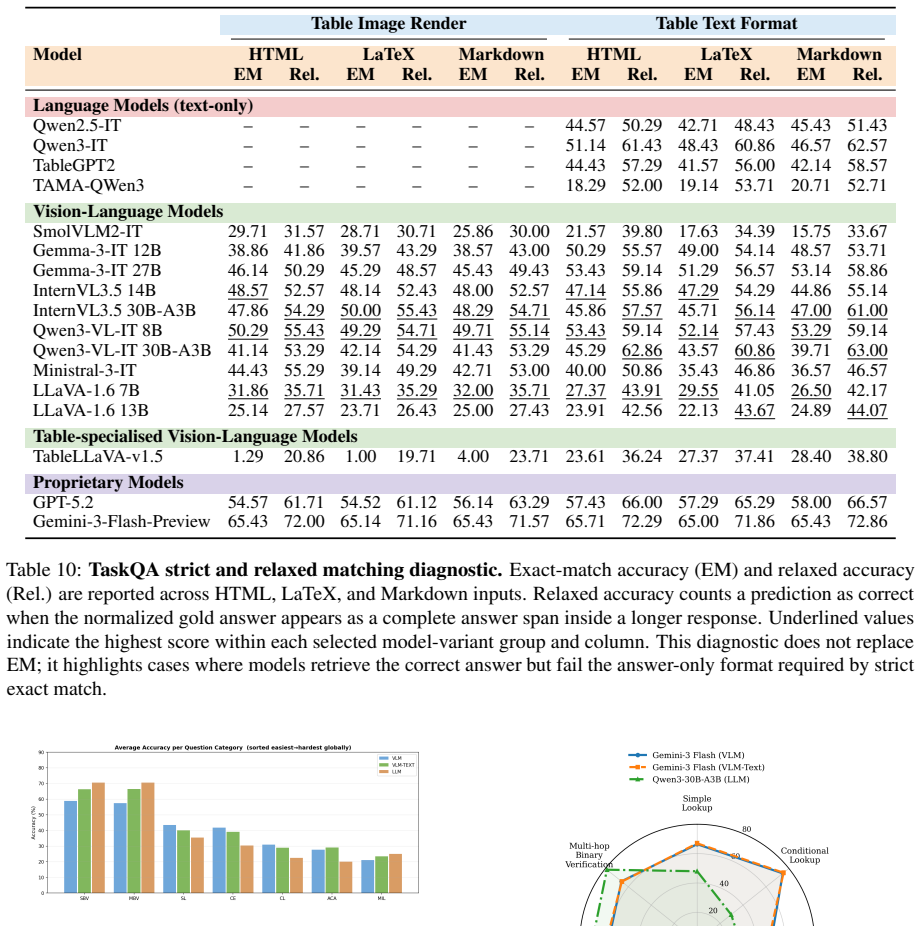
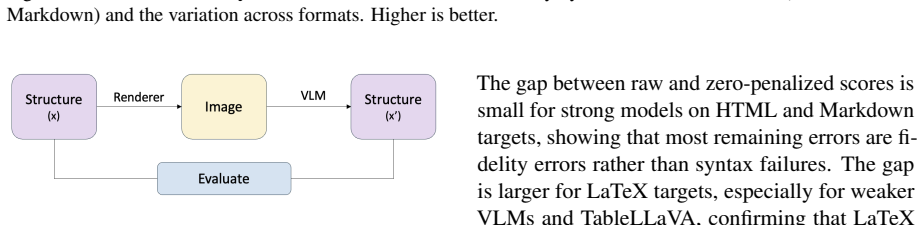
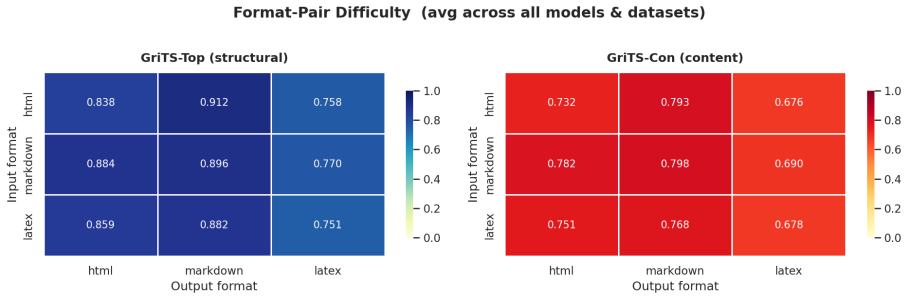
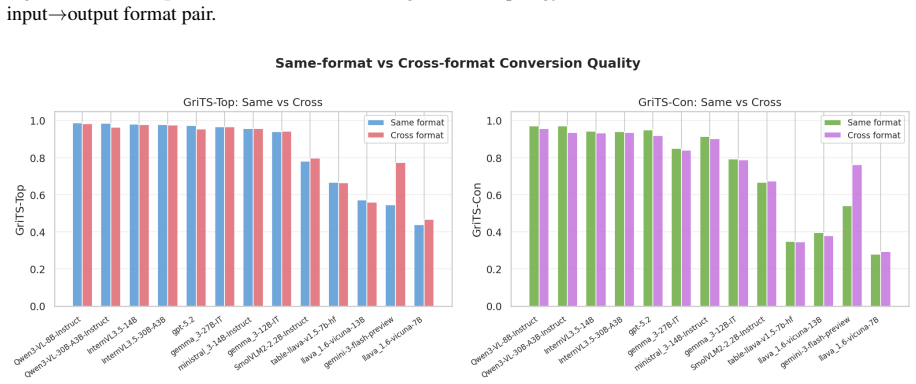
By aligning identical table content across multiple structural formats and rendered images, TABVERSE reveals that representation choice substantially affects table understanding performance in LLMs and VLMs. Models generally perform better with structured text than with rendered images, but the size of this gap depends on the task, model, and format. HTML is often the most robust text format, while row-sensitive structural tasks and syntactically usable LaTeX reconstruction remain challenging.
What carries the argument
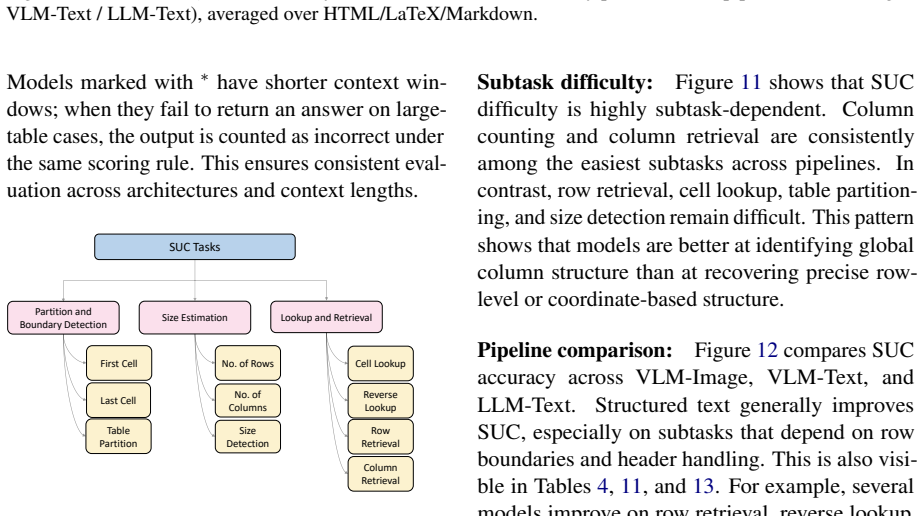
TABVERSE benchmark that aligns identical table content across structural text formats and images while tagging questions by category and difficulty.
If this is right
- Representation must be treated as a controlled variable in any table reasoning evaluation.
- Structured text inputs yield higher performance than image inputs for most models and tasks.
- HTML tends to produce more consistent results than other text formats across the tested models.
- Row-sensitive tasks and LaTeX reconstruction stay difficult even with optimal representations.
- Benchmarks that let format vary with content cannot cleanly measure model capability.
Where Pith is reading between the lines
- Model developers may benefit from training on multiple representations of the same tables to increase format robustness.
- Evaluation protocols for table tasks should specify and standardize the input format used.
- Extending the benchmark to additional modalities or interactive table edits could reveal further representation sensitivities.
- Practical systems might route table inputs to the format that matches the model's strongest performance.
Load-bearing premise
The benchmark can present the same table content in different formats and images without changing the underlying information that models must process.
What would settle it
An evaluation on new tables showing identical model accuracy across all text formats and image renderings would contradict the claim that representation choice substantially affects performance.
Figures
read the original abstract
Large Language Models (LLMs) and Vision-Language Models (VLMs) are increasingly evaluated on table reasoning tasks, but the role of table representation remains under-explored. In practice, the same table content may appear in different structural formats, such as HTML, Markdown, and LaTeX, or as rendered images. However, existing evaluations often let content, format, layout, and modality vary together, making it difficult to isolate representation effects. We introduce TABVERSE, a controlled multimodal table benchmark that aligns the same table content across multiple structural formats and rendered images, with question category and difficulty tags. This design enables systematic evaluation of representation effects while holding table content fixed. We evaluate LLMs and VLMs across three tasks: Question Answering (QA), Structural Understanding Capability (SUC), and Structure Reconstruction (SR). Our results show that representation choice substantially affects table understanding. Models generally perform better with structured text than with rendered images, but the size of this gap depends on the task, model, and format. HTML is often the most robust text format, while row-sensitive structural tasks and syntactically usable LaTeX reconstruction remain challenging. These findings show that table representation is a key factor in reliable table evaluation.
Editorial analysis
A structured set of objections, weighed in public.
Referee Report
Summary. The paper introduces TABVERSE, a controlled multimodal benchmark aligning identical table content across structural formats (HTML, Markdown, LaTeX) and rendered images, tagged with question categories and difficulties. It evaluates LLMs and VLMs on QA, Structural Understanding Capability (SUC), and Structure Reconstruction (SR) tasks, claiming that representation choice substantially affects performance, with structured text generally outperforming images (gap size varying by task/model/format), HTML often most robust, and row-sensitive or LaTeX reconstruction tasks remaining challenging.
Significance. If the central isolation of representation effects holds, the work provides a useful controlled benchmark for table reasoning evaluation and highlights representation as a key variable. The explicit design for holding content fixed while varying format is a methodological strength that could support more reliable comparisons than prior mixed-format evaluations.
major comments (2)
- [Abstract] Abstract: the claim that the benchmark 'aligns the same table content across multiple structural formats and rendered images, with question category and difficulty tags' while 'holding table content fixed' is load-bearing for all reported performance gaps, yet the manuscript provides no description of automated equivalence tests, round-trip fidelity checks, human audits, or canonical data-structure comparisons between structural and image versions.
- [Abstract] Abstract and evaluation description: no dataset sizes, number of tables/questions, error bars, or statistical significance tests are reported for the performance differences across representations; without these, the claim that 'representation choice substantially affects table understanding' and that 'the size of this gap depends on the task, model, and format' cannot be fully assessed for reliability.
minor comments (1)
- The abstract would be clearer if it specified the total number of tables, questions per task, and models evaluated.
Simulated Author's Rebuttal
We thank the referee for their constructive comments, which help clarify the presentation of the TABVERSE benchmark's core methodological claims. We respond point by point to the major comments below.
read point-by-point responses
-
Referee: [Abstract] Abstract: the claim that the benchmark 'aligns the same table content across multiple structural formats and rendered images, with question category and difficulty tags' while 'holding table content fixed' is load-bearing for all reported performance gaps, yet the manuscript provides no description of automated equivalence tests, round-trip fidelity checks, human audits, or canonical data-structure comparisons between structural and image versions.
Authors: We agree that the abstract and construction section would benefit from an explicit account of equivalence verification to substantiate the claim that content is held fixed. The benchmark is generated from a single canonical table representation, but the manuscript does not currently detail the automated checks, round-trip fidelity procedures, human audits, or structural comparisons used. We will add a dedicated subsection describing these verification steps. revision: yes
-
Referee: [Abstract] Abstract and evaluation description: no dataset sizes, number of tables/questions, error bars, or statistical significance tests are reported for the performance differences across representations; without these, the claim that 'representation choice substantially affects table understanding' and that 'the size of this gap depends on the task, model, and format' cannot be fully assessed for reliability.
Authors: The experimental section reports the number of tables and questions along with performance metrics that include standard deviations. However, these quantities and the use of significance testing are not referenced in the abstract or high-level evaluation description. We will revise the abstract to include dataset sizes and add an explicit statement that error bars and statistical tests are provided in the results. This addresses the concern about assessing reliability. revision: yes
Circularity Check
No circularity: empirical benchmark with direct evaluation
full rationale
The paper introduces TABVERSE as a controlled benchmark and reports empirical results on LLMs/VLMs across QA, SUC, and SR tasks. No equations, derivations, fitted parameters, or predictions appear in the provided text. The central claim (representation affects performance while holding content fixed) rests on benchmark construction and direct measurement rather than any self-definitional reduction, self-citation chain, or renaming of known results. The skeptic concern about format equivalence is a validity question, not a circularity reduction.
Axiom & Free-Parameter Ledger
Reference graph
Works this paper leans on
-
[1]
InFind- ings of the Association for Computational Linguis- tics: ACL 2024, pages 407–426, Bangkok, Thailand
Tables as texts or images: Evaluating the table reasoning ability of LLMs and MLLMs. InFind- ings of the Association for Computational Linguis- tics: ACL 2024, pages 407–426, Bangkok, Thailand. Association for Computational Linguistics. Heng Gong, Yawei Sun, Xiaocheng Feng, Bing Qin, Wei Bi, Xiaojiang Liu, and Ting Liu. 2020. TableGPT: Few-shot table-to-t...
2024
-
[2]
Jonathan Herzig, Pawel Krzysztof Nowak, Thomas Müller, Francesco Piccinno, and Julian Eisenschlos
IEEE. Jonathan Herzig, Pawel Krzysztof Nowak, Thomas Müller, Francesco Piccinno, and Julian Eisenschlos
-
[3]
InProceedings of the 58th Annual Meet- ing of the Association for Computational Linguistics, pages 4320–4333, Online
TaPas: Weakly supervised table parsing via pre-training. InProceedings of the 58th Annual Meet- ing of the Association for Computational Linguistics, pages 4320–4333, Online. Association for Computa- tional Linguistics. Mohit Iyyer, Wen-tau Yih, and Ming-Wei Chang. 2017. Search-based neural structured learning for Sequen- tial Question Answering. InProcee...
2017
-
[4]
Da Li, Keping Bi, Jiafeng Guo, Wei Yuan, Fan Yang, Tingting Gao, and Xueqi Cheng
TableVQA-Bench: A visual question answer- ing benchmark on multiple table domains.ArXiv preprint, abs/2404.19205. Da Li, Keping Bi, Jiafeng Guo, Wei Yuan, Fan Yang, Tingting Gao, and Xueqi Cheng. 2026. Beyond text- only: Towards multimodal table retrieval in open- world. InThe Fourteenth International Conference on Learning Representations. Liyao Li, Jiam...
arXiv 2026
-
[5]
InPro- ceedings of the IEEE/CVF Conference on Computer Vision and Pattern Recognition, pages 4634–4642
PubTables-1M: Towards comprehensive ta- ble extraction from unstructured documents. InPro- ceedings of the IEEE/CVF Conference on Computer Vision and Pattern Recognition, pages 4634–4642. Brandon Smock, Rohith Pesala, and Robin Abraham
-
[6]
GriTS: Grid Table Similarity metric for ta- ble structure recognition. InDocument Analysis and Recognition - ICDAR 2023: 17th International Con- ference, San José, CA, USA, August 21–26, 2023, Proceedings, Part V, page 535–549, Berlin, Heidel- berg. Springer-Verlag. Aofeng Su, Aowen Wang, Chao Ye, Chen Zhou, Ga Zhang, Gang Chen, Guangcheng Zhu, Haobo Wang...
arXiv 2023
-
[7]
TableLlama: Towards open large general- ist models for tables. InProceedings of the 2024 Conference of the North American Chapter of the Association for Computational Linguistics: Human Language Technologies (Volume 1: Long Papers), pages 6024–6044, Mexico City, Mexico. Association for Computational Linguistics. Xiaokang Zhang, Sijia Luo, Bohan Zhang, Zey...
2024
-
[8]
country with population 67.02 million
Seq2SQL: Generating structured queries from natural language using reinforcement learning. Preprint, arXiv:1709.00103. Fengbin Zhu, Wenqiang Lei, Youcheng Huang, Chao Wang, Shuo Zhang, Jiancheng Lv, Fuli Feng, and Tat- Seng Chua. 2021. TAT-QA: A question answering benchmark on a hybrid of tabular and textual con- tent in finance. InProceedings of the 59th...
Pith/arXiv arXiv 2021
-
[9]
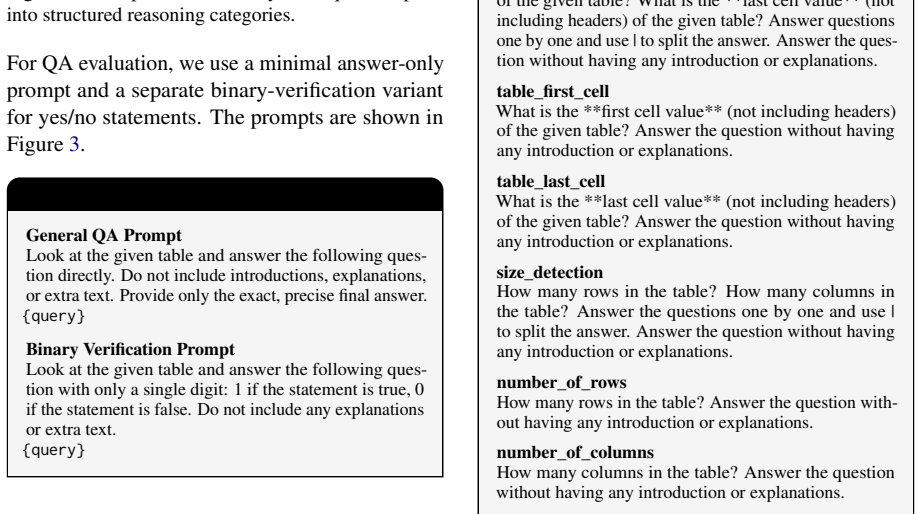
Identify what the question asks for: • single value • list/set • number • yes/no
-
[10]
Identify which table cell(s) must be read or aggre- gated to produce the final answer
-
[11]
Verify that the final answer is directly read from or computed using ONLY table cells
-
[12]
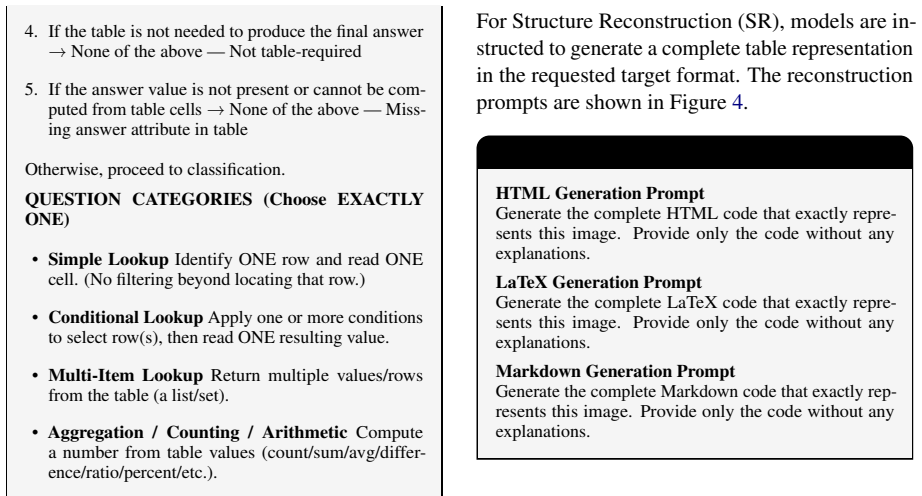
If the table is not needed to produce the final answer →None of the above — Not table-required
-
[13]
cannot determine
If the answer value is not present or cannot be com- puted from table cells → None of the above — Miss- ing answer attribute in table Otherwise, proceed to classification. QUESTION CATEGORIES (Choose EXACTLY ONE) • Simple LookupIdentify ONE row and read ONE cell. (No filtering beyond locating that row.) •Conditional LookupApply one or more conditions to s...
discussion (0)
Sign in with ORCID, Apple, or X to comment. Anyone can read and Pith papers without signing in.