REVIEW 3 major objections 4 references
Five independent dimensions capture the rest-frame optical light of typical galaxies, and they are not the ones stellar-population models treat as primary.
Reviewed by Pith at T0; open to challenge. T0 means a machine referee read the full paper against a public rubric. the ladder, T0–T4 →
Rest-frame optical galaxy SEDs from a 16-parameter SPS model are captured by five disentangled VAE latents (mass, young stars, dust, soft/hard ionization); metallicity and age are not independent drivers.
T0 review reviewed 2026-07-12 challenge →
load-bearing objection Clean five-axis optical SED result inside pop-cosmos, with the usual synthetic-data caveat that does not kill the paper. the 3 major comments →
pop-cosmos: Disentangling galaxy properties from observables using data-driven approaches
The pith
A machine-rendered reading of the paper's core claim, the machinery that carries it, and where it could break.
The reading
Core claim
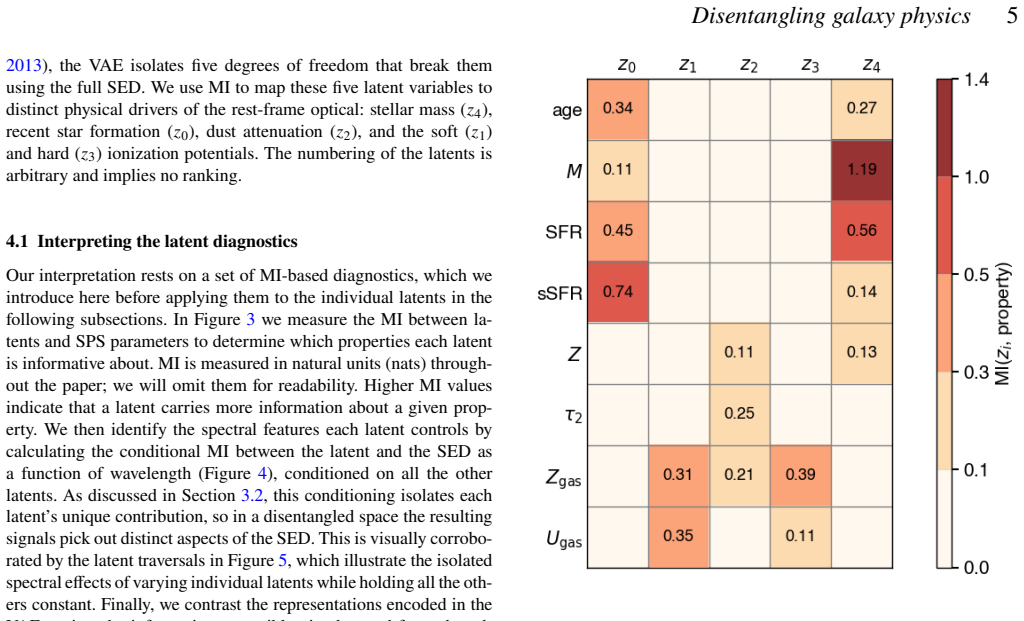
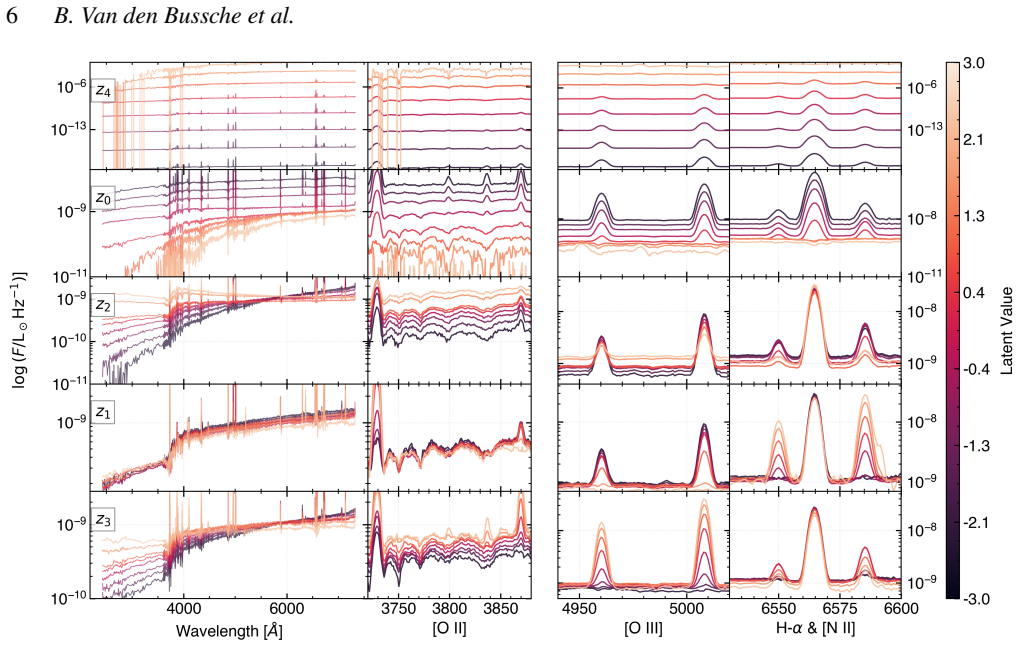
Five independent latent dimensions suffice to describe the rest-frame optical spectral energy distributions of COSMOS2020-like galaxies. They correspond to stellar mass, recent star formation, dust attenuation, and soft and hard ionization potentials of the gas. Stellar metallicity and stellar age are not primary independent drivers; their spectral effects are distributed across the other dimensions rather than independently encoded.
What carries the argument
A β-variational autoencoder trained with annealing, whose five-dimensional latent space is interpreted by mutual information between latents, SPS parameters, and wavelength-by-wavelength spectral features (including conditional MI).
Load-bearing premise
The entire analysis rests on noiseless synthetic spectra generated by a population model calibrated only to broadband photometry, so the claimed dimensionality and physical axes are those of the model, not of real noisy galaxy spectra.
What would settle it
Apply the same β-VAE and mutual-information analysis to a large sample of real, high-resolution rest-frame optical spectra (for example SDSS or DESI) of mass-complete star-forming galaxies and check whether five latents still saturate reconstruction accuracy and map to the same five physical axes.
If this is right
- Optical photometry alone cannot isolate stellar metallicity or mass-weighted age as independent parameters; those quantities must be constrained by other wavelengths or by external priors.
- Two latent dimensions that capture soft and hard ionization lines replace traditional BPT-style line ratios for diagnosing gas-phase metallicity and ionization state in typical star-forming galaxies.
- The five latents supply low-dimensional, physically interpretable summary statistics for simulation-based inference of galaxy properties.
- Extending the same analysis into the near- and mid-infrared is expected to reveal additional independent degrees of freedom associated with AGN and older stellar populations.
Where Pith is reading between the lines
- If the same five axes reappear in real spectra, survey pipelines could replace multi-parameter SPS fits with a five-dimensional latent encoding for photo-z and SED classification.
- The result suggests that many of the sixteen SPS parameters used by modern codes are redundant for optical data, so future SPS models may be re-parametrized around the five independent drivers.
- A natural next test is whether the soft/hard ionization latents remain orthogonal once weak AGN or shock contributions are allowed in the optical.
Editorial analysis
A structured set of objections, weighed in public.
Referee Report
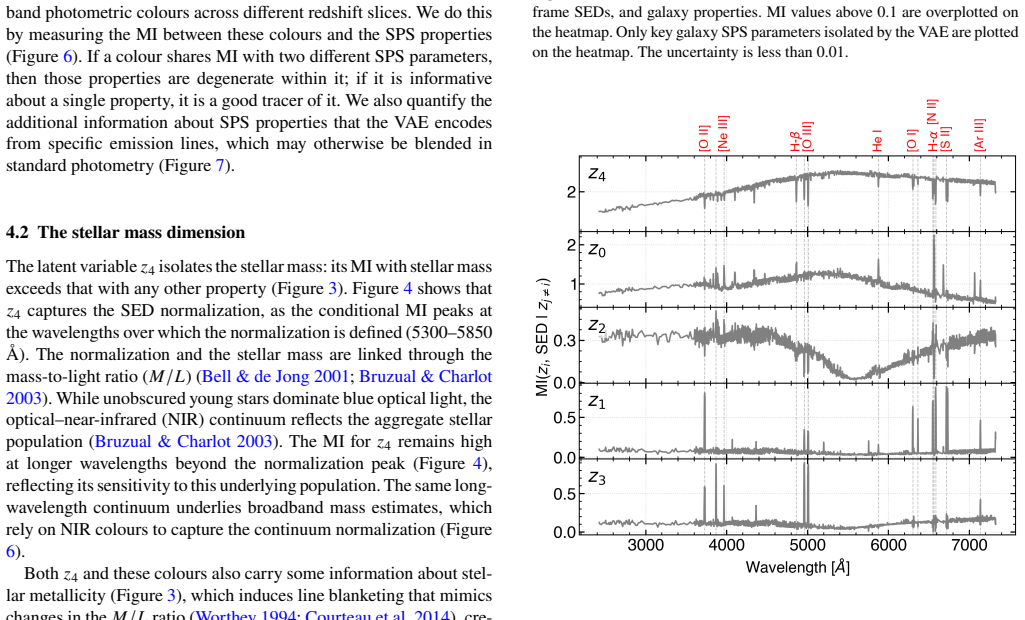
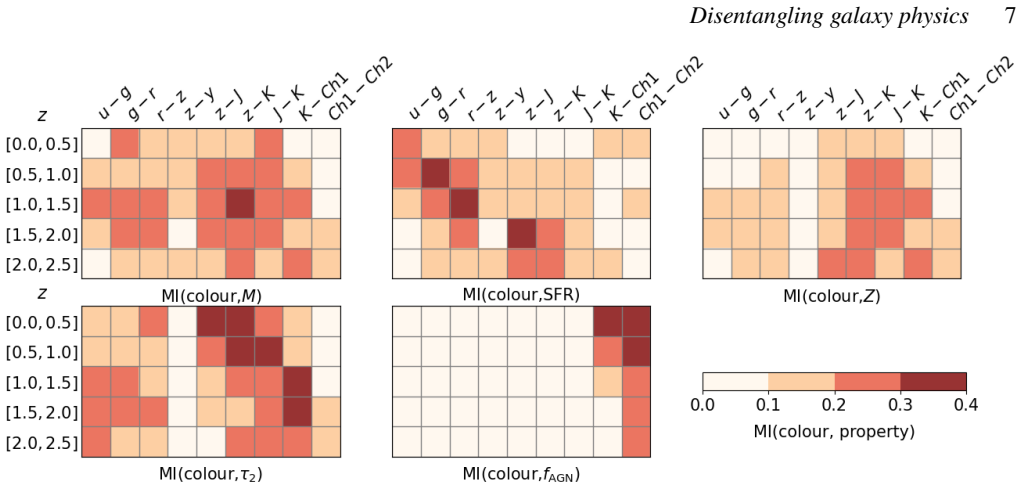
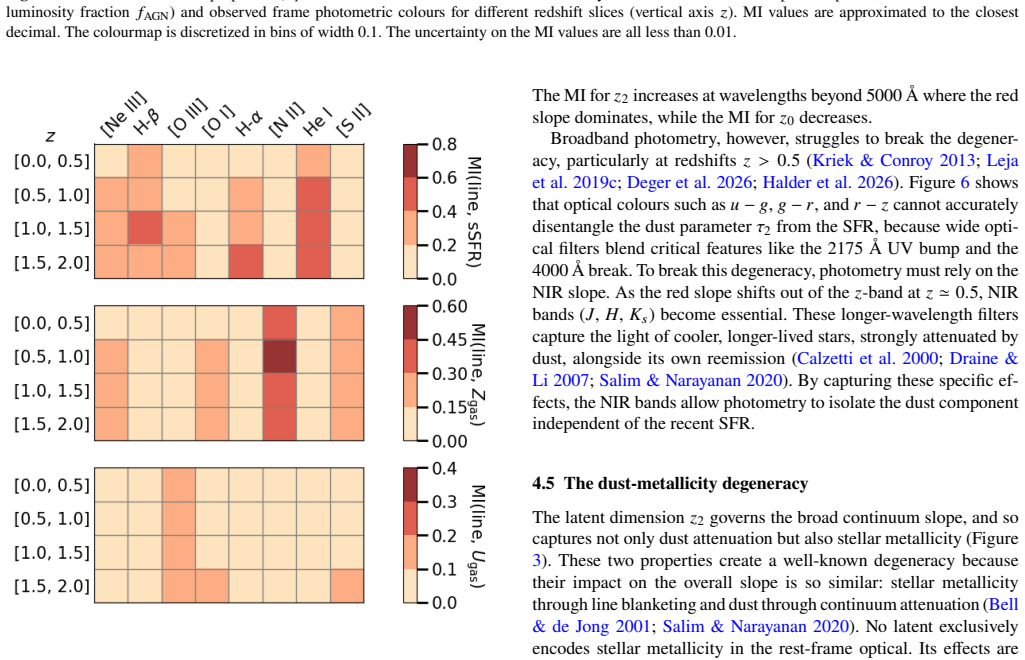
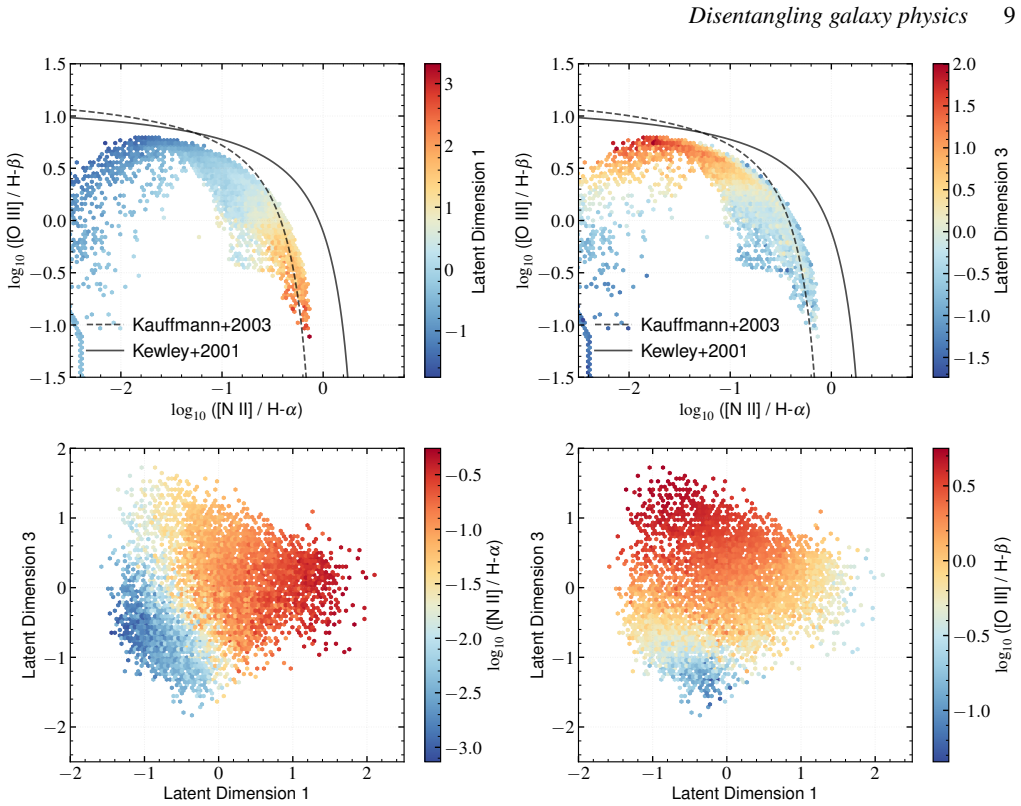
Summary. The paper trains a β-VAE on noiseless rest-frame optical SEDs (2425–7327 Å) drawn from the pop-cosmos generative model and argues that five disentangled latent dimensions are necessary and sufficient to describe those SEDs. Mutual information maps the latents to stellar mass (z4), recent star formation (z0), dust attenuation (z2), and soft/hard ionization (z1, z3); stellar metallicity and mass-weighted age are not recovered as independent drivers. Conditional MI spectra, latent traversals, and comparisons to broadband colours and BPT line ratios are used to show that the latents isolate spectral features that photometry blends, and that the two ionization latents separate physical regimes more cleanly than standard line-ratio diagnostics for typical star-forming galaxies.
Significance. If the five-dimensional optical manifold and its physical mapping hold, the work supplies a concrete, information-theoretic compression of SPS parameter space that is useful both as a diagnostic and as a low-dimensional summary for simulation-based inference. Strengths include a quantitative disentanglement check (latent–latent MI matrix), wavelength-resolved conditional MI, controlled latent traversals, an explicit ablation of latent dimensionality, and a direct comparison against BPT axes. The analysis is carefully executed inside the synthetic catalogue and is a natural next step for the pop-cosmos programme.
major comments (3)
- The central claim that five independent dimensions 'suffice' for the rest-frame optical SED (abstract, §4 opening paragraph, conclusions) is established only for noiseless FSPS/CLOUDY SEDs generated from the same 16-parameter SPS model whose population distribution was calibrated to broadband COSMOS2020 photometry (§2). pop-cosmos was never constrained by optical continuum shape or emission-line ratios at the resolution used here; the recovered rank and the statement that stellar metallicity and age are not primary drivers are therefore statements about the effective rank of that particular forward map under the adopted SFH, dust, and CLOUDY grids. The manuscript should state this scope limitation explicitly in the abstract and conclusions, and either (i) test the five-axis claim on real spectra (or spectra with realistic noise and continuum residuals) or (ii) reframe the result as a pro
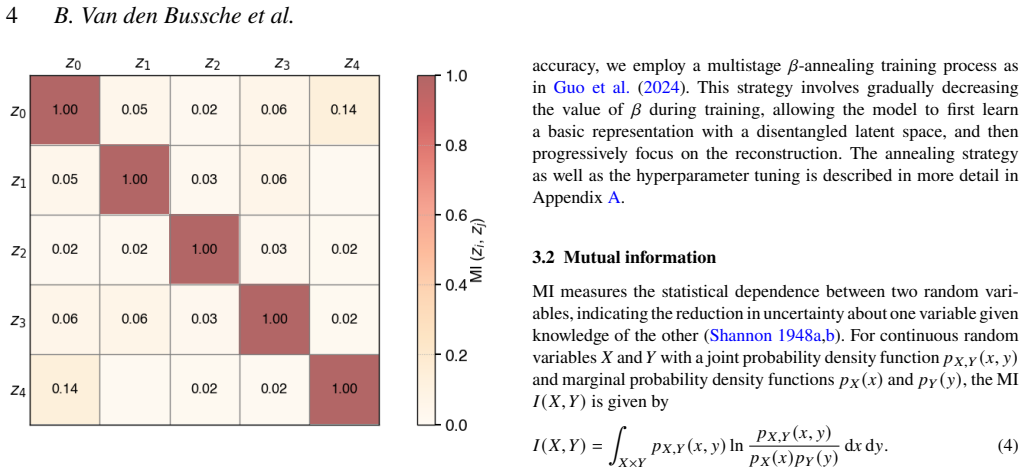
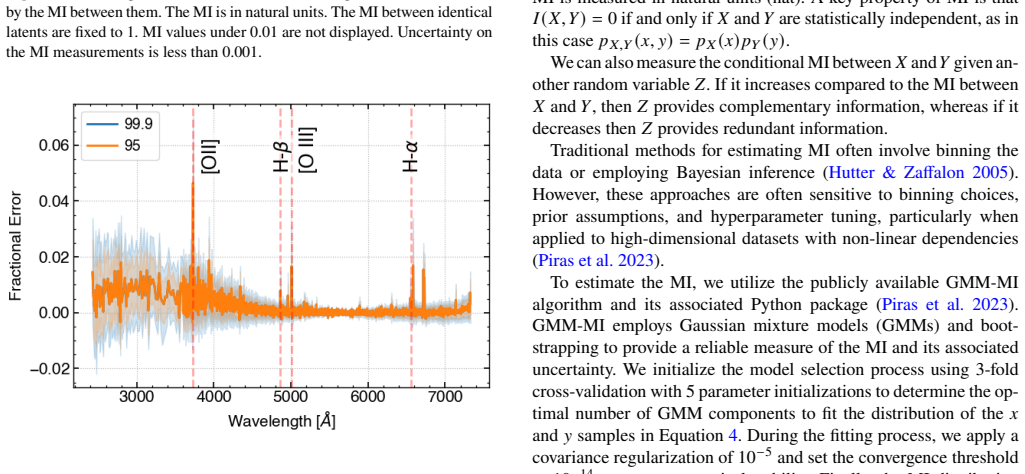
- §4 (dimensionality choice) and Appendix A: the decision that five latents are necessary and sufficient rests on a reconstruction-error ablation (six dimensions give no 99th-percentile gain; four raise fractional error by >2%) plus latent–latent MI < 0.15. That is necessary but not sufficient for the physical claim. The paper should report (a) whether a four-latent model still recovers the same physical axes (or collapses soft/hard ionization), (b) sensitivity of the MI–physics mapping to the β-annealing schedule and to α = 10 000, and (c) a quantitative comparison against a linear baseline (e.g. PCA on the same SEDs) so that the non-linear gain is measured rather than asserted.
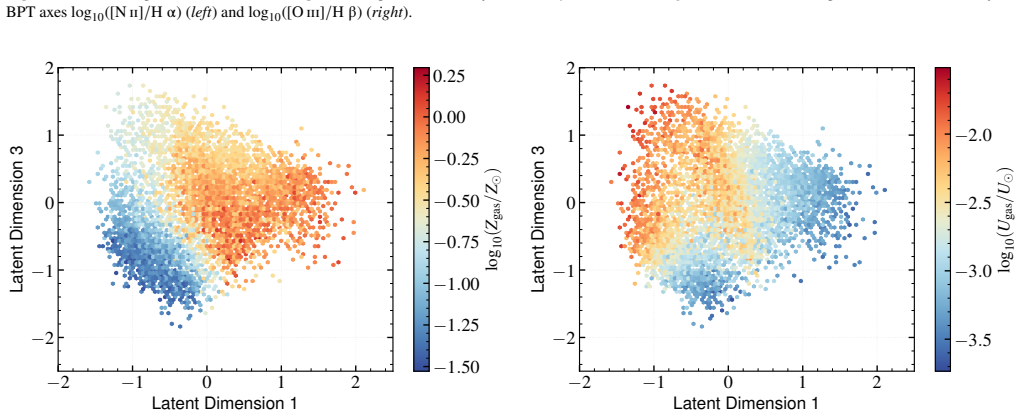
- §5 and Fig. 8–9: the claim that the two ionization latents recover gas conditions 'more cleanly than the line-ratio diagnostics in standard use' is only partially supported. The BPT comparison is restricted to the pure star-forming sequence of a model that omits optical AGN and shocks by construction (§5). The three regimes identified in the z1–z3 plane are visually compelling but lack a quantitative metric (e.g. mutual information of (z1, z3) vs. (Zgas, Ugas) relative to standard line ratios, or a classification purity against held-out SPS labels). Without that, the superiority claim over BPT remains qualitative.
Circularity Check
Five-DoF optical-SED claim is the effective rank of the authors' own pop-cosmos SPS mapping under its photometric prior, not an independent measurement of real spectra.
specific steps
-
self citation load bearing
[§2 (Sample Generation), validation paragraph; also Abstract and §6 Conclusions]
"Our analysis relies on pop-cosmos having learned a robust connection between SPS properties and the SEDs they produce. This model has been extensively validated: in addition to stringent tests against COSMOS2020 data, it reproduces well-studied galaxy evolution trends. These include the star-forming main sequence, the mass-metallicity relation, and the fundamental metallicity relation (Thorp et al. 2025b). ... Deger et al. (2026) ... Halder et al. (2026) ... Since each SED follows deterministically from its SPS parameters, validating their population distribution validates the resulting SED po"
The entire training set consists of noiseless rest-frame optical SEDs generated by applying FSPS/CLOUDY to SPS parameters drawn from pop-cosmos (Alsing/Thorp/Deger et al., overlapping co-authors). The claim that five independent dimensions 'suffice' for the rest-frame optical SED of galaxies therefore reduces to a statement about the effective rank of that self-generated mapping under the photometric prior. The only justification offered for treating the result as a property of real galaxies is the self-cited photometric and demographic validations of pop-cosmos, which do not test spectral dimensionality or line-ratio structure at the resolution of the VAE inputs.
-
self citation load bearing
[Abstract; §4 opening; §6 Conclusions]
"Leveraging the pop-cosmos generative galaxy population model, we investigate how many independent degrees of freedom the rest-frame optical SED contains. ... We find that five independent dimensions suffice, corresponding to stellar mass, recent star formation, dust, and two degrees of freedom in the ionization state of the gas. Stellar metallicity and stellar age are not among these primary drivers ... The pop-cosmos generative model used to create our synthetic data needed 15 SPS parameters ... Our results imply that the rest-frame optical SED in this model can be represented within a signif"
The abstract states the five-DoF result as a fact about 'the rest-frame optical SED' and about recovering gas conditions 'in typical star-forming galaxies,' while the body and conclusions correctly restrict the claim to SEDs 'drawn from the pop-cosmos galaxy population model.' The leap from model manifold to real-galaxy SED is supported only by the same self-citations; no external spectral catalogue is analysed. Thus the strongest scientific claim inherits its load-bearing justification from the authors' prior generative model.
full rationale
The paper is transparent that every SED is a noiseless, deterministic FSPS/CLOUDY forward map of the 16-parameter SPS vector drawn from pop-cosmos (overlapping authors). The VAE reconstruction + MI analysis therefore measures the intrinsic dimensionality and degeneracies of that particular generative model, not of observed spectra. The abstract and conclusions nevertheless present the five dimensions (and the non-independence of metallicity/age) as properties of 'the rest-frame optical SED' and of 'typical star-forming galaxies.' That generalization rests solely on self-citations to photometric and population-level validations of pop-cosmos; those validations do not constrain optical continuum shape or line ratios at the resolution used here. The internal VAE/MI steps themselves are not circular (they are a legitimate compression of the synthetic catalogue), but the load-bearing premise that the catalogue faithfully represents real optical SEDs is justified only by the authors' prior work. This is partial circularity of applicability, not a definitional loop inside the equations, hence score 4 rather than 6+.
Axiom & Free-Parameter Ledger
free parameters (4)
- β-annealing schedule (initial β=6 → 1.9 → 1.1, three stages, 600 epochs)
- latent dimensionality fixed at 5
- normalization-weight α=10 000 in MSE loss
- VAE architecture (7 conv layers, filter progression 16→1024, 512-unit bottleneck, LeakyReLU slope 0.15)
axioms (4)
- domain assumption The pop-cosmos generative model plus FSPS/CLOUDY produces a joint distribution of optical SEDs whose intrinsic dimensionality matches that of real COSMOS-like galaxies.
- ad hoc to paper A β-VAE with the chosen annealing schedule recovers statistically independent physical degrees of freedom rather than arbitrary mixtures.
- domain assumption Mutual information estimated by GMM-MI correctly ranks the physical content of each latent.
- domain assumption AGN and shocks do not contribute to the optical SED of the modeled population.
Cite this review
Pith. "Pith review of pop-cosmos: Disentangling galaxy properties from observables using data-driven approaches." pith.science (2026). https://pith.science/paper/2HYGZNQ3
@misc{pith2026260611308,
  author       = {Pith},
  title        = {Pith review of: pop-cosmos: Disentangling galaxy properties from observables using data-driven approaches},
  year         = {2026},
  howpublished = {\url{https://pith.science/paper/2HYGZNQ3}},
  note         = {Machine review of arXiv:2606.11308}
}
abstract
The physical processes that shape a galaxy's spectrum are strongly degenerate in observations, obscuring which processes act independently. Leveraging the pop-cosmos generative galaxy population model, we investigate how many independent degrees of freedom the rest-frame optical SED contains. We use a $\beta$-variational autoencoder (VAE) to compress a 16-parameter stellar population synthesis (SPS) description into a disentangled latent representation interpreted through mutual information (MI). We find that five independent dimensions suffice, corresponding to stellar mass, recent star formation, dust, and two degrees of freedom in the ionization state of the gas. Stellar metallicity and stellar age are not among these primary drivers; their spectral effects are distributed across the others rather than independently encoded. By tying each dimension to specific spectral features, this decomposition breaks the star-formation--dust--metallicity degeneracies that limit broadband photometry, and recovers the physical conditions of the gas in typical star-forming galaxies more cleanly than the line-ratio diagnostics in standard use.
Figures










Reference graph
Works this paper leans on
-
[1]
Alsing J., et al., 2020, ApJS, 249, 5 Alsing J., Peiris H., Mortlock D., Leja J., Leistedt B., 2023, ApJS, 264, 29 Alsing J., Thorp S., Deger S., Peiris H. V., Leistedt B., Mortlock D., Leja J., 2024, ApJS, 274, 12 Astropy Collaboration et al., 2013, A&A, 558, A33 Astropy Collaboration et al., 2018, AJ, 156, 123 Astropy Collaboration et al., 2022, ApJ, 93...
2020
-
[2]
D., 2016, ApJ, 823, 102 Connolly A
pp 6572– 6583 (arXiv:1806.07366) Chevallard J., Charlot S., 2016, MNRAS, 462, 1415 Chiang Y.-K., Makiya R., Ménard B., 2025, ApJ, 992, 65 Choi J., Dotter A., Conroy C., Cantiello M., Paxton B., Johnson B. D., 2016, ApJ, 823, 102 Connolly A. J., Csabai I., Szalay A. S., Koo D. C., Kron R. G., Munn J. A., 1995, AJ, 110, 2655 Conroy C., 2013, ARA&A, 51, 393 ...
-
[3]
D., 2021, bd-j/sedpy, Zenodo, doi:10.5281/zenodo.4582723 MNRAS000, 1–13 (2026) 12B
Elsevier, pp 236–281 (arXiv:2502.17680), doi:10.1016/B978-0-443-21439-4.00127-9 Johnson B. D., 2021, bd-j/sedpy, Zenodo, doi:10.5281/zenodo.4582723 MNRAS000, 1–13 (2026) 12B. Van den Bussche et al. Johnson B. D., et al., 2021a, dfm/python-fsps, v0.4.1rc1, Zenodo, doi:10.5281/zenodo.4737461 Johnson B. D., Leja J., Conroy C., Speagle J. S., 2021b, ApJS, 254...
Pith/arXiv arXiv doi:10.1016/b978-0-443-21439-4.00127-9 2021
-
[4]
pp 8024–8035 (arXiv:1912.01703) Paxton B., Bildsten L., Dotter A., Herwig F., Lesaffre P., Timmes F., 2011, ApJS, 192, 3 Paxton B., et al., 2013, ApJS, 208, 4 Paxton B., et al., 2015, ApJS, 220, 15 Pérez-Montero E., Contini T., 2009, MNRAS, 398, 949 Pettini M., Pagel B. E. J., 2004, MNRAS, 348, L59 Piras D., Lombriser L., 2024, Phys. Rev. D, 110, 023514 P...
This paper was first reviewed by grok-4.5 on July 12, 2026.
discussion (0)
Sign in with ORCID, Apple, or X to comment. Anyone can read and Pith papers without signing in.