SEAGAN: domain-Specific and Edge-Aware Graph Attention Network for Dynamic Plant Processes
Pith reviewed 2026-06-26 20:46 UTC · model grok-4.3
The pith
Representing A-Ci curves as graphs lets a tailored graph attention network classify biochemical limiting states with 0.857 F1-score.
A machine-rendered reading of the paper's core claim, the machinery that carries it, and where it could break.
Core claim
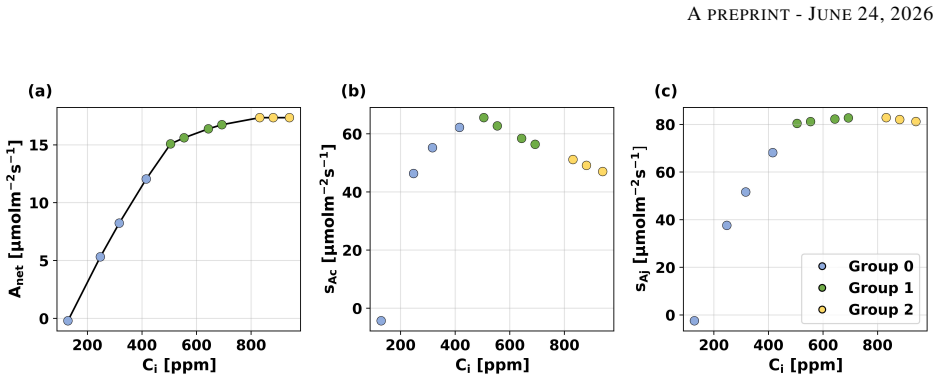
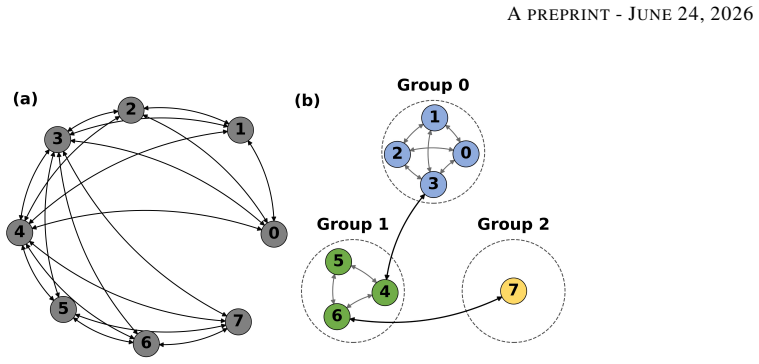
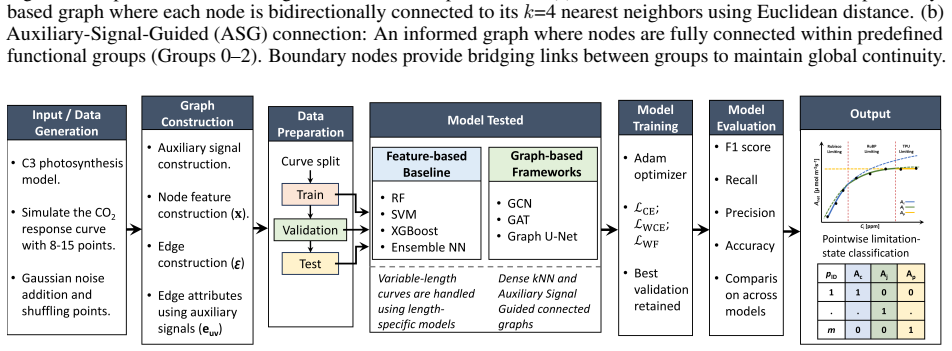
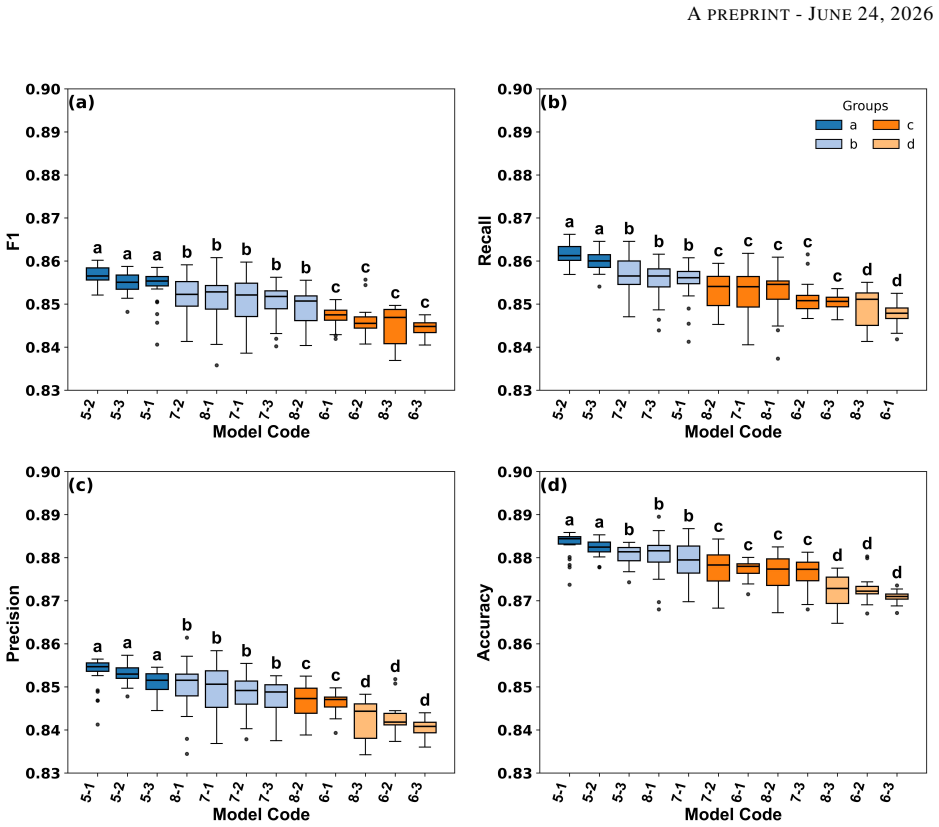
Expressing limitation-state identification in A-Ci curves as a graph-based node classification problem, created with distance-based k-nearest-neighbor and auxiliary-signal-guided connectivity, allows the SEAGAN model (which integrates process-aware node features, edge attributes, kNN connectivity, graph attention, and weighted cross-entropy loss) to classify the active biochemical limiting state more accurately than conventional baselines, reaching an F1-score of 0.857 and accuracy of 0.882 on synthetic data with known ground truth.
What carries the argument
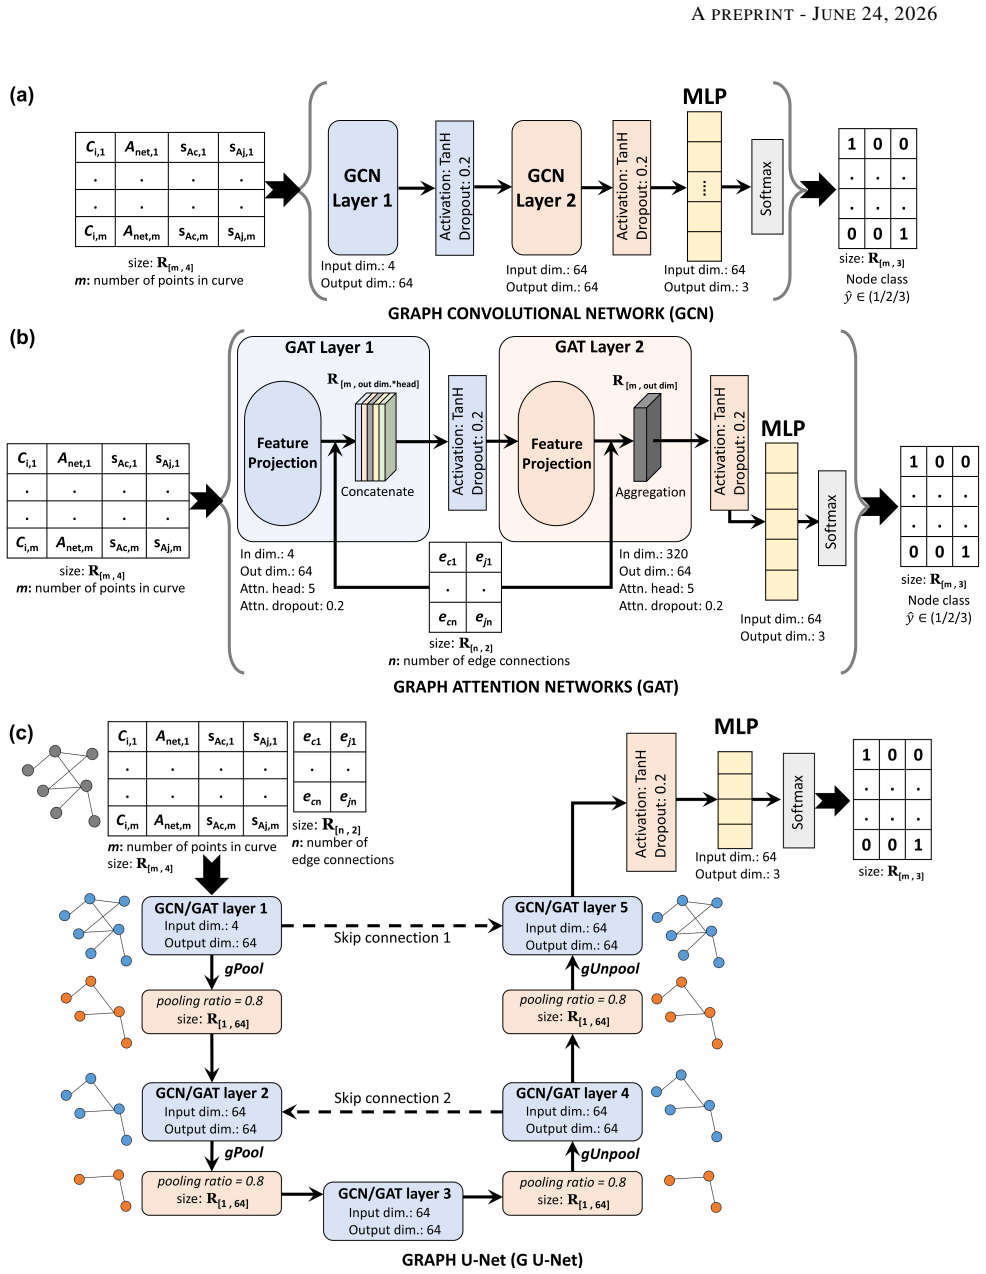
SEAGAN, a graph attention network that combines process-aware node features, edge attributes, kNN connectivity, and a weighted cross-entropy loss to perform node classification on A-Ci curve graphs.
If this is right
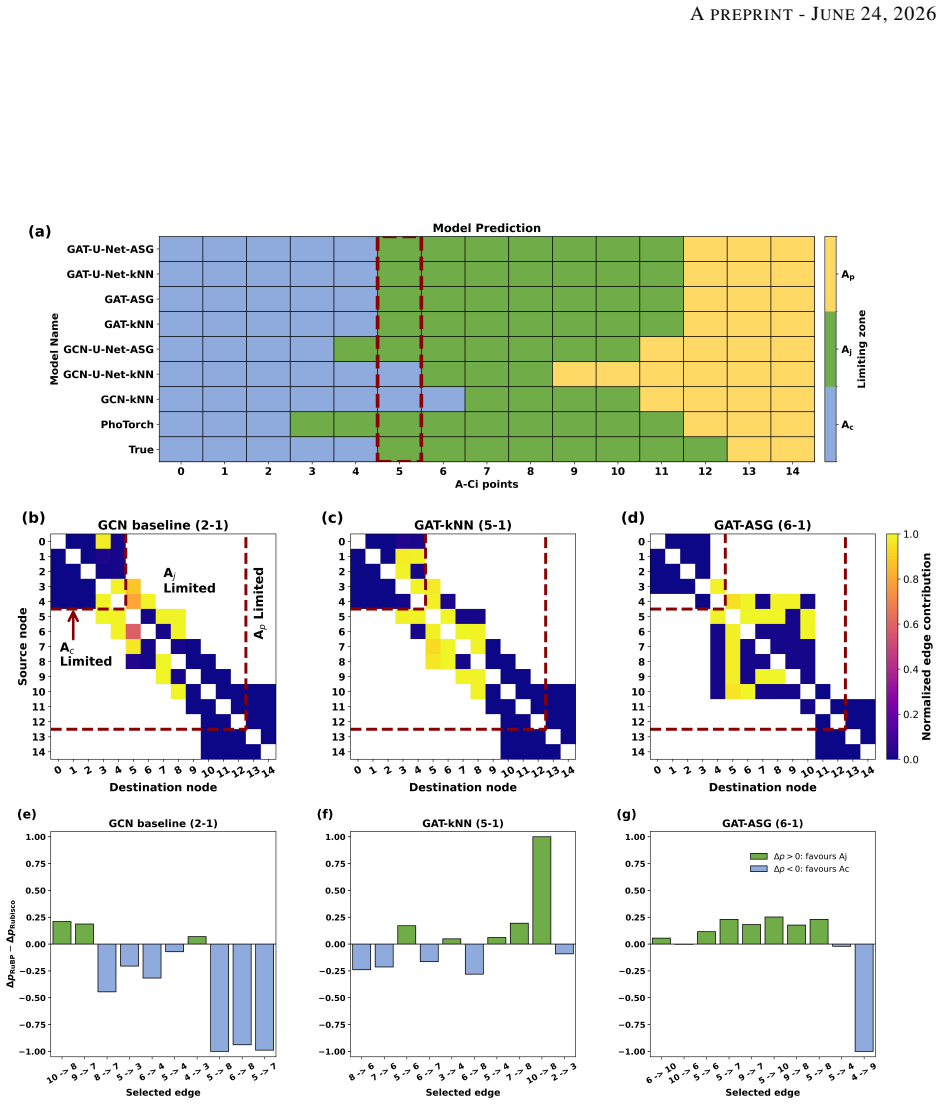
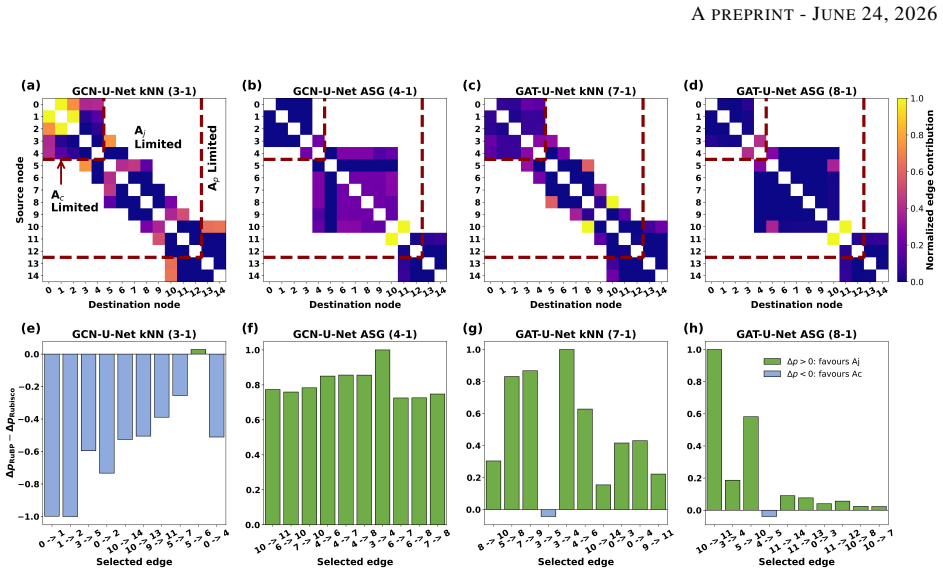
- Graph-based models improve classification accuracy especially near biochemical transition areas.
- Using A-Ci curves as graphs enables better identification of the biochemical limiting condition than standard fitting methods.
- The approach reduces uncertainty associated with both human and automated estimation of photosynthetic parameters.
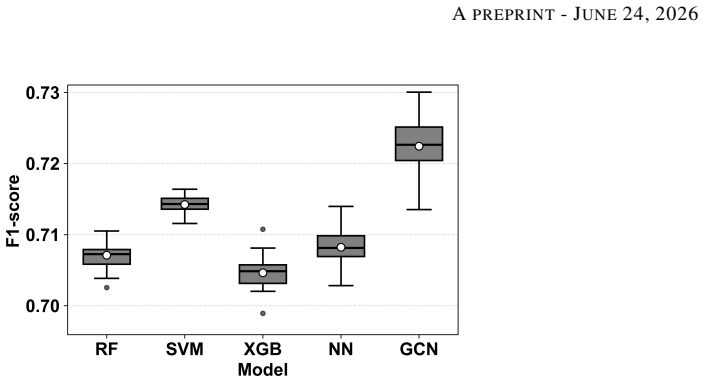
- SEAGAN outperforms conventional machine learning baselines, other graph-based architectures, and an automated fitting-based benchmark.
Where Pith is reading between the lines
- If the accuracy gains observed on synthetic data carry over to real measurements, the method would lower uncertainty in parameter estimates derived from field A-Ci curves.
- The same graph-construction and attention approach could be applied to other plant response curves that involve multiple interacting biochemical processes.
- Integrating the classification output directly into biophysical fitting routines might produce more consistent parameter values across repeated experiments.
Load-bearing premise
The synthetic dataset with known ground-truth limitation states is representative of real experimental A-Ci curves.
What would settle it
Running the trained SEAGAN model on a collection of real measured A-Ci curves and checking whether its predicted limiting states match independent expert classifications or additional experimental validations performed on the same curves.
Figures
read the original abstract
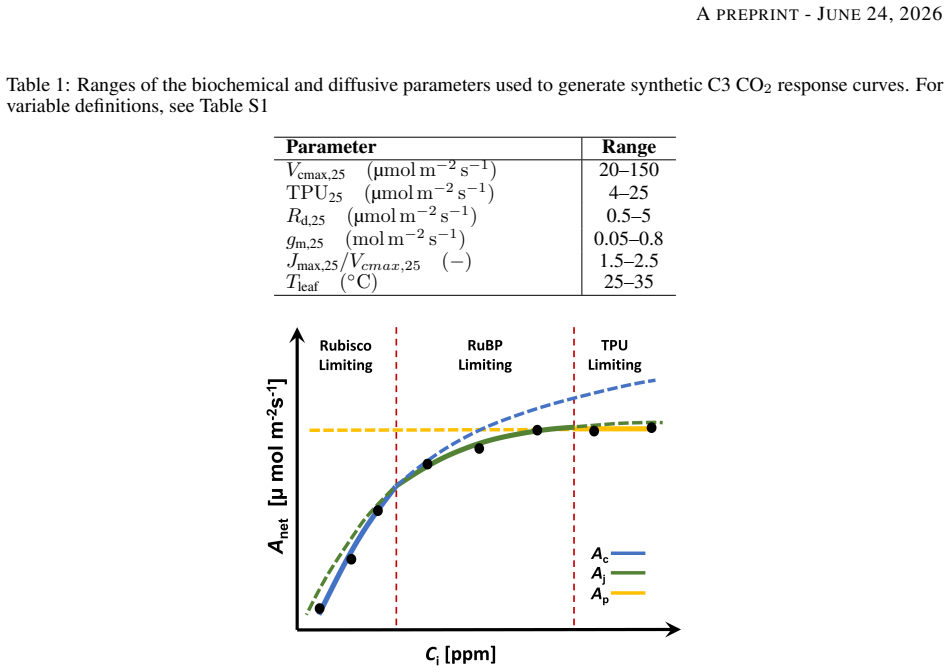
Graph neural networks (GNNs) offer a flexible framework for learning from scientific data with physical, biological, or functional associations. One promising domain is plant physiology, where observed responses result from several interacting processes that are difficult to isolate, even with human intervention. A key example is the A-Ci curve, which relates the net CO2 assimilation rate (Anet) to leaf intercellular CO2 concentration (Ci) and is also used to estimate photosynthetic parameters in biophysical models. However, accurate estimation requires accurate identification of the active biochemical limiting state at each curve point, which is a major source of uncertainty. Here, we express the limitation-state identification in A-Ci curves as a graph-based node classification problem. A graph representation of the A-Ci curve is created using distance-based k-nearest-neighbor (kNN) and auxiliary-signal-guided (ASG) connectivity. The methodology was evaluated against the conventional machine learning baselines, graph-based architectures, and an automated fitting-based benchmark. Results on a large synthetic dataset with known ground-truth limitation states show that graph-based models improve classification, especially near biochemical transition areas. The top-performing configuration, SEAGAN (domain-Specific and Edge-Aware Graph Attention Network for Dynamic Plant Processes), integrates process-aware node features, edge attributes, kNN connectivity, and graph attention with a weighted cross-entropy loss, obtaining an F1-score of 0.857 and accuracy of 0.882. The results suggest that using A-Ci curves as graphs enables better identification of the biochemical limiting condition and reduces the uncertainty associated with both human and automated methods.
Editorial analysis
A structured set of objections, weighed in public.
Referee Report
Summary. The paper frames biochemical limitation-state identification in A-Ci curves as a graph node-classification task. It constructs graphs via kNN and auxiliary-signal-guided connectivity, introduces the SEAGAN architecture that incorporates process-aware node features, edge attributes, and graph attention with weighted cross-entropy loss, and reports an F1-score of 0.857 and accuracy of 0.882 on a large synthetic dataset with known ground-truth labels, outperforming conventional ML baselines, other graph architectures, and an automated fitting benchmark. The abstract concludes that the graph-based approach enables better limitation identification and reduces uncertainty for both human and automated methods.
Significance. If the synthetic-data gains prove robust and transfer to measured curves, the work would provide a concrete, reproducible improvement in a long-standing source of uncertainty in plant-physiology parameter estimation. The explicit use of synthetic data with ground-truth labels is a methodological strength that permits quantitative, falsifiable comparison; the integration of domain-specific features and edge attributes is also a positive design choice.
major comments (2)
- [Abstract] Abstract (final sentence) and evaluation paragraph: the claim that the method 'reduces the uncertainty associated with both human and automated methods' on measured A-Ci curves is unsupported; all reported metrics (F1 0.857, accuracy 0.882) are confined to synthetic data, with no real experimental curves, expert-label cross-validation, or domain-shift experiments described.
- [Abstract] Abstract and evaluation paragraph: no details are supplied on the synthetic-data generation procedure, exact baseline implementations, hyperparameter search protocol, or statistical testing; without these, the quantitative superiority claim cannot be independently verified or reproduced.
minor comments (1)
- [Abstract] The abstract could more explicitly separate the synthetic-data results from the suggested real-world implications to avoid overstatement.
Simulated Author's Rebuttal
We thank the referee for the constructive comments on our manuscript. We address each major point below and will revise the manuscript to strengthen the presentation of results and reproducibility.
read point-by-point responses
-
Referee: [Abstract] Abstract (final sentence) and evaluation paragraph: the claim that the method 'reduces the uncertainty associated with both human and automated methods' on measured A-Ci curves is unsupported; all reported metrics (F1 0.857, accuracy 0.882) are confined to synthetic data, with no real experimental curves, expert-label cross-validation, or domain-shift experiments described.
Authors: We agree that the final sentence of the abstract extrapolates beyond the reported experiments. All quantitative results are obtained on synthetic A-Ci curves with known ground-truth labels; no measured curves, expert annotations, or domain-shift tests are presented. We will revise the abstract and evaluation paragraph to remove the unsupported claim about measured curves and instead state that the synthetic results suggest the graph-based approach may reduce uncertainty, with validation on real data left for future work. revision: yes
-
Referee: [Abstract] Abstract and evaluation paragraph: no details are supplied on the synthetic-data generation procedure, exact baseline implementations, hyperparameter search protocol, or statistical testing; without these, the quantitative superiority claim cannot be independently verified or reproduced.
Authors: The referee is correct that the abstract and evaluation summary omit key methodological details required for independent verification. We will expand the revised manuscript (methods and results sections) with explicit descriptions of the synthetic data generation procedure (Farquhar–von Caemmerer–Berry model with controlled noise and transition points), the precise implementations and hyperparameter ranges for all baselines, the hyperparameter search protocol, and any statistical tests performed. A brief summary of these elements will also be added to the abstract where space permits. revision: yes
Circularity Check
No significant circularity in derivation or results.
full rationale
The paper frames limitation-state identification as a supervised node-classification task on kNN graphs derived from synthetic A-Ci curves that carry independent ground-truth labels. SEAGAN is trained with standard cross-entropy loss and evaluated on held-out synthetic curves; the reported F1 (0.857) and accuracy (0.882) are computed directly against those external labels. No equation, parameter, or self-citation reduces the test metrics to a fitted quantity or renames an input. The suggestion that the method reduces uncertainty on real measured curves is an untested extrapolation, not a circular step inside the paper's own chain.
Axiom & Free-Parameter Ledger
free parameters (2)
- k in kNN and ASG connectivity thresholds
- class weights in weighted cross-entropy loss
axioms (1)
- domain assumption Synthetic A-Ci curves with known ground-truth limitation states are sufficiently representative of real experimental curves for performance evaluation
Reference graph
Works this paper leans on
-
[1]
G. D. Farquhar, S. von Caemmerer, J. A. Berry, A biochemical model of photosynthetic CO 2 assimilation in leaves of C 3 species, Planta 149 (1) (1980) 78–90.doi:10.1007/bf00386231
-
[2]
T. D. Sharkey, C. J. Bernacchi, G. D. Farquhar, E. L. Singsaas, Fitting photosynthetic carbon dioxide response curves for C3 leaves, Plant, Cell & Environment 30 (9) (2007) 1035–1040.doi:10.1111/j.1365-3040.2007.01710.x
-
[3]
A. Srivastava, V . Srinivasan, S. P. Long, Stomatal conductance reduction tradeoffs in maize leaves: A theoretical study, Plant, Cell & Environment 47 (5) (2024) 1716–1731.doi:10.1111/pce.14821
-
[4]
E. B. Lochocki, S. Rohde, D. Jaiswal, M. L. Matthews, F. Miguez, S. P. Long, J. M. McGrath, BioCro II: a software package for modular crop growth simulations, in silico Plants 4 (1) (2022) diac003.doi:10.1093/insilicoplants/diac003
-
[5]
Y . Ma, H. Liu, An Advanced Multiple-Layer Canopy Model in the WRF Model With Large-Eddy Simulations to Simulate Canopy Flows and Scalar Transport Under Different Stability Conditions, Journal of Advances in Modeling Earth Systems 11 (7) (2019) 2330–2351.doi:10.1029/2018MS001347. 21 APREPRINT- JUNE24, 2026
-
[6]
G. B. Bonan, M. Williams, R. A. Fisher, K. W. Oleson, Modeling stomatal conductance in the earth system: Linking leaf water-use efficiency and water transport along the soil-plant-atmosphere continuum, Geoscientific Model Development 7 (2014) 2193–2222.doi:10.5194/gmd-7-2193-2014
-
[7]
L. Gu, S. G. Pallardy, K. Tu, B. E. Law, S. D. Wullschleger, Reliable estimation of biochemical parameters from c3 leaf photosynthesis–intercellular carbon dioxide response curves, Plant, Cell & Environment 33 (11) (2010) 1852–1874. doi:10.1111/j.1365-3040.2010.02192.x
-
[8]
D. P. Moualeu-Ngangue, T.-W. Chen, H. Stützel, A new method to estimate photosynthetic parameters through net assimilation rate-intercellular space Co2 concentration A-Ci curve and chlorophyll fluorescence measurements, New Phytologist 213 (3) (2017) 1543–1554.doi:10.1111/nph.14260
-
[9]
G. J. Collatz, J. T. Ball, C. Grivet, J. A. Berry, Physiological and environmental regulation of stomatal conductance, photosyn- thesis and transpiration: a model that includes a laminar boundary layer, Agricultural and Forest meteorology 54 (2-4) (1991) 107–136.doi:10.1016/0168-1923(91)90002-8
-
[10]
von Caemmerer, Biochemical models of leaf photosynthesis, Techniques in plant sciences, CSIRO, 2000
S. von Caemmerer, Biochemical models of leaf photosynthesis, Techniques in plant sciences, CSIRO, 2000. doi:10.1071/ 9780643103405
2000
-
[11]
S. P. Long, C. J. Bernacchi, Gas exchange measurements, what can they tell us about the underlying limitations to photosynthe- sis? procedures and sources of error, Journal of Experimental Botany 54 (392) (2003) 2393–2401.doi:10.1093/jxb/erg262
-
[12]
T. Lei, K. T. Rizzo, B. N. Bailey, PhoTorch: a robust and generalized biochemical photosynthesis model fitting package based on PyTorch, Photosynthesis Research 163 (21) (2025).doi:10.1007/s11120-025-01136-7
-
[13]
J.-J. B. Dubois, E. L. Fiscus, F. L. Booker, M. D. Flowers, C. D. Reid, Optimizing the statistical estimation of the parameters of the farquhar–von caemmerer–berry model of photosynthesis, New Phytologist 176 (2) (2007) 402–414. doi:10.1111/j. 1469-8137.2007.02182.x
work page doi:10.1111/j 2007
-
[14]
E. B. Lochocki, C. E. Salesse-Smith, J. M. McGrath, PhotoGEA: An R Package for Closer Fitting of Photosynthetic Gas Exchange Data With Non-Gaussian Confidence Interval Estimation, Plant, Cell & Environment 48 (7) (2025) 5104–5119. doi:10.1111/pce.15501
-
[15]
R. T. Furbank, M. Tester, Phenomics–technologies to relieve the phenotyping bottleneck, Trends in Plant Science 16 (12) (2011) 635–644.doi:10.1016/j.tplants.2011.09.005
-
[16]
R. A. Duursma, Plantecophys - An R Package for Analysing and Modelling Leaf Gas Exchange Data, PLOS ONE 10 (11) (2015) 1–13.doi:10.1371/journal.pone.0143346
-
[17]
L. M. Gregory, A. M. McClain, D. M. Kramer, J. D. Pardo, K. E. Smith, O. L. Tessmer, B. J. Walker, L. G. Ziccardi, T. D. Sharkey, The triose phosphate utilization limitation of photosynthetic rate: Out of global models but important for leaf models, Plant, Cell & Environment 44 (10) (2021) 3223–3226.doi:10.1111/pce.14153
-
[18]
J. You, X. Li, M. Low, D. Lobell, S. Ermon, Deep gaussian process for crop yield prediction based on remote sensing data, Proceedings of the AAAI Conference on Artificial Intelligence 31 (1) (2017).doi:10.1609/aaai.v31i1.11172
-
[19]
P. Nevavuori, N. Narra, T. Lipping, Crop yield prediction with deep convolutional neural networks, Computers and Electronics in Agriculture 163 (2019) 104859.doi:10.1016/j.compag.2019.104859
-
[20]
L. G. Riera, M. E. Carroll, Z. Zhang, J. M. Shook, S. Ghosal, T. Gao, A. Singh, S. Bhattacharya, B. Ganapathysubramanian, A. K. Singh, S. Sarkar, Deep multiview image fusion for soybean yield estimation in breeding applications, Plant Phenomics 2021 (2021) 9846470.doi:10.34133/2021/9846470
-
[21]
Z. Li, Z. Chen, Q. Cheng, F. Duan, R. Sui, X. Huang, H. Xu, UA V-based hyperspectral and ensemble machine learning for predicting yield in winter wheat, Agronomy 12 (1) (2022) 202.doi:10.3390/agronomy12010202
- [22]
-
[23]
J. Shook, T. Gangopadhyay, L. Wu, B. Ganapathysubramanian, S. Sarkar, A. K. Singh, Crop yield prediction integrating genotype and weather variables using deep learning, PLOS ONE 16 (6) (2021) 1–19.doi:10.1371/journal.pone.0252402
-
[24]
J. Zhou, G. Cui, S. Hu, Z. Zhang, C. Yang, Z. Liu, L. Wang, C. Li, M. Sun, Graph neural networks: A review of methods and applications, AI Open 1 (2020) 57–81.doi:10.1016/j.aiopen.2021.01.001
-
[25]
Z. Wu, S. Pan, F. Chen, G. Long, C. Zhang, P. S. Yu, A comprehensive survey on graph neural networks, IEEE Transactions on Neural Networks and Learning Systems 32 (1) (2021) 4–24.doi:10.1109/TNNLS.2020.2978386
-
[26]
IEEE Transactions on Neural Networks20(1), 61–80 (2008)
F. Scarselli, M. Gori, A. C. Tsoi, M. Hagenbuchner, G. Monfardini, The graph neural network model, IEEE Transactions on Neural Networks 20 (1) (2009) 61–80.doi:10.1109/TNN.2008.2005605
-
[28]
P. W. Battaglia, J. B. Hamrick, V . Bapst, A. Sanchez-Gonzalez, V . Zambaldi, M. Malinowski, A. Tacchetti, D. Raposo, A. Santoro, R. Faulkner, C. Gulcehre, F. Song, A. Ballard, J. Gilmer, G. Dahl, A. Vaswani, K. Allen, C. Nash, V . Langston, C. Dyer, N. Heess, D. Wierstra, P. Kohli, M. Botvinick, O. Vinyals, Y . Li, R. Pascanu, Relational inductive biases...
work page internal anchor Pith review Pith/arXiv arXiv doi:10.48550/arxiv.2104.13478 2018
-
[29]
Sanchez-Gonzalez, J
A. Sanchez-Gonzalez, J. Godwin, T. Pfaff, R. Ying, J. Leskovec, P. W. Battaglia, Learning to simulate complex physics with graph networks, in: Proceedings of the 37th International Conference on Machine Learning, ICML’20, JMLR.org, 2020. URLhttps://proceedings.mlr.press/v119/sanchez-gonzalez20a.html
2020
-
[30]
J. Fan, J. Bai, Z. Li, A. Ortiz-Bobea, C. P. Gomes, A GNN-RNN Approach for Harnessing Geospatial and Temporal Information: Application to Crop Yield Prediction, Proceedings of the AAAI Conference on Artificial Intelligence 36 (11) (2022) 11873–11881.doi:10.1609/aaai.v36i11.21444
-
[31]
P. Sajitha, A. Diana Andrushia, N. Mostafa, A. Younes Shdefat, S. Suni, N. Anand, Smart farming application using knowledge embedded-graph convolutional neural network (KEGCNN) for banana quality detection, Journal of Agriculture and Food Research 14 (2023) 100767.doi:10.1016/j.jafr.2023.100767
-
[32]
A. Gupta, A. Singh, Agri-gnn: A novel genotypic-topological graph neural network framework built on graphsage for optimized yield prediction (2023).doi:10.48550/arXiv.2310.13037
-
[33]
C. I. Kanatsoulis, A. Ribeiro, Graph neural networks are more powerful than we think, in: ICASSP 2024 - 2024 IEEE International Conference on Acoustics, Speech and Signal Processing (ICASSP), 2024, pp. 7550–7554. doi:10.1109/ ICASSP48485.2024.10447704
arXiv 2024
-
[34]
K. Xu, W. Hu, J. Leskovec, S. Jegelka, How Powerful are Graph Neural Networks?, arXiv preprint (2018).arXiv:1810.00826, doi:10.48550/arXiv.1810.00826
work page internal anchor Pith review Pith/arXiv arXiv doi:10.48550/arxiv.1810.00826 2018
-
[35]
Deep learning.Nature, 521(7553):436– 444, 2015
Y . LeCun, Y . Bengio, G. Hinton, Deep learning, Nature 521 (7553) (2015) 436–444.doi:10.1038/nature14539
-
[36]
T. N. Kipf, M. Welling, Semi-supervised classification with graph convolutional networks, in: 5th International Conference on Learning Representations, ICLR 2017, 2017. URLhttps://openreview.net/forum?id=SJU4ayYgl
2017
-
[37]
Veliˇckovi´c, G
P. Veliˇckovi´c, G. Cucurull, A. Casanova, A. Romero, P. Liò, Y . Bengio, Graph attention networks, in: Proceedings of the 6th International Conference on Learning Representations (ICLR 2018), OpenReview.net, Vancouver, BC, Canada, 2018, conference Track Proceedings, April 30–May 3, 2018. URLhttps://openreview.net/forum?id=rJXMpikCZ
2018
-
[38]
H. Gao, S. Ji, Graph U-Nets, in: K. Chaudhuri, R. Salakhutdinov (Eds.), Proceedings of the 36th International Conference on Machine Learning, V ol. 97 of Proceedings of Machine Learning Research, PMLR, 2019, pp. 2083–2092. URLhttps://proceedings.mlr.press/v97/gao19a.html
2019
-
[39]
W. L. Hamilton, R. Ying, J. Leskovec, Inductive representation learning on large graphs, in: Proceedings of the 31st International Conference on Neural Information Processing Systems, NIPS’17, Curran Associates Inc., Red Hook, NY , USA, 2017, p. 1025–1035. URL https://papers.nips.cc/paper_files/paper/2017/hash/5dd9db5e033da9c6fb5ba83c7a7ebea9-Abstract. html
2017
-
[40]
H. Zhou, E. Akçay, B. R. Helliker, Estimating C4 photosynthesis parameters by fitting intensive A/Ci curves, Photosynthesis Research 141 (2) (2019) 181–194.doi:10.1007/s11120-019-00619-8
-
[41]
M. D. McKay, R. J. Beckman, W. J. Conover, A comparison of three methods for selecting values of input variables in the analysis of output from a computer code, Technometrics 21 (2) (1979) 239–245.doi:10.2307/1268522
-
[42]
P. C. Harley, R. B. Thomas, J. F. Reynolds, B. R. Strain, Modelling photosynthesis of cotton grown in elevated CO2, Plant, Cell & Environment 15 (3) (1992) 271–282.doi:10.1111/j.1365-3040.1992.tb00974.x
-
[43]
C. J. Bernacchi, E. L. Singsaas, C. Pimentel, A. R. Portis Jr, S. P. Long, Improved temperature response functions for models of rubisco-limited photosynthesis, Plant, Cell & Environment 24 (2) (2001) 253–259. doi:10.1111/j.1365-3040.2001. 00668.x
-
[44]
C. J. Bernacchi, A. R. Portis, H. Nakano, S. von Caemmerer, S. P. Long, Temperature response of mesophyll conductance. implications for the determination of rubisco enzyme kinetics and for limitations to photosynthesis in vivo, Plant Physiology 130 (4) (2002) 1992–1998.doi:10.1104/pp.008250
-
[45]
C. J. Bernacchi, C. Pimentel, S. P. Long, In vivo temperature response functions of parameters required to model RuBP-limited photosynthesis, Plant, Cell & Environment 26 (9) (2003) 1419–1430.doi:10.1046/j.0016-8025.2003.01050.x
-
[46]
L. Breiman, Random forests, Machine Learning 45 (1) (2001) 5–32.doi:10.1023/A:1010933404324
-
[47]
C. Cortes, V . Vapnik, Support-vector networks, Machine Learning 20 (3) (1995) 273–297.doi:10.1007/BF00994018
-
[48]
T. Chen, C. Guestrin, XGBoost: A Scalable Tree Boosting System, in: Proceedings of the 22nd ACM SIGKDD International Conference on Knowledge Discovery and Data Mining, KDD ’16, Association for Computing Machinery, New York, NY , USA, 2016, p. 785–794.doi:10.1145/2939672.2939785
-
[49]
M. Fey, J. E. Lenssen, Fast graph representation learning with PyTorch Geometric, in: ICLR Workshop on Representation Learning on Graphs and Manifolds, 2019. URLhttps://arxiv.org/abs/1903.02428
Pith/arXiv arXiv 2019
-
[50]
S. Kar, J. R. McKenna, V . Sunkara, R. Coniglione, S. Stanic, L. Bernard, XWaveNet: Enabling uncertainty quantification in short-term ocean wave height forecasts and extreme event prediction, Applied Ocean Research 148 (2024) 103994. doi:10.1016/j.apor.2024.103994. 23 APREPRINT- JUNE24, 2026
-
[51]
Srivastava, G
N. Srivastava, G. Hinton, A. Krizhevsky, I. Sutskever, R. Salakhutdinov, Dropout: A simple way to prevent neural networks from overfitting, Journal of Machine Learning Research 15 (56) (2014) 1929–1958. URLhttp://jmlr.org/papers/v15/srivastava14a.html
2014
-
[52]
C. Elkan, The foundations of cost-sensitive learning, in: Proceedings of the 17th International Joint Conference on Artificial Intelligence - V olume 2, IJCAI’01, Morgan Kaufmann Publishers Inc., San Francisco, CA, USA, 2001, p. 973–978. URLhttps://dl.acm.org/doi/10.5555/1642194.1642224
-
[53]
H. He, E. A. Garcia, Learning from imbalanced data, IEEE Transactions on Knowledge and Data Engineering 21 (9) (2009) 1263–1284.doi:10.1109/TKDE.2008.239
-
[54]
T. Lin, P. Goyal, R. Girshick, K. He, P. Dollár, Focal loss for dense object detection, in: Proceedings of the IEEE International Conference on Computer Vision (ICCV), 2017, pp. 2999–3007.doi:10.1109/ICCV.2017.324
-
[55]
G. Forman, M. Scholz, Apples-to-apples in cross-validation studies: pitfalls in classifier performance measurement, SIGKDD Explor. Newsl. 12 (1) (2010) 49–57.doi:10.1145/1882471.1882479
-
[56]
R. Ying, D. Bourgeois, J. You, M. Zitnik, J. Leskovec, GNNExplainer: Generating explanations for graph neural networks, in: Advances in Neural Information Processing Systems, V ol. 32, 2019, pp. 9240–9251. URL https://papers.nips.cc/paper_files/paper/2019/hash/d80b7040b773199015de6d3b4293c8ff-Abstract. html
2019
-
[57]
R. A. Fisher, Statistical Methods for Research Workers, Springer, New York, 1992.doi:10.1007/978-1-4612-4380-9_6
-
[58]
J. W. Tukey, Comparing individual means in the analysis of variance, Biometrics 5 (2) (1949) 99–114.doi:10.2307/3001913
-
[59]
S. Kar, R. Tanaka, L. B. Korbu, J. Kholová, H. Iwata, S. S. Durbha, J. Adinarayana, V . Vadez, Automated discretization of ‘transpiration restriction to increasing vpd’ features from outdoors high-throughput phenotyping data, Plant Methods 16 (1) (2020) 140.doi:10.1186/s13007-020-00680-8. 24 APREPRINT- JUNE24, 2026 S1 Supplementary Material Table S1: Summ...
discussion (0)
Sign in with ORCID, Apple, or X to comment. Anyone can read and Pith papers without signing in.