Curvature-aware 3D length estimation of greenhouse cucumbers using RGB-D imaging and cubic spline arc-length integration
Pith reviewed 2026-06-26 10:58 UTC · model grok-4.3
The pith
Cubic spline fitted to the 3D medial axis estimates cucumber length with 4.13% MAPE.
A machine-rendered reading of the paper's core claim, the machinery that carries it, and where it could break.
Core claim
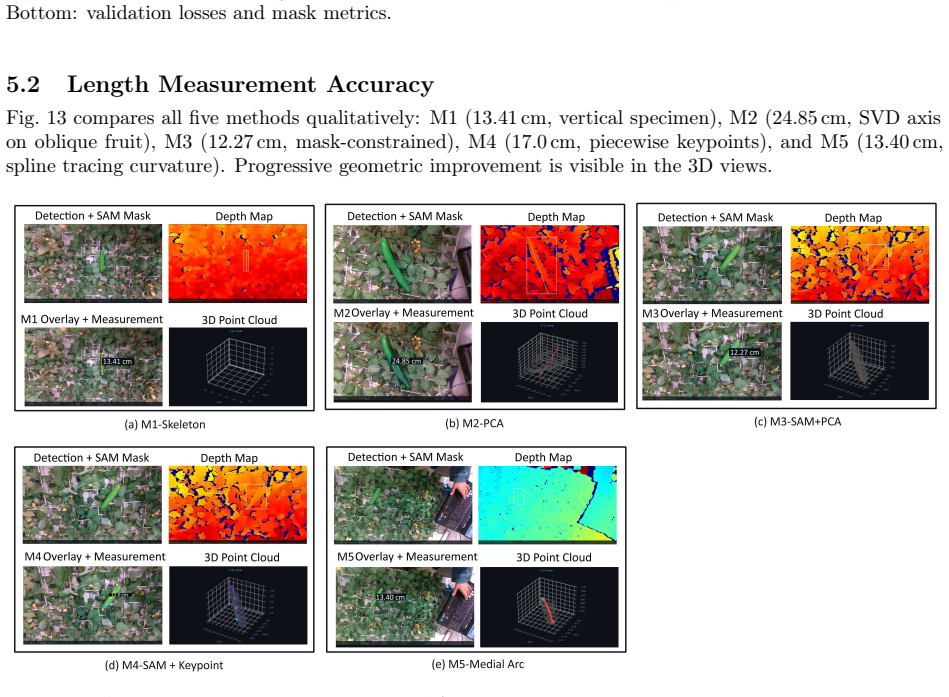
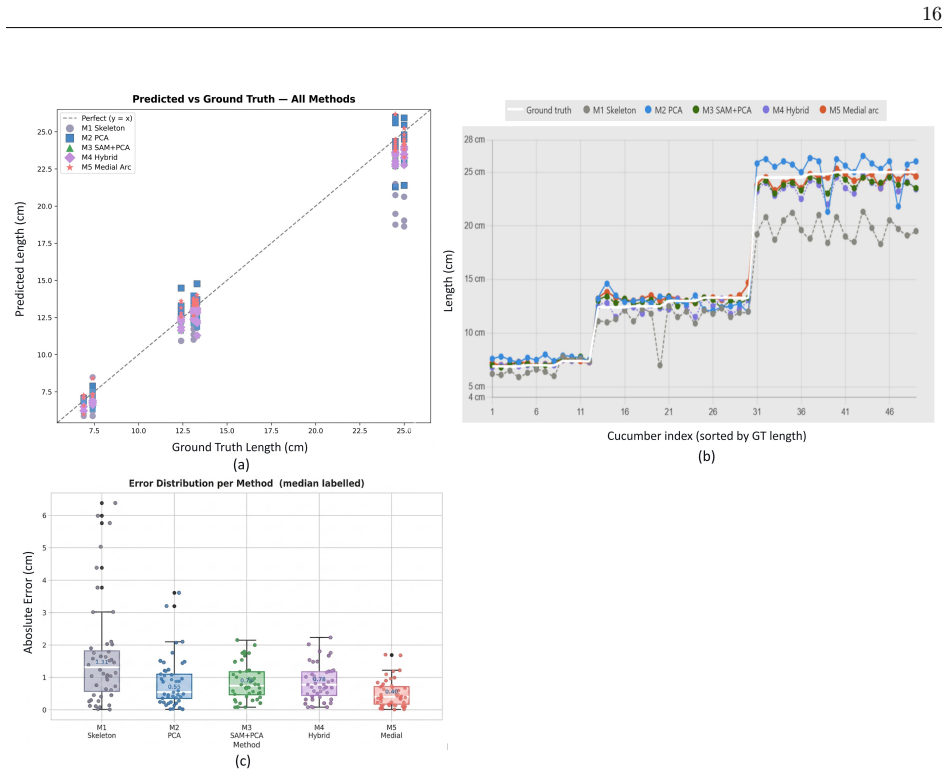
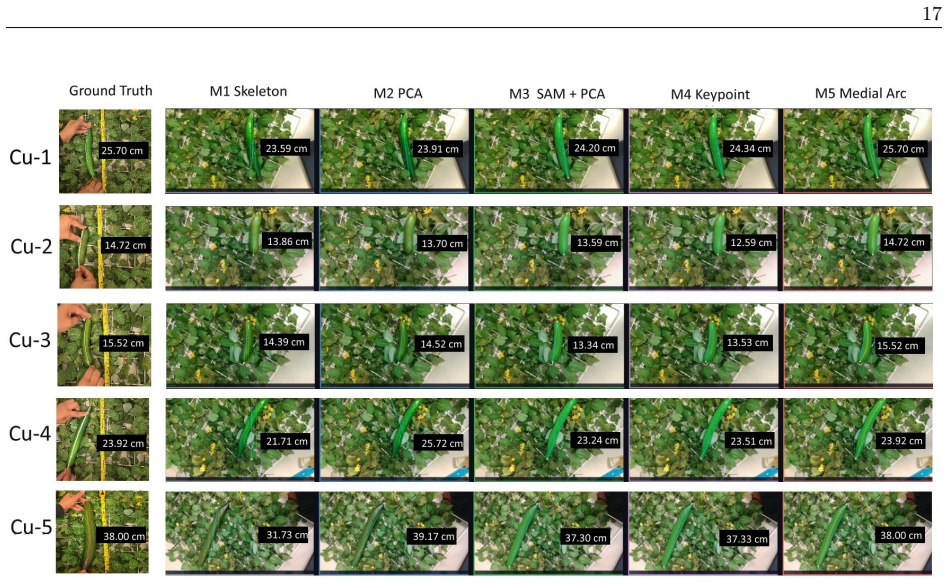
The novel medial arc spline method fits a cubic spline through the 3D medial axis of the SAM-refined mask and computes arc length by trapezoidal integration, delivering 4.13% MAPE on the benchmark and statistically outperforming the dominant-axis, PCA, medial-axis skeleton, and keypoint-guided baselines.
What carries the argument
Medial arc spline: cubic spline fitted to the 3D medial-axis points extracted from the instance mask, with length obtained by numerical integration of the resulting curve.
If this is right
- Greenhouse operations can replace manual length checks for harvest scheduling, labour planning, and grading.
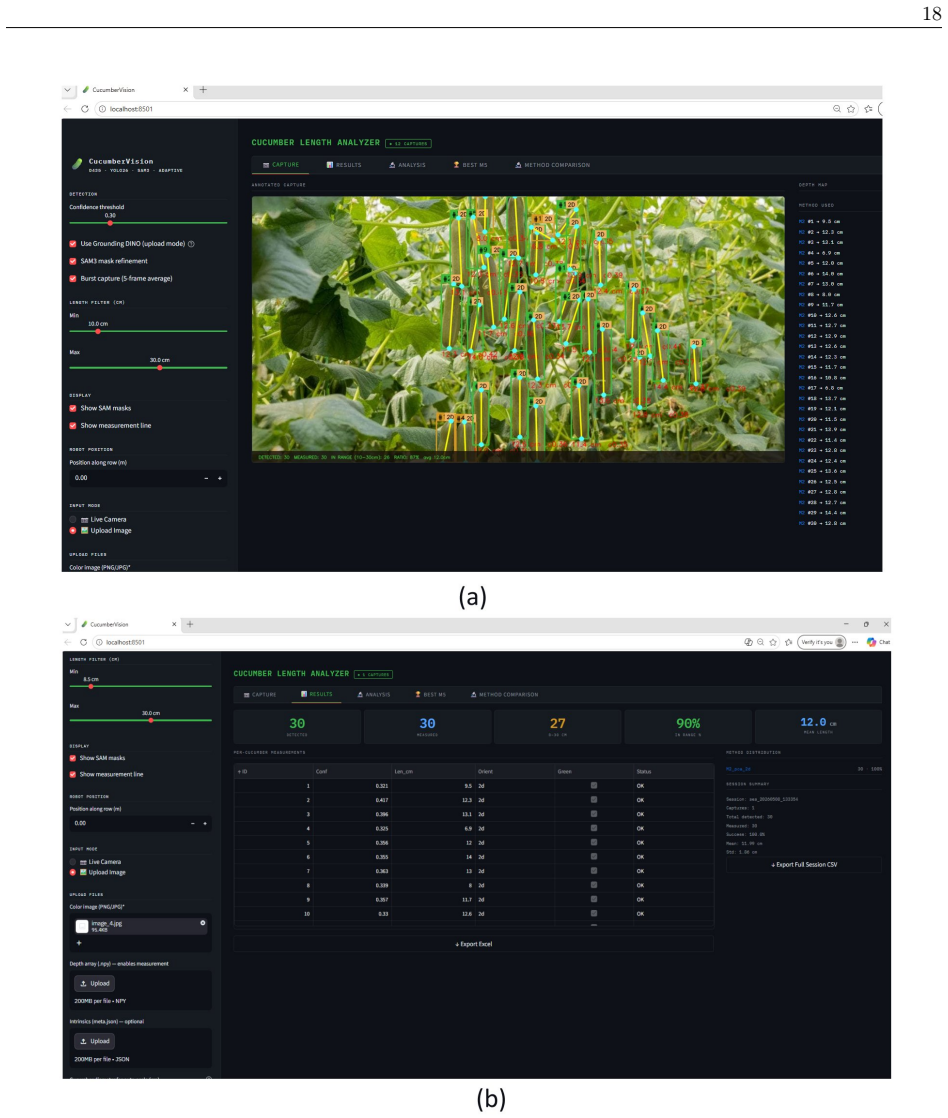
- The pipeline achieves real-time performance with 100% coverage through adaptive method selection on a single consumer GPU.
- Any RGB-D pipeline using rs.align to colour stream must correct for the 12-18% length underestimation caused by mismatched intrinsics.
Where Pith is reading between the lines
- The same spline integration on medial axes could be tested on other elongated curved produce such as zucchini or peppers.
- Adding a larger and more diverse capture set would test whether the reported accuracy hierarchy holds outside the original seven fruits.
- The length estimates could feed directly into robotic harvester control loops for automated picking decisions.
Load-bearing premise
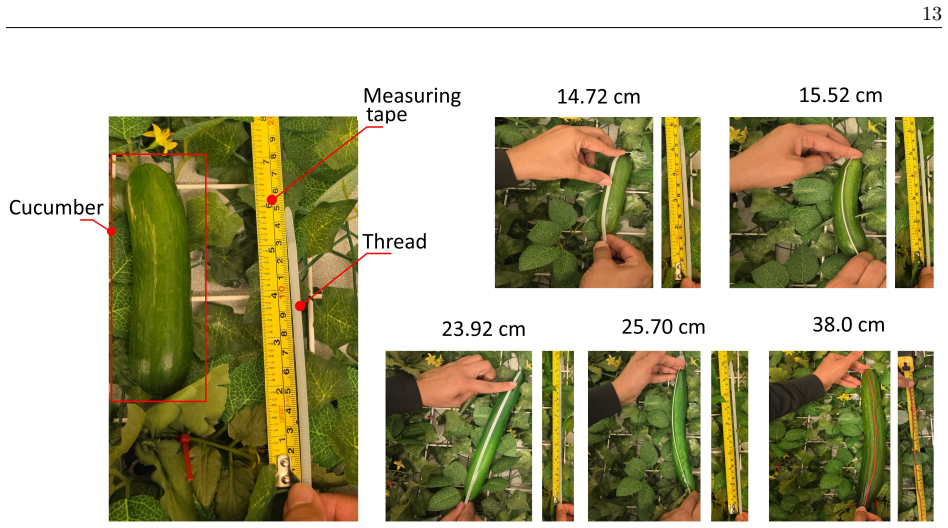
Thread-based ground-truth lengths are accurate and the 48 captures from seven cucumbers in three size classes represent the shape variation and imaging conditions of commercial greenhouse production.
What would settle it
A new benchmark on at least 50 additional cucumbers under varied greenhouse lighting and camera distances that shows the medial arc spline no longer achieves the lowest MAPE or loses statistical significance against the other methods.
Figures

read the original abstract
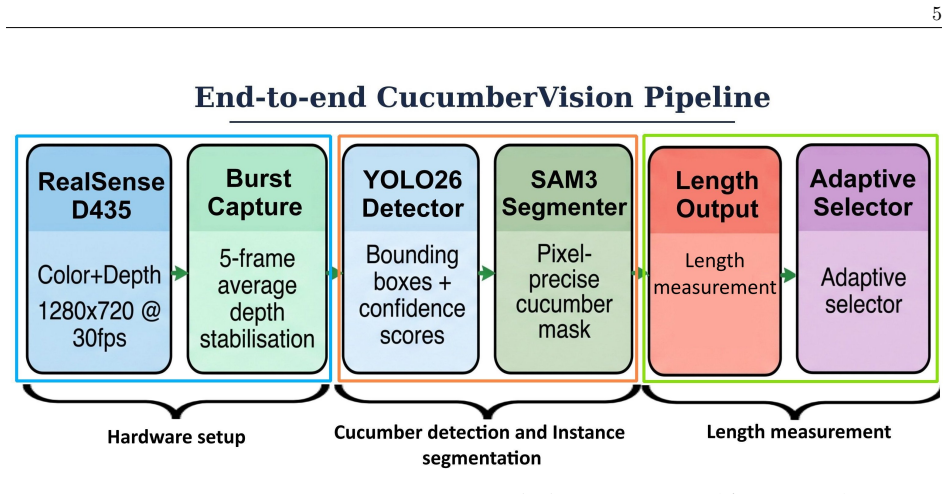
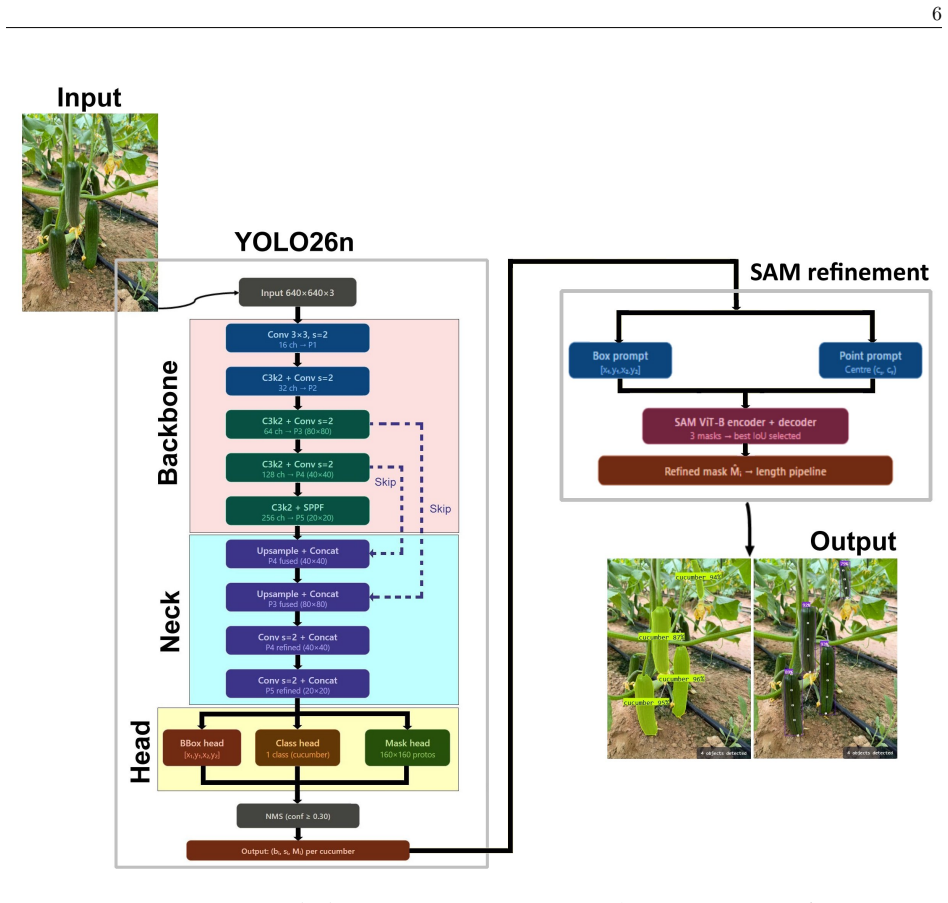
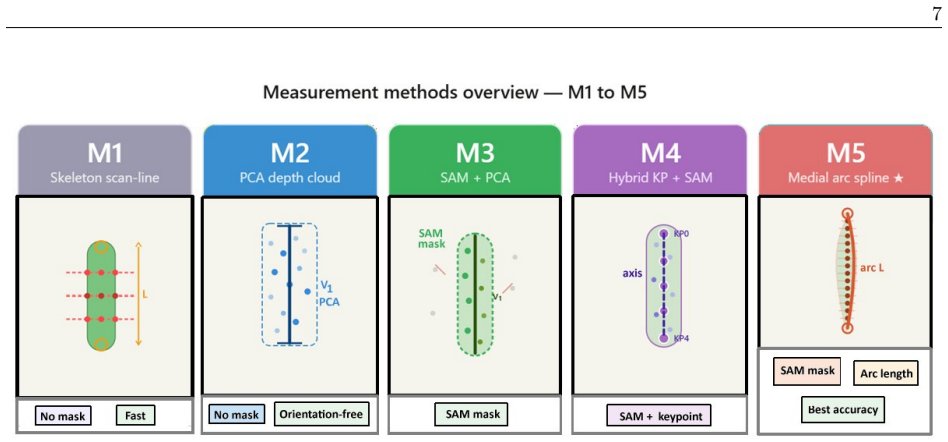
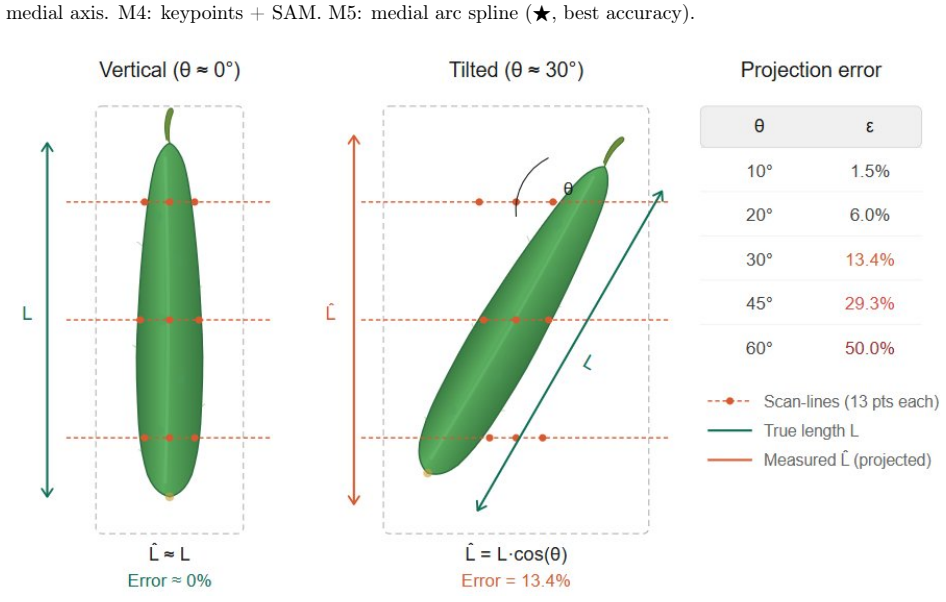
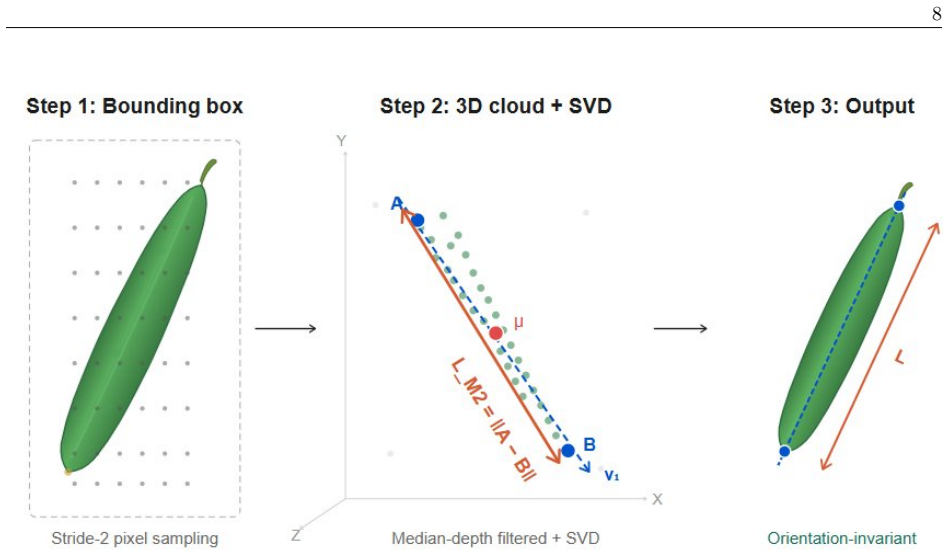
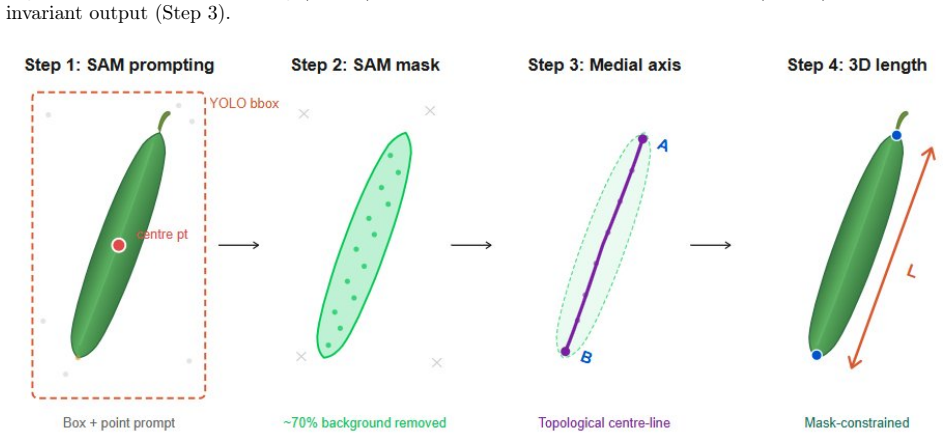
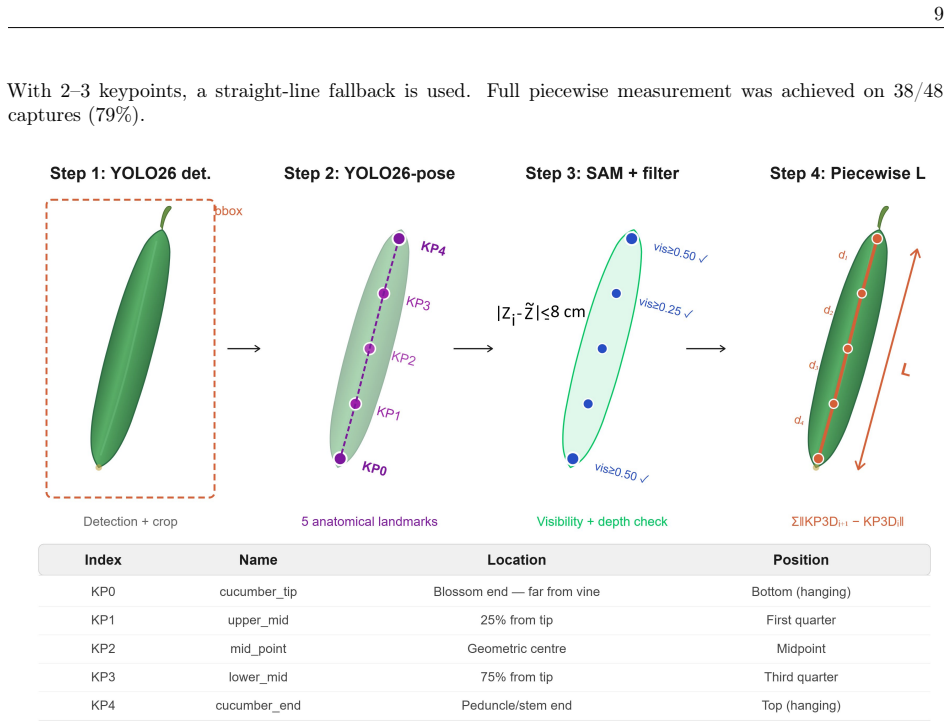
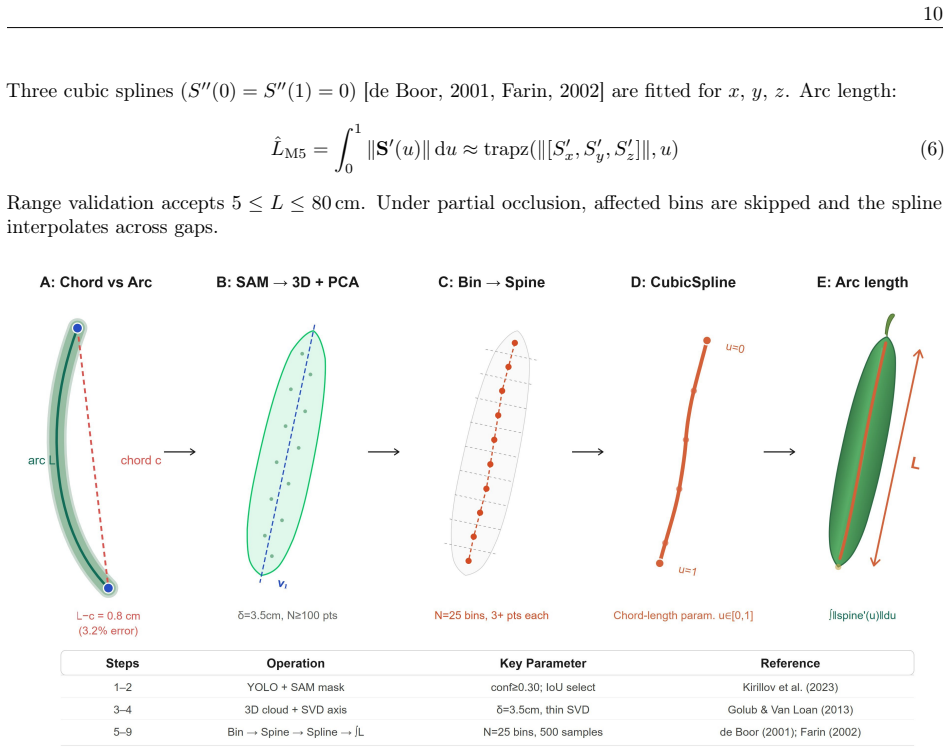
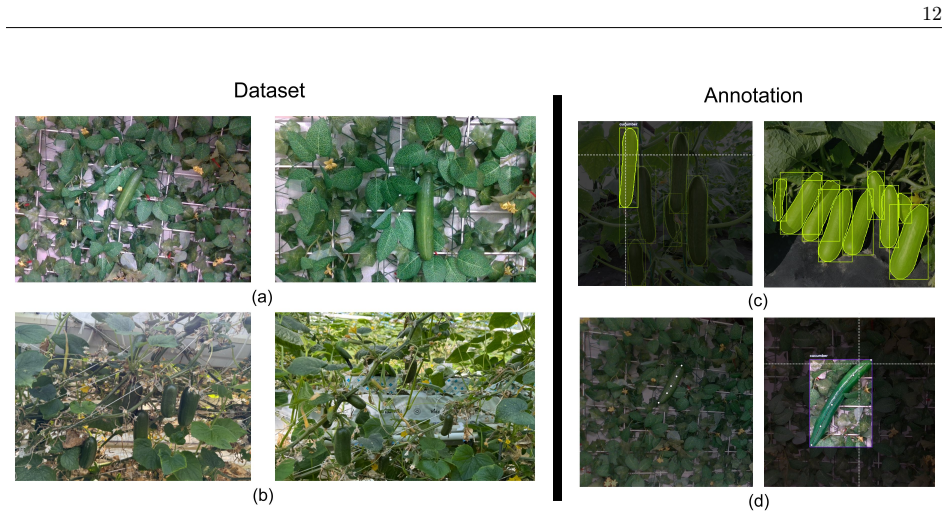
Commercial greenhouse cucumber production is graded by fruit length, which drives harvest scheduling, labour allocation, and logistics. Manual measurement with thread or caliper is accurate but infeasible at commercial scale. This paper presents CucumberVision, a non-contact length estimation framework using an Intel RealSense D435 RGB-D camera. A YOLO26n instance segmentation model locates cucumbers, and SAM (ViT-B backbone) refines each detection to a pixel-precise mask. Five methods are evaluated under matched conditions: (M1) a dominant-axis skeleton scan-line baseline; (M2) PCA on the bounding-box depth point cloud; (M3) SAM mask with medial-axis skeletonisation; (M4) a hybrid keypoint-guided approach using a YOLO26-pose model predicting five anatomical landmarks (KP0--KP4) with piecewise 3D arc-length; and (M5) a novel medial arc spline method fitting a cubic spline through the 3D medial axis of the SAM mask and computing arc length by trapezoidal integration -- the first such application to elongated vegetable measurement. All methods share five-frame burst depth averaging, colour-stream intrinsic alignment, and adaptive method selection with cascading fallbacks ensuring 100% coverage. A benchmark of 48 captures across seven cucumbers in three size categories (small ~8 cm, medium ~13 cm, large ~25 cm) with thread-based ground truth establishes a significant accuracy hierarchy: M1 (MAPE 9.68%) > M2 (5.31%) > M4 (5.51%) > M3 (5.82%) > M5 (4.13%). M5 significantly outperforms all competitors at Bonferroni-corrected alpha=0.0125. A secondary contribution is identifying a 12--18% length underestimation caused by using depth-stream rather than colour-stream intrinsics after rs.align(rs.stream.color) -- an under-reported error source. The complete system is released open source and runs in real time on a single consumer-grade GPU.
Editorial analysis
A structured set of objections, weighed in public.
Referee Report
Summary. The paper introduces CucumberVision, a non-contact RGB-D framework for estimating greenhouse cucumber lengths. It combines YOLO26n instance segmentation with SAM mask refinement, then evaluates five 3D length methods on matched data: a skeleton scan-line baseline (M1), PCA on depth point clouds (M2), medial-axis skeletonisation (M3), keypoint-guided piecewise arcs (M4), and a novel cubic-spline fit to the 3D medial axis with trapezoidal arc-length integration (M5). All methods use five-frame depth averaging and adaptive fallbacks. On a benchmark of 48 captures from seven cucumbers (three size classes) with thread ground truth, the paper reports MAPE values establishing the hierarchy M5 (4.13%) best, followed by M2, M4, M3, M1, with M5 significantly outperforming the others at Bonferroni-corrected α=0.0125. A secondary finding is 12–18% underestimation when using depth rather than colour intrinsics after alignment. The full system is released open-source and runs in real time.
Significance. If the reported accuracy ordering holds after statistical correction, the work offers a practical, scalable alternative to manual thread or caliper measurement for commercial cucumber grading. The open-source release, real-time performance on consumer GPUs, and explicit identification of the intrinsics mismatch constitute clear strengths that increase the manuscript’s utility to the RGB-D and agricultural-vision communities.
major comments (1)
- [Results section (statistical comparison)] Results section (statistical comparison of the five methods): The claim that M5 significantly outperforms all competitors at Bonferroni-corrected α=0.0125 is based on treating the 48 captures as independent observations. With only seven cucumbers and multiple captures per fruit, the data constitute repeated measures; standard pairwise or ANOVA tests underlying the Bonferroni adjustment assume independence. Correlated errors within each cucumber (shared geometry and sensor pose) reduce effective degrees of freedom and can produce anti-conservative p-values, directly undermining the reported significance hierarchy.
minor comments (1)
- [Abstract] Abstract: The listed accuracy hierarchy “M1 (MAPE 9.68%) > M2 (5.31%) > M4 (5.51%) > M3 (5.82%) > M5 (4.13%)” does not match the numerical order of the MAPE values; M2 (5.31%) is better than M4 (5.51%), yet the inequality symbols suggest the opposite ordering. Clarify whether the symbols denote error magnitude or method ranking.
Simulated Author's Rebuttal
We thank the referee for the constructive comment on the statistical comparison. We agree that the repeated-measures structure (multiple captures per cucumber) violates the independence assumption of the original tests and will revise the analysis accordingly.
read point-by-point responses
-
Referee: Results section (statistical comparison of the five methods): The claim that M5 significantly outperforms all competitors at Bonferroni-corrected α=0.0125 is based on treating the 48 captures as independent observations. With only seven cucumbers and multiple captures per fruit, the data constitute repeated measures; standard pairwise or ANOVA tests underlying the Bonferroni adjustment assume independence. Correlated errors within each cucumber (shared geometry and sensor pose) reduce effective degrees of freedom and can produce anti-conservative p-values, directly undermining the reported significance hierarchy.
Authors: We fully agree that the 48 captures are repeated measures on only seven cucumbers and that the original pairwise tests (with Bonferroni correction) assume independence, which is not met. This is a valid concern that can inflate significance. We will revise the manuscript by (i) computing per-cucumber mean errors, (ii) applying a linear mixed-effects model with cucumber identity as a random effect and method as a fixed effect, and (iii) reporting the resulting p-values and effect sizes. The revised results section will qualify or remove the original significance claim if it does not hold under the mixed model. The open-source code will be updated to include the new analysis script. revision: yes
Circularity Check
No circularity: empirical comparison to external thread ground truth
full rationale
The paper describes five length-estimation pipelines (M1–M5) and reports their MAPE on 48 RGB-D captures against independent thread measurements. No derivation, formula, or 'prediction' is presented whose output is algebraically identical to its inputs by construction. M5 is defined as cubic-spline arc-length integration on the medial axis; this is a standard numerical procedure, not a self-referential fit. The accuracy hierarchy is obtained by direct measurement against external ground truth, not by renaming or re-fitting quantities already present in the model equations. No self-citations are invoked as load-bearing uniqueness theorems. The statistical-independence concern raised by the skeptic is a question of experimental design validity, not a circularity in the derivation chain.
Axiom & Free-Parameter Ledger
axioms (2)
- domain assumption The 3D medial axis computed from the SAM mask accurately traces the central curve of the cucumber
- domain assumption Thread-based manual measurements constitute error-free ground truth
Reference graph
Works this paper leans on
-
[1]
doi:10.3390/agronomy11091780. S. Rijal, S. Pokhrel, M. Om, and V. Ojha. Comparing depth estimation of Azure Kinect and RealSense D435i cameras. InProceedings of the Ninth International Congress on Information and Communication Technology (ICICT), pages 491–500. Springer,
-
[2]
doi:10.1007/978-981-97-3588-4_42. W. Wang and C. Li. Size estimation of sweet onions using consumer-grade RGB-depth sensor.Journal of Food Engineering, 142:153–162,
-
[3]
doi:10.1016/j.jfoodeng.2014.06.019. Z. Chen, Z. Wang, X. Li, J. Zhao, and W. Zhou. Vegetable size measurement based on stereo camera and keypoints detection.Sensors, 22(4):1617,
-
[4]
doi:10.3390/s22041617. 20 A. Patel, Z. Liu, Y. Zhang, and W. Chen. Automated measurement of field crop phenotypic traits us- ing UAV 3D point clouds and an improved PointNet++.Frontiers in Plant Science, 16:1654232,
-
[5]
doi:10.3389/fpls.2025.1654232. A. Kirillov, E. Mintun, N. Ravi, H. Mao, C. Rolland, L. Gustafson, T. Xiao, S. Whitehead, A. C. Berg, W. Y. Lo, P. Dollár, and R. Girshick. Segment anything. InProceedings of the IEEE/CVF International Conference on Computer Vision (ICCV), pages 4015–4026,
-
[6]
doi:10.1109/ICCV51070.2023.00371. L. Zhang, J. Wang, Q. Li, Y. Zhao, and S. Liu. Automatic fish body length measurement based on stereo vision and skeleton extraction.Computers and Electronics in Agriculture, 214:108305, 2023a. doi:10.1016/j.compag.2023.108305. S. Ren, L. Zhang, Z. Li, and T. Liu. Keypoint-based size estimation for irregular root vegetabl...
-
[7]
doi:10.1016/j.compag.2024.108703. X. Liu, D. Zhao, W. Jia, W. Ji, C. Ruan, and Y. Sun. Cucumber fruits detection in greenhouses based on instance segmentation.IEEE Access, 7:139635–139642,
-
[8]
doi:10.1109/ACCESS.2019.2942144. O. M. Lawal. Real-time cucurbit fruit detection in greenhouse using improved YOLO series algorithm. Precision Agriculture, 25:347–359,
-
[9]
doi:10.1007/s11119-023-10079-7. A. Koirala, K. B. Walsh, Z. Wang, and C. McCarthy. In-orchard sizing of mango fruit:
-
[10]
doi:10.3390/horticulturae8121223. P. Song, Z. Li, M. Yang, Y. Shao, Z. Pu, W. Yang, and R. Zhai. Dynamic detection of three-dimensional crop phenotypes based on a consumer-grade RGB-D camera.Frontiers in Plant Science, 14:1097725,
-
[11]
doi:10.3389/fpls.2023.1097725. S. J. Hong, J. Kim, and A. Lee. Real-time morphological measurement of oriental melon fruit through multi- depth camera three-dimensional reconstruction.Food and Bioprocess Technology, 17:5038–5052,
-
[12]
doi:10.1007/s11947-024-03367-9. C. H. Türkseven, M. Jahanbanifard, A. Verma, and Z. A. Becer. Seedling-lump integrated non-destructive monitoring for automatic transplanting with Intel RealSense depth camera.Smart Agricultural Technology, 1:100015,
-
[13]
Rajmeet Singh, Asim Khan, Lakmal Seneviratne, and Irfan Hussain
doi:10.1016/j.atech.2021.100015. Rajmeet Singh, Asim Khan, Lakmal Seneviratne, and Irfan Hussain. Deep learning approach for detecting tomato flowers and buds in greenhouses on 3p2r gantry robot.Scientific Reports, 14(1):20552,
-
[14]
doi:10.1109/CVPR.2016.91. C. Y. Wang, A. Bochkovskiy, and H. Y. M. Liao. YOLOv7-hv: Selective fruit harvesting pre- diction and 6D pose estimation.Computers and Electronics in Agriculture, 226:109362,
-
[15]
doi:10.1016/j.compag.2024.109362. Ultralytics. Ultralytics YOLO documentation.https://docs.ultralytics.com,
-
[16]
doi:10.1109/ICCV.2017.322. A. Carraro, M. Sozzi, and F. Marinello. The Segment Anything Model (SAM) for accelerating the smart farming revolution.Smart Agricultural Technology, 5:100292,
-
[17]
doi:10.1016/j.atech.2023.100292. 21 H. Williams, J. Pham, and L. He. Leaf only SAM: A segment anything pipeline for zero-shot automated leaf segmentation.Frontiers in Plant Science, 15:1373629,
-
[18]
doi:10.3389/fpls.2024.1373629. M. Kaur, R. Singh, S. Alirezaee, and I. Hussain. Visual-language transformer-based tomato leaf disease detection for portable greenhouse monitoring device.Plant Methods, 21(1):139,
-
[19]
doi:10.1186/s13007- 025-01339-w. N. Ravi, V. Gabeur, Y. T. Hu, R. Hu, C. Ryali, T. Ma, H. Khedr, R. Rädle, C. Rolland, L. Gustafson, E. Mintun, J. Pan, K. V. Alwala, N. Carion, C. Y. Wu, R. Girshick, P. Dollár, and C. Feichtenhofer. SAM 2: Segment anything in images and videos.https://arxiv.org/abs/2408.00714,
work page internal anchor Pith review Pith/arXiv arXiv doi:10.1186/s13007-
-
[20]
doi:10.1006/cgip.1994.1042. D. Wu, W. Wu, X. Luo, and M. Li. A high-throughput phenotyping pipeline for image analysis of rice panicle architecture.Plant Phenomics, 2019:2562630,
-
[21]
doi:10.34133/2019/2562630. S. Aich and I. Stavness. Leaf counting with deep convolutional and deconvolutional networks. InProceedings of the IEEE International Conference on Computer Vision Workshops (ICCVW), pages 2080–2089,
-
[22]
doi:10.1109/ICCVW.2017.244. Y. Bao, L. Tang, S. Srinivasan, and P. S. Schnable. Field-based architectural traits characterisa- tion of maize plant using time-of-flight 3d imaging.Biosystems Engineering, 178:86–101,
-
[23]
doi:10.1016/j.biosystemseng.2018.11.005. S. Paulus. Measuring crops in 3d: using geometry for plant phenotyping.Plant Methods, 15(1):103,
-
[24]
doi:10.1186/s13007-019-0490-0. C. de Boor.A Practical Guide to Splines. Springer, revised edition,
-
[25]
doi:10.1007/978-1-4612-6333-3. G. Farin.Curves and Surfaces for CAGD: A Practical Guide. Morgan Kaufmann, 5th edition,
-
[26]
doi:10.3389/fpls.2018.00866. F. Magistri, E. Marks, S. Nagulavancha, I. Vizzo, T. Labe, J. Behley, M. Halstead, C. McCool, and C. Stach- niss. Contrastive 3d shape completion and reconstruction for agricultural robots using RGB-D frames. IEEE Robotics and Automation Letters, 7(4):10120–10127,
-
[27]
doi:10.1109/LRA.2022.3193239. A. Tagliasacchi, T. Delame, M. Spagnuolo, N. Amenta, and A. Telea. 3d skeletons: a state-of-the-art report. Computer Graphics Forum, 35(2):573–597,
-
[28]
doi:10.1111/cgf.12865. J. L. Pech-Pacheco, G. Cristobal, J. Chamorro-Martinez, and J. Fernandez-Valdivia. Diatom autofocusing in brightfield microscopy: a comparative study. InProceedings of the 15th International Conference on Pattern Recognition (ICPR), volume 3, pages 314–317,
-
[29]
doi:10.1109/ICPR.2000.903548. X. Zhao, W. Ding, Y. An, Y. Du, T. Yu, M. Li, M. Tang, and J. Wang. Fast segment anything.arXiv preprint arXiv:2306.12156,
-
[30]
doi:10.48550/arXiv.2306.12156. C. Zhang, D. Han, Y. Qiao, J. U. Kim, S.-H. Bae, S. Lee, and C. S. Hong. Faster segment any- thing: Towards lightweight SAM for mobile applications.arXiv preprint arXiv:2306.14289, 2023b. doi:10.48550/arXiv.2306.14289
discussion (0)
Sign in with ORCID, Apple, or X to comment. Anyone can read and Pith papers without signing in.