An Analytical Toy Equation of State for Neutron Stars Consistent with Current Observations
Pith reviewed 2026-07-02 18:00 UTC · model grok-4.3
The pith
A smooth double-polytropic equation of state matches current neutron star observations while remaining causal.
A machine-rendered reading of the paper's core claim, the machinery that carries it, and where it could break.
Core claim
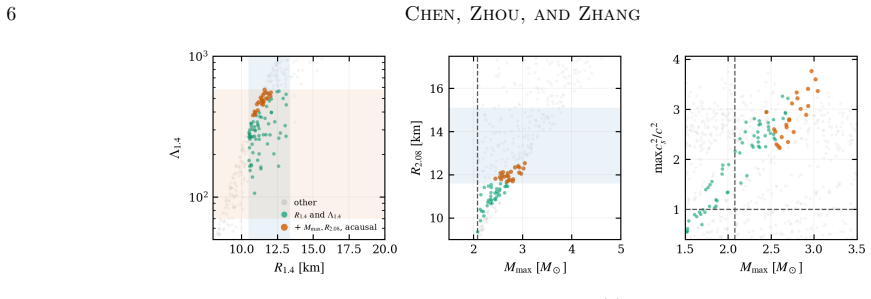
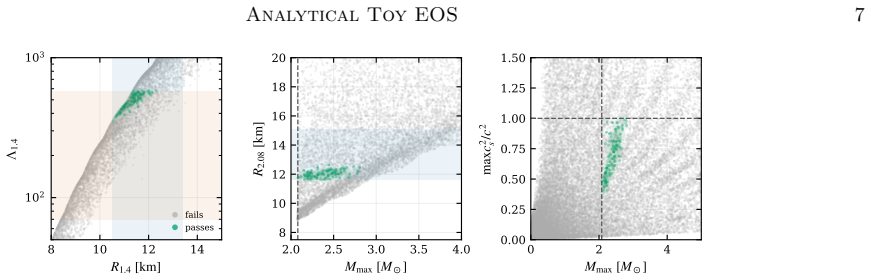
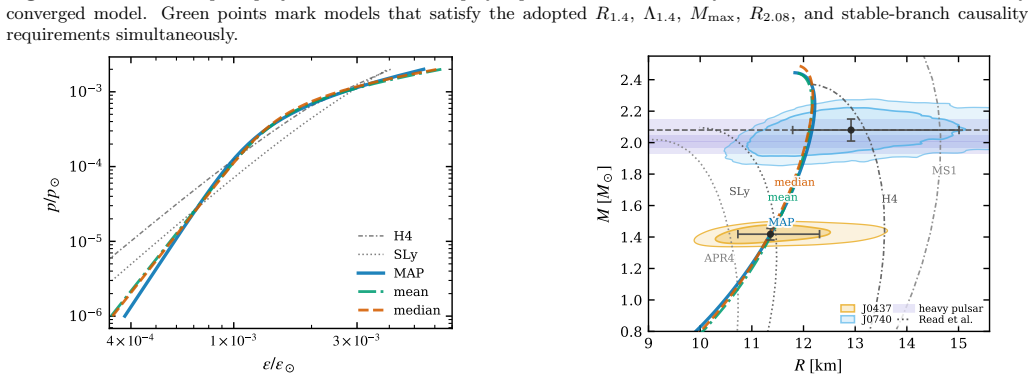
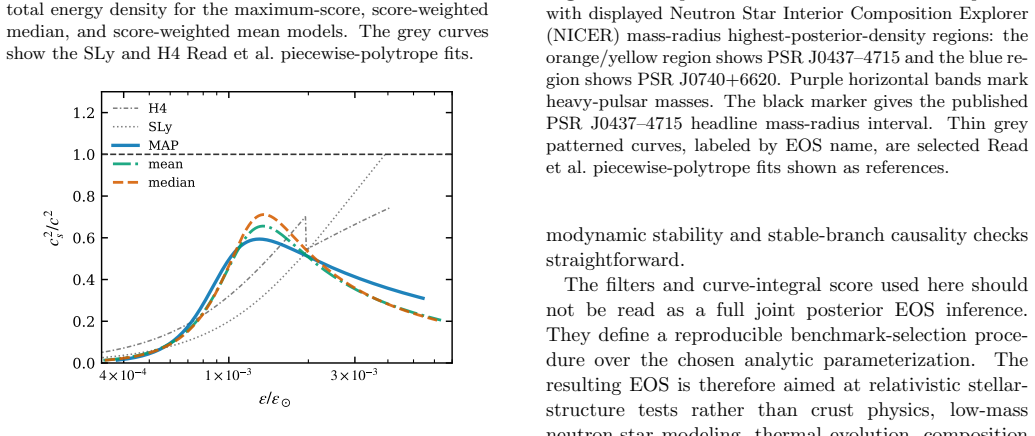
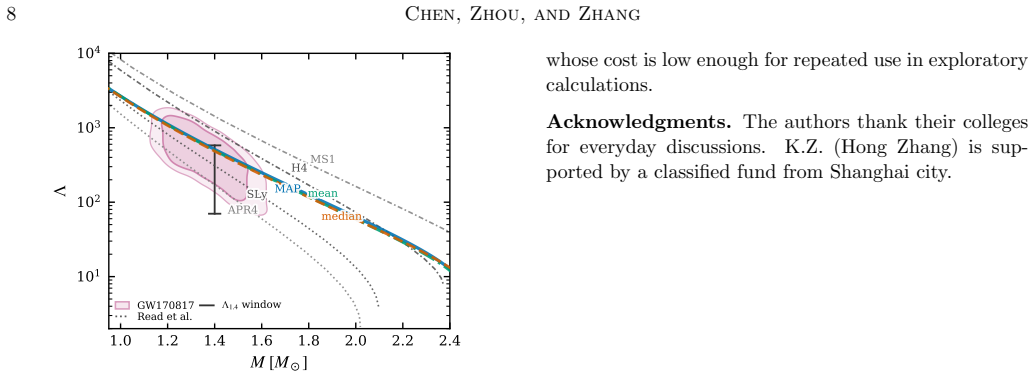
Scanning the smooth double polytropic relation epsilon-hat(p-hat)=a1 p-hat^Gamma1 + a2 p-hat^Gamma2 identifies a viable region of parameters that passes all observational filters, with selected representatives supporting M_max = 2.44--2.49 solar masses, R_1.4 approx 11.3 km and Lambda_1.4=485--512 while remaining causal on the stable branch.
What carries the argument
The smooth double polytropic relation for energy density as a function of pressure, epsilon-hat(p-hat)=a1 p-hat^Gamma1 + a2 p-hat^Gamma2, which is scanned to find parameters compatible with observations.
Load-bearing premise
The double polytropic form is flexible enough to produce sequences compatible with all current constraints without violating causality or stability.
What would settle it
Detection of a neutron star with mass exceeding 2.5 solar masses or a 1.4 solar mass star with radius far from 11.3 km would rule out the benchmark models.
Figures
read the original abstract
Fast analytic and semi-analytic studies of neutron stars often require an equation of state that is convenient to evaluate while producing relativistic stellar sequences compatible with current multimessenger constraints. We construct such a benchmark by scanning a smooth double polytropic relation for the energy density as a function of pressure, $\hat\epsilon (\hat p)=a_1\hat p^{\Gamma_1}+a_2\hat p^{\Gamma_2}$. The parameters are selected with filters based on massive pulsars, tidal deformability from the binary-neutron-star event GW170817, and NICER mass-radius measurements. A single polytropic baseline scan finds no model passing all filters, whereas a double-polytrope scan identifies a viable region. A curve-integral score, evaluated against public NICER and GW170817 posterior data sets, is then used to choose benchmark equations of state within this region. The selected representatives support $M_{\max}=2.44$--$2.49\,M_\odot$, with $R_{1.4}\simeq 11.3$ km and $\Lambda_{1.4}=485$--$512$, and remain causal on the stable branch. This compact analytic family provides reference cases for relativistic stellar-structure tests at current observational scales.
Editorial analysis
A structured set of objections, weighed in public.
Referee Report
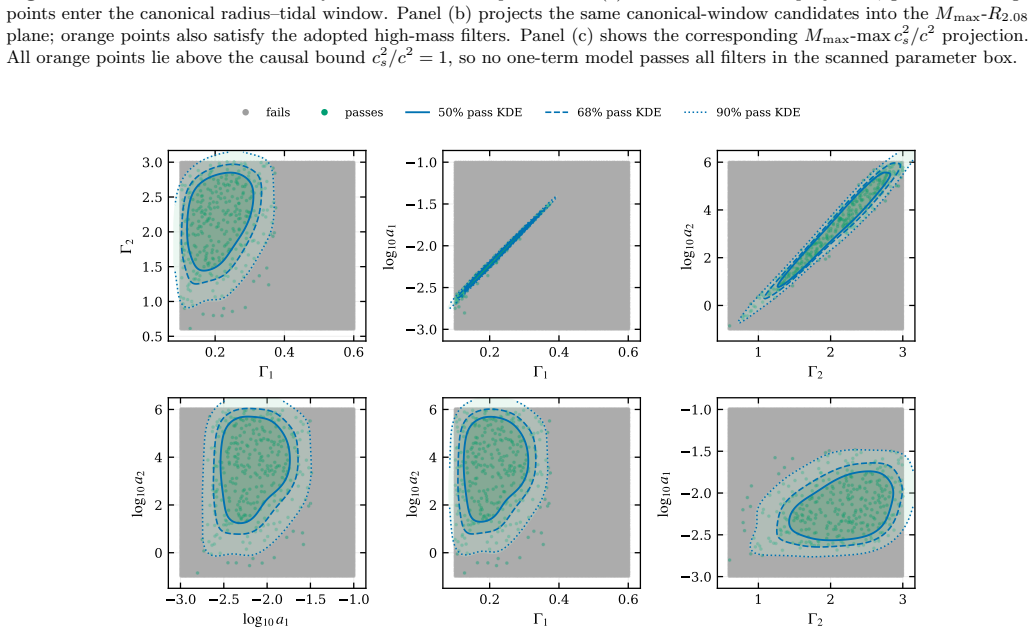
Summary. The manuscript constructs an analytical toy equation of state for neutron stars via a smooth double-polytropic form ε̂(p̂)=a1 p̂^Γ1 + a2 p̂^Γ2. A parameter scan over a1, a2, Γ1, Γ2 applies observational filters drawn from massive pulsars, GW170817 tidal deformability, and NICER mass-radius data; a curve-integral score against public posteriors then selects benchmark models. These yield M_max=2.44–2.49 M_⊙, R_1.4≃11.3 km, Λ_1.4=485–512 while remaining causal on the stable branch. A single-polytrope scan produces no viable models.
Significance. If the scan is exhaustive and causality is enforced at every point on the stable branch, the resulting compact analytic family supplies convenient reference EOS for relativistic stellar-structure calculations at current observational scales. The explicit demonstration that a single polytrope is insufficient while the double-polytrope form succeeds, together with the use of public data sets for scoring, constitutes a reproducible and transparent construction method.
minor comments (3)
- Abstract: the statement that the selected representatives 'support' the quoted M_max, R_1.4 and Λ_1.4 values should be rephrased to make explicit that these properties are direct consequences of the observational filters and scoring procedure used for selection, rather than independent outcomes.
- The normalized variables ε̂ and p̂ and the precise normalization constants should be defined at first use, together with the pressure range over which the double-polytropic relation is applied and how causality is verified throughout the stable branch.
- The manuscript should state whether the curve-integral score is computed on the full posterior samples or on summary statistics, and whether any hold-out subset of the NICER or GW170817 data is reserved for validation.
Simulated Author's Rebuttal
We thank the referee for the accurate summary of the manuscript, the positive significance assessment, and the recommendation for minor revision. No specific major comments were listed in the report.
Circularity Check
No significant circularity; explicit observational selection presented as such
full rationale
The paper's workflow consists of an explicit parameter scan of the double-polytropic form, application of filters drawn from external observational datasets (pulsars, GW170817, NICER), and selection of benchmark models that pass those filters. The reported M_max, R_1.4, and Lambda_1.4 values are direct outputs of this selection and are presented as reference cases consistent with the inputs, without any claim of independent first-principles derivation or prediction. No self-definitional equations, fitted inputs relabeled as predictions, or load-bearing self-citations appear in the described chain. The single-polytrope versus double-polytrope contrast is reported as an empirical scan result.
Axiom & Free-Parameter Ledger
free parameters (1)
- a1, a2, Gamma1, Gamma2
axioms (2)
- domain assumption The equation of state can be adequately represented by a smooth double polytropic function of pressure.
- standard math General relativity governs the stellar structure and stability.
Reference graph
Works this paper leans on
-
[1]
GW170817: Observation of Gravitational Waves from a Binary Neutron Star Inspiral,
Abbott, B. P., et al. 2017, Phys. Rev. Lett., 119, 161101, doi: 10.1103/PhysRevLett.119.161101 —. 2018, Phys. Rev. Lett., 121, 161101, doi: 10.1103/PhysRevLett.121.161101
-
[2]
Vuorinen, A. 2020, Nat. Phys., 16, 907, doi: 10.1038/s41567-020-0914-9
-
[3]
2013, Science, 340, 1233232, doi: 10.1126/science.1233232
Antoniadis, J., et al. 2013, Science, 340, 1233232, doi: 10.1126/science.1233232
-
[4]
Bardeen, J. M., Thorne, K. S., & Meltzer, D. W. 1966, Astrophys. J., 145, 505, doi: 10.1086/148791
-
[5]
Bertulani, C. A. 2023, Particles, 6, 198, doi: 10.3390/particles6010011
-
[6]
Choudhury, D., et al. 2024, Astrophys. J. Lett., 971, L20, doi: 10.3847/2041-8213/ad5a6f
-
[7]
Damour, T., & Nagar, A. 2009, Phys. Rev. D, 80, 084035, doi: 10.1103/PhysRevD.80.084035
-
[8]
Demorest, P. B., Pennucci, T., Ransom, S. M., Roberts, M. S. E., & Hessels, J. W. T. 2010, Nature, 467, 1081, doi: 10.1038/nature09466
-
[9]
Dittmann, A. J., Miller, M. C., Lamb, F. K., et al. 2024, Astrophys. J., 974, 295, doi: 10.3847/1538-4357/ad5f1e
-
[10]
Fonseca, E., Cromartie, H. T., Pennucci, T. T., et al. 2021, Astrophys. J. Lett., 915, L12, doi: 10.3847/2041-8213/ac03b8
-
[11]
A., Gamba, R., Radice, D., & Bernuzzi, S
Godzieba, D. A., Gamba, R., Radice, D., & Bernuzzi, S. 2021, Phys. Rev. D, 103, 063036, doi: 10.1103/PhysRevD.103.063036
-
[12]
Watts, A. L. 2019, Mon. Not. R. Astron. Soc., 485, 5363, doi: 10.1093/mnras/stz654
-
[13]
2001, Bernoulli, 7, 223, doi: 10.2307/3318737
Haario, H., Saksman, E., & Tamminen, J. 2001, Bernoulli, 7, 223, doi: 10.2307/3318737
-
[14]
Hebeler, K., Lattimer, J. M., Pethick, C. J., & Schwenk, A. 2013, Astrophys. J., 773, 11, doi: 10.1088/0004-637X/773/1/11
-
[15]
Hinderer, T. 2008, Astrophys. J., 677, 1216, doi: 10.1086/533487
-
[16]
2026, arXiv e-prints, arXiv:2603.12331, doi: 10.48550/arXiv.2603.12331
Jarequi, G., Mitra, S., & Vaidya, V. 2026, arXiv e-prints, arXiv:2603.12331, doi: 10.48550/arXiv.2603.12331
-
[17]
Kumar, B., & Landry, P. 2019, Phys. Rev. D, 99, 123026, doi: 10.1103/PhysRevD.99.123026
-
[18]
Landry, P., & Essick, R. 2019, Phys. Rev. D, 99, 084049, doi: 10.1103/PhysRevD.99.084049
-
[19]
Lattimer, J. M. 2012, Annu. Rev. Nucl. Part. Sci., 62, 485, doi: 10.1146/annurev-nucl-102711-095018
-
[20]
Landry, P. 2022, Phys. Rev. D, 105, 043016, doi: 10.1103/PhysRevD.105.043016
-
[21]
Lindblom, L. 2010, Phys. Rev. D, 82, 103011, doi: 10.1103/PhysRevD.82.103011 Analytical Toy EOS9 —. 2018, Phys. Rev. D, 97, 123019, doi: 10.1103/PhysRevD.97.123019
-
[22]
Miller, M. C., et al. 2019, Astrophys. J. Lett., 887, L24, doi: 10.3847/2041-8213/ab50c5 —. 2021, Astrophys. J. Lett., 918, L28, doi: 10.3847/2041-8213/ac089b O’Boyle, M. F., Markakis, C., Stergioulas, N., & Read, J. S. 2020, Phys. Rev. D, 102, 083027, doi: 10.1103/PhysRevD.102.083027
-
[23]
Oppenheimer, J. R., & Volkoff, G. M. 1939, Phys. Rev., 55, 374, doi: 10.1103/PhysRev.55.374 ¨Ozel, F., & Freire, P. 2016, Annu. Rev. Astron. Astrophys., 54, 401, doi: 10.1146/annurev-astro-081915-023322
-
[24]
Potekhin, A. Y., Fantina, A. F., Chamel, N., Pearson, J. M., & Goriely, S. 2013, Astron. Astrophys., 560, A48, doi: 10.1051/0004-6361/201321697
-
[25]
Raaijmakers, G., Riley, T. E., & Watts, A. L. 2018, Mon. Not. R. Astron. Soc., 478, 2177, doi: 10.1093/mnras/sty1052
-
[26]
Read, J. S., Lackey, B. D., Owen, B. J., & Friedman, J. L. 2009, Phys. Rev. D, 79, 124032, doi: 10.1103/PhysRevD.79.124032
-
[27]
Riley, T. E., et al. 2019, Astrophys. J. Lett., 887, L21, doi: 10.3847/2041-8213/ab481c —. 2021, Astrophys. J. Lett., 918, L27, doi: 10.3847/2041-8213/ac0a81
-
[28]
J., Novak, J., Oertel, M., & Pons, J
Servignat, G., Davis, P. J., Novak, J., Oertel, M., & Pons, J. A. 2024, Phys. Rev. D, 109, 103022, doi: 10.1103/PhysRevD.109.103022
-
[29]
Steiner, A. W., Lattimer, J. M., & Brown, E. F. 2010, Astrophys. J., 722, 33, doi: 10.1088/0004-637X/722/1/33
-
[30]
Suleiman, L., Fortin, M., Zdunik, J. L., & Providˆ encia, C. 2022, Phys. Rev. C, 106, 035805, doi: 10.1103/PhysRevC.106.035805 ter Braak, C. J. F. 2006, Stat. Comput., 16, 239, doi: 10.1007/s11222-006-8769-1
-
[31]
Tolman, R. C. 1939, Phys. Rev., 55, 364, doi: 10.1103/PhysRev.55.364
-
[32]
Zhao, T., & Lattimer, J. M. 2018, Phys. Rev. D, 98, 063020, doi: 10.1103/PhysRevD.98.063020 10Chen, Zhou, and Zhang APPENDIX A.NUMERICAL SETTINGS The one-term baseline uses a uniform Sobol scan in Γ∈[0.20,1.40] and log 10 a∈[−3.00,2.00]. The double-polytrope scan used for the final feasible-region figures is uniform in the ordered box Γ1 ∈[0.10,0.60], Γ2 ...
discussion (0)
Sign in with ORCID, Apple, or X to comment. Anyone can read and Pith papers without signing in.