REVIEW 4 major objections 5 minor 39 references
Real multi-model LLM serving traffic splits into architecture-specific burstiness regimes: Dense jitters at high frequency, MoE bursts at low frequency with high amplitude, and input-output token geometry is non-monotonic.
Reviewed by Pith at T0; open to challenge. T0 means a machine referee read the full paper against a public rubric. the ladder, T0–T4 →
T0 review · deepseek-v4-flash
2026-08-02 16:01 UTC pith:L3PWAXUP
load-bearing objection Genuinely useful dataset and some real empirical observations, but the architecture/scale generalizations are confounded by one-model dominance and the task analysis rests on unvalidated labels. the 4 major comments →
FineServe: A Fine-Grained Dataset and Characterization of Global LLM Serving Workloads
The pith
A machine-rendered reading of the paper's core claim, the machinery that carries it, and where it could break.
Core claim
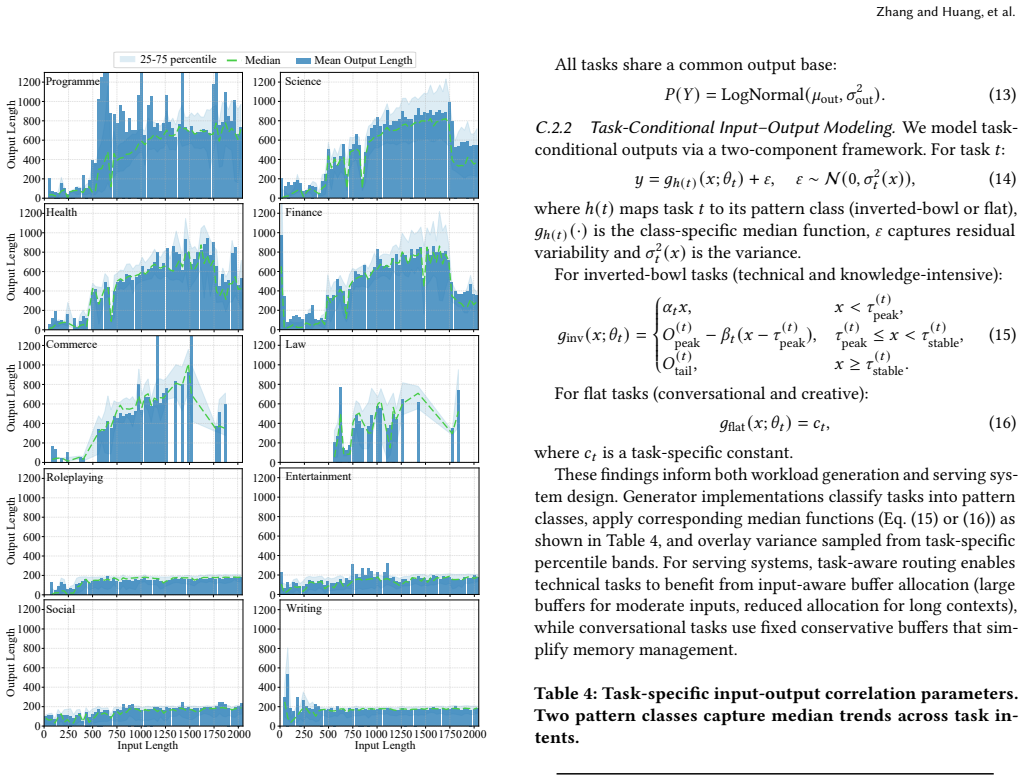
FineServe's discovery is that a production multi-model LLM service presents not one workload but a mixture with distinct arrivals and token geometry. From 1.48B requests over four months on a global marketplace, architecture and scale separate traffic into regimes: small Dense models shift most over weeks and show high-frequency, low-amplitude jitter; MoE models stay stable long-term but arrive in low-frequency, high-amplitude bursts. Input-output relationships are architecture-dependent and non-monotonic: Dense models follow an inverted bowl—median output peaks near 1.5–2K input tokens, then falls more than 60%—while MoE outputs grow 3.5–4× and saturate. Task labels from a 100K sample put S
What carries the argument
The central object is the per-model request stream decomposed along three axes: architecture (Dense versus mixture-of-experts), scale tier (below 10B, 10–30B, 30–100B, above 100B), and task intent. The argument is carried by fitted statistical signatures: Gamma-distributed inter-arrival times capture segment-level timing, a negative-binomial model captures millisecond-level request clustering where over-dispersion appears, log-normal distributions fit input lengths, and piecewise conditional-mean functions—inverted-bowl for Dense and technical tasks, growth-saturation for MoE—capture median output as a function of input. The generator is the mechanism that turns these signatures into benchma
Load-bearing premise
The load-bearing premise is that the task-intent labels are accurate enough to anchor the task findings—the paper reports no accuracy or agreement statistics for its labeling pipeline—and that the small-Dense burstiness signature is a class property rather than the behavior of the single model that dominates that bucket.
What would settle it
A human-annotated random sample of the 100K labeled requests, scored against the pipeline's labels, would settle whether the task-composition and task-token findings are artifacts; likewise, recomputing CV and MSSD per model within the small-Dense bucket after excluding the dominant model would test whether the jitter regime survives as a class-level signature.
If this is right
- Single-model or aggregate benchmarks will misrepresent real multi-model serving; evaluation should mix per-model streams with architecture- and scale-specific arrival and token distributions.
- Scheduling for small Dense models should target high-frequency second-level jitter, while MoE models need capacity that tolerates low-frequency, high-amplitude bursts; one variability metric cannot capture both.
- Prefill and decode resource planning should be input-aware: Dense workloads need large output buffers for moderate prompts and smaller buffers for long context, whereas MoE workloads need output buffers that grow with context.
- Arrival modeling should combine Gamma inter-arrival times with negative-binomial millisecond counts for over-dispersed groups; Gamma-only modeling understates short-term concurrency in small Dense traffic.
- Task-aware workload generation mainly affects prefill-side input distributions; decode-side output length can share a common base distribution with light task-specific corrections.
Where Pith is reading between the lines
- The architecture-dependent signatures may partly reflect market pricing and latency tiers rather than model internals; a testable extension is to check whether a newly introduced cheap small model inherits the small-Dense jitter regime regardless of its architecture.
- The task findings rest on classifier labels whose accuracy is unreported; a natural validation is to re-run the labeling pipeline on a human-annotated sample and report per-intent precision and recall before relying on the 45.9% Science share.
- Because one small Dense model accounts for 62.6% of its bucket's traffic, the flagship small-Dense burstiness signature could be a single-model effect; recomputing per-model CV and MSSD after removing that model would settle whether it is a class property.
- The generator's task-aware adapter can be used as an instrument: hold arrival processes and total token volume fixed while toggling task adaptation, then measure how much routing and scheduling decisions shift, quantifying how much the task dimension actually matters for system design.
Editorial analysis
A structured set of objections, weighed in public.
Referee Report
Summary. The paper presents FineServe, a four-month production trace of 1.48B LLM serving requests from a commercial multi-model marketplace, with per-request timestamps, model identifiers, and input/output token counts. It groups models by architecture (Dense/MoE) and scale tier, analyzes request arrivals (long-term KS/W1 drift, short-term CV/MSSD burstiness) and token geometry (marginal distributions, conditional input-output curves), then uses a two-stage classifier to label 100K requests into 10 task intents. Seven findings are distilled: Dense workloads drift more; Dense jitter is high-frequency vs MoE low-frequency high-amplitude bursts; Gamma arrivals need NB count augmentation; log-normal inputs fit better than Zipf; Dense input-output curves are inverted-bowl while MoE grow-saturate; task intents shape input but not output distributions; and technical vs conversational tasks mirror architecture-level curves. A generator (FineServe) supports trace replay and parametric synthesis with model/task-aware components. The central thesis is that aggregate workload views mislead system design and axis-specific signatures should guide scheduling/capacity planning.
Significance. If the findings hold, this is a valuable, much-needed multi-model serving workload resource. The dataset scale (1.48B requests, four months, 55+ models) goes well beyond existing public traces, and the paper is the first to jointly label architecture, scale, and task intent. I credit the authors for releasing both the trace and generator code, which is central to reproducibility. The paper makes concrete, falsifiable architecture-dependent claims that would directly inform scheduling and capacity planning. However, as submitted, three load-bearing parts are under-supported: (i) the task-intent labels are unvalidated, (ii) generator fidelity is demonstrated only in-sample and qualitatively, and (iii) architecture/scale groups are dominated by a single model family, casting doubt on class-level generalization. These issues are fixable and do not invalidate the dataset, but they are central to the paper's characterization and generation claims.
major comments (4)
- [Section 4, Figs. 8-10, Table 4] The entire task-intent analysis rests on labels produced by a two-stage pipeline: Google Cloud classifyText on 20K requests at the default 0.5 confidence, then a fine-tuned BERT multi-label classifier applied to a 100K sample. No accuracy, precision/recall, or agreement statistics are reported for either stage, and the 'random sample' procedure is not described. Without evidence that labels are reliable, the task composition (Science 45.9%), Findings 6-7, and the task-aware payload adapter in §5.1 are unverified. Please add held-out classifier metrics, a confusion/agreement analysis, and a description of the sampling procedure.
- [Section 5.2, Fig. 12] The fidelity claim for parametric synthesis is supported only by a visual side-by-side of one 250-second trace per group, generated from parameters fitted to the same trace being replayed. This is an in-sample, qualitative check; it does not establish that generated workloads reproduce the statistical signatures the paper emphasizes (e.g., KS/W1 drift, CV/MSSD regimes, burst contributions). Please add quantitative goodness-of-fit comparisons on held-out windows or a different time period, reporting the same distributional metrics used in §3 (KS, W1, CV, MSSD, token-length statistics), and test generation at various scales.
- [Sections 3.1-3.2, Fig. 1 caption, Figs. 2-7] The Dense <10B group is 62.6% a single model (llama-3.1-8b-instruct-bf16), and the MoE >100B group is dominated by DeepSeek models. Findings 1-3 and 5 are stated as architecture/scale properties, but the contrasts in Figs. 2-7 may reflect the traffic of one popular model or one deployment context rather than the regime. Please report per-model heterogeneity within each architecture-scale group, e.g., leave-one-out or per-model distributions of the headline metrics (KS, W1, CV, MSSD, input-output curves), and state how many models actually contribute to each panel. If the dominant model's behavior differs from the rest of its group, the regime-level conclusions need qualification.
- [Section 3.2.2 and Appendix C.1, Eqs. (8)-(9), Table 3] The piecewise output models report point parameter values (e.g., peak 620 @ 1500 input, stable 165 @ 5000+, MoE max 400 @ 8000+) without confidence intervals or goodness-of-fit measures. Given the emphasis on 'fundamentally different' curves, the 3.5-4x growth claim for MoE and the 60% drop claim for Dense are hard to assess. Some quantification of fit quality and between-model variability is needed; otherwise these fitted curves risk being over-interpreted as universal architectural properties.
minor comments (5)
- [Table 1 vs Section 2.2] Table 1 and the abstract say 55 models; Section 2.2 says 57 distinct models. Table 5 lists 55. Please reconcile.
- [Section 4] 'Retaining up to two high-confidence task labels' — the high-confidence threshold is not defined. Please specify the confidence cutoff used when selecting the top two labels.
- [Appendix C.1] The residual term ε∼N(0, σ_Dense(x)) is applied to token counts, so sampled outputs can be negative. Please state how negative samples are handled (e.g., clipping, resampling).
- [Fig. 6] The legend shows 'Log-normal fit (Input)' but the fit curve is visible only for Dense <10B. Clarify whether fits are shown for other groups.
- [Fig. 12] The replay and parametric traces are plotted with different vertical offsets, making direct comparison harder than necessary. Overlaying with aligned axes or plotting differences would be clearer.
Circularity Check
Generator 'validation' is an in-sample fit; the empirical characterization findings remain non-circular.
specific steps
-
fitted input called prediction
[Section 5.2, Fig. 12; fitted in §3.1.3 (Eqs. 5–6), §3.2 (Eq. 7), Appendix C (Eqs. 8–9, Table 3)]
"To validate the fidelity of our parametric workload generation, we compare the arrival patterns produced by the parametric mode against those obtained via trace replay. ... As shown in Fig. 12, the parametric workloads closely resemble the replayed traces in terms of arrival intensity, burst frequency, and temporal fluctuation patterns. ... we partition the request trace into fixed-length windows of T=300 seconds... fit their distribution with a Gamma model ... we discretize time into Δ=1ms slots and model the per-slot arrival count n_{s,t} within window s using an NB distribution."
The Gamma (Eq. 5) and NB (Eq. 6) arrival parameters, as well as the log-normal and piecewise payload parameters (Eqs. 7–9, Table 3), are estimated from the same 1.48B-request trace that Fig. 12 uses as the replay baseline. The 'validation' therefore compares samples drawn from distributions fitted to a trace against that same trace. Close resemblance is guaranteed in expectation by the fitting procedure, so the generator-fidelity claim reduces to in-sample goodness-of-fit rather than independent prediction on held-out data or unseen workloads.
full rationale
The paper's central contribution is an empirical characterization: Findings 1–7 are descriptive statistics (KS/W1 distances, CV/MSSD, conditional medians) computed directly from the released trace. These observations do not reduce to the generator or to any self-citation chain, and they are not predictions from fitted parameters. The only load-bearing step that reduces to its own inputs is the generator 'fidelity' validation in Fig. 12: every generative model—Gamma inter-arrivals, NB millisecond counts, log-normal inputs, piecewise output correlations—is fitted to the same trace used as the comparison baseline, so the claimed resemblance is a self-consistency check. This does not undermine the characterization findings or the released dataset, but it means the parametric generator's fidelity claim is not independently established. The task-label pipeline (20K silver labels, fine-tuned BERT, 100K sample) lacks accuracy/agreement statistics; that is a measurement-validity limitation, not circularity. No load-bearing self-citations, imported uniqueness theorems, or ansatz-by-citation were found. Overall circularity is moderate and localized to the generator validation, not to the paper's main empirical claims.
Axiom & Free-Parameter Ledger
free parameters (7)
- Gamma shape alpha_s and scale beta_s (per 5-minute window, per architecture-scale group) =
time-varying; approximate ranges from Fig. 5: alpha ~ 0.25-1.0, beta ~ 0.3-4000
- Negative binomial r_s (and p_s) per window =
r_s = 0.03696 (Dense <10B), 0.00002 (other groups) (Table 2)
- Log-normal (mu, sigma) input-length parameters per architecture group =
not tabulated in the text
- Dense piecewise output model: O_base, alpha_Dense, tau_peak, O_peak, beta_Dense, tau_stable, O_tail =
peak 620 @ 1500 inputs; stable 165 @ 5000+; drop ~ 60% (Table 3)
- MoE piecewise output model: O_init, k1, k2, k3, tau_growth, tau_sat, O_mid, O_sat, M_max =
start 100 @ 500; mid 290 @ 5000; max 400 @ 8000+ (Table 3)
- Task-distribution parameters: pi_t, lambda_t, spike weights rho_{t,k}, spike locations tau_{t,k}, background q_t, platea =
Table 4: e.g., Programme tau_peak=1100, O_peak=950, O_tail=520; flat tasks c_t ~ 140-155
- Residual output variance sigma_Dense(x) / empirical percentile bands =
empirical P25-P75 bands per input bin
axioms (7)
- domain assumption Backend logging captures every request's arrival timestamp and token counts without loss or systematic quantization beyond 1 ms resolution.
- domain assumption Per-millisecond count statistics (Table 2) reflect arrival behavior rather than timestamp-granularity artifacts.
- domain assumption Google Cloud classifyText silver labels at the default 0.5 confidence threshold are valid ground truth for task intent.
- domain assumption The BERT classifier fine-tuned on 20K silver labels generalizes to the 100K request sample.
- domain assumption The 100K request sample is representative of the 1.48B-request population.
- standard math Two-sample KS statistic and W1 distance between adjacent 300 s windows are valid measures of long-term arrival drift.
- domain assumption The absence of diurnal patterns reflects the platform's global coverage rather than provider-side controls (rate limits, pricing, deployment changes).
invented entities (1)
-
10-category task-intent taxonomy (Science, Writing, Roleplaying, ...)
no independent evidence
read the original abstract
Large language models (LLMs) are increasingly deployed as always-on online services, making efficient LLM serving a critical systems challenge. Achieving low latency and high throughput under volatile demand requires deep understanding of real-world serving workloads, yet existing studies often rely on proxy traces or coarse-grained characterizations that fail to capture the heterogeneity of modern multi-model LLM platforms. We present FineServe, an in-the-wild, multi-model LLM serving workload dataset collected from a global commercial marketplace, enabling fine-grained characterization of real-world serving dynamics across heterogeneous models and tasks. Leveraging FineServe, we conduct a comprehensive analysis of arrival dynamics and token behavior, revealing fundamentally different fluctuation regimes across model architectures, scales and task intents. Building on these insights, we develop the FineServe workload generator, which composes fine-grained model-aware workloads into configurable mixtures tailored for benchmarking multi-model serving platforms. By exposing these fine-grained workload dynamics, FineServe provides a realistic foundation for evaluating routing, scheduling, and capacity-planning strategies in LLM serving systems. FineServe is available at https://github.com/hihiztc1/FineServe.
Figures


Reference graph
Works this paper leans on
-
[1]
Malika Aubakirova, Alex Atallah, Chris Clark, Justin Summerville, and Anjney Midha. 2026. State of AI: An Empirical 100 Trillion Token Study with OpenRouter. arXiv:2601.10088 [cs.AI] https://arxiv.org/abs/2601.10088
arXiv 2026
-
[2]
Jinze Bai, Shuai Bai, Yunfei Chu, Zhenyu Cui, Kai Dang, Xiaodong Deng, et al
-
[3]
Tom B. Brown, Benjamin Mann, Nick Ryder, Melanie Subbiah, Jared Kaplan, Prafulla Dhariwal, Arvind Neelakantan, Pranav Shyam, Girish Sastry, Amanda Askell, Sandhini Agarwal, Ariel Herbert-Voss, Gretchen Krueger, Tom Henighan, Rewon Child, Aditya Ramesh, Daniel M. Ziegler, Jeffrey Wu, Clemens Winter, Christopher Hesse, Mark Chen, Eric Sigler, Mateusz Litwin...
2020
-
[4]
Lingjiao Chen, Matei Zaharia, and James Zou. 2023. FrugalGPT: How to Use Large Language Models While Reducing Cost and Improving Performance.arXiv preprint arXiv:2305.05176(2023)
Pith/arXiv arXiv 2023
-
[5]
Damai Dai, Chengqi Deng, Chenggang Zhao, R. X. Xu, Huazuo Gao, Deli Chen, Jiashi Li, Wangding Zeng, Xingkai Yu, Y. Wu, Zhenda Xie, Y. K. Li, Panpan Huang, Fuli Luo, Chong Ruan, Zhifang Sui, and Wenfeng Liang. 2024. DeepSeekMoE: Towards Ultimate Expert Specialization in Mixture-of-Experts Language Models. InProceedings of the 62nd Annual Meeting of the Ass...
2024
-
[6]
Tri Dao. 2024. FlashAttention-2: Faster Attention with Better Parallelism and Work Partitioning. InThe Twelfth International Conference on Learning Represen- tations, ICLR 2024, Vienna, Austria, May 7-11, 2024. OpenReview.net
2024
-
[7]
Jacob Devlin, Ming-Wei Chang, Kenton Lee, and Kristina Toutanova. 2019. BERT: Pre-training of Deep Bidirectional Transformers for Language Understanding. InProceedings of the 2019 Conference of the North American Chapter of the Associ- ation for Computational Linguistics: Human Language Technologies, NAACL-HLT Volume 1 (Long and Short Papers). 4171–4186
2019
-
[8]
DeepSeek-AI et al. 2025. DeepSeek-V3 Technical Report. arXiv:2412.19437 [cs.CL] https://arxiv.org/abs/2412.19437
Pith/arXiv arXiv 2025
-
[9]
Gonçalves, Idilio Drago, Alex B
Glauber D. Gonçalves, Idilio Drago, Alex B. Vieira, Ana Paula Couto da Silva, Jussara M. Almeida, and Marco Mellia. 2016. Workload models and performance evaluation of cloud storage services.Computer Networks109 (2016), 183–199. doi:10.1016/j.comnet.2016.03.024 Traffic and Performance in the Big Data Era
-
[10]
2011.Negative binomial regression
Joseph M Hilbe. 2011.Negative binomial regression. Cambridge University Press
2011
-
[11]
Qinghao Hu, Zhisheng Ye, Zerui Wang, Guoteng Wang, Meng Zhang, Qiaoling Chen, Peng Sun, Dahua Lin, Xiaolin Wang, Yingwei Luo, Yonggang Wen, and Tianwei Zhang. 2024. Characterization of Large Language Model Development in the Datacenter. In21st USENIX Symposium on Networked Systems Design and Implementation, NSDI 2024, Santa Clara, CA, April 15-17, 2024. U...
2024
-
[12]
Qinghao Hu, Zhisheng Ye, Zerui Wang, Guoteng Wang, Meng Zhang, Qiaoling Chen, Peng Sun, Dahua Lin, Xiaolin Wang, Yingwei Luo, Yonggang Wen, and Tianwei Zhang. 2024. Characterization of Large Language Model Development in the Datacenter. InUSENIX Symposium on Networked Systems Design and Implementation (NSDI)
2024
-
[13]
Myeongjae Jeon, Shivaram Venkataraman, Amar Phanishayee, Junjie Qian, Wencong Xiao, and Fan Yang. 2019. Analysis of Large-Scale Multi-Tenant GPU Clusters for DNN Training Workloads. In2019 USENIX Annual Techni- cal Conference (USENIX ATC 19). USENIX Association, Renton, WA, 947–960. https://www.usenix.org/conference/atc19/presentation/jeon
2019
-
[14]
Kimi Team. 2025. Kimi K2: Open Agentic Intelligence.arXiv preprint arXiv:2507.20534(2025)
Pith/arXiv arXiv 2025
-
[15]
Dmitry Lepikhin, HyoukJoong Lee, Yuanzhong Xu, Dehao Chen, Orhan Firat, Yanping Huang, Maxim Krikun, Noam Shazeer, and Zhifeng Chen. 2021. GShard: Scaling Giant Models with Conditional Computation and Automatic Sharding. In9th International Conference on Learning Representations, ICLR 2021, Virtual Event, Austria, May 3-7, 2021. OpenReview.net. https://op...
2021
-
[16]
Gonzalez, and Ion Sto- ica
Zhuohan Li, Lianmin Zheng, Yinmin Zhong, Vincent Liu, Ying Sheng, Xin Jin, Yanping Huang, Zhifeng Chen, Hao Zhang, Joseph E. Gonzalez, and Ion Sto- ica. 2023. AlpaServe: Statistical Multiplexing with Model Parallelism for Deep Learning Serving. In17th USENIX Symposium on Operating Systems Design and Implementation, OSDI 2023, Boston, MA, USA, July 10-12, ...
2023
-
[17]
Microsoft. 2023. DeepSpeed-MII. https://github.com/microsoft/DeepSpeed-MII. Accessed: 2023
2023
-
[18]
NVIDIA. 2023. TensorRT-LLM. https://github.com/NVIDIA/TensorRT-LLM. Accessed: 2023
2023
-
[19]
Gonzalez, M
Isaac Ong, Amjad Almahairi, Vincent Wu, Wei-Lin Chiang, Tianhao Wu, Joseph E. Gonzalez, M. Waleed Kadous, and Ion Stoica. 2025. RouteLLM: Learning to Route LLMs from Preference Data. InInternational Conference on Learning Representa- tions (ICLR). https://openreview.net/forum?id=8sSqNntaMr
2025
-
[20]
OpenAI. 2024. GPT-4o: Introducing a Multimodal Omni Model. https://openai. com/index/hello-gpt-4o/
2024
-
[21]
Jay Shah, Ganesh Bikshandi, Ying Zhang, Vijay Thakkar, Pradeep Ramani, and Tri Dao. 2024. FlashAttention-3: Fast and Accurate Attention with Asynchrony and Low-precision. InAdvances in Neural Information Processing Systems 38: Annual Conference on Neural Information Processing Systems 2024, NeurIPS 2024, Vancouver, BC, Canada, December 10 - 15, 2024, Amir...
2024
-
[22]
Le, Geoffrey E
Noam Shazeer, Azalia Mirhoseini, Krzysztof Maziarz, Andy Davis, Quoc V. Le, Geoffrey E. Hinton, and Jeff Dean. 2017. Outrageously Large Neural Networks: The Sparsely-Gated Mixture-of-Experts Layer. In5th International Conference on Learning Representations, ICLR 2017, Toulon, France, April 24-26, 2017, Conference Track Proceedings
2017
-
[23]
Jovan Stojkovic, Chaojie Zhang, Íñigo Goiri, Josep Torrellas, and Esha Choukse
-
[24]
Biao Sun, Ziming Huang, Hanyu Zhao, Wencong Xiao, Xinyi Zhang, Yong Li, and Wei Lin. 2024. Llumnix: Dynamic Scheduling for Large Language Model Serving. In18th USENIX Symposium on Operating Systems Design and Implementation, OSDI 2024, Santa Clara, CA, USA, July 10-12, 2024, Ada Gavrilovska and Douglas B. Terry (Eds.). USENIX Association, 173–191
2024
-
[25]
Qwen Team. 2025. Qwen2.5 Technical Report. arXiv:2412.15115 [cs.CL] https: //arxiv.org/abs/2412.15115
Pith/arXiv arXiv 2025
-
[26]
Hugo Touvron, Thibaut Lavril, Gautier Izacard, Xavier Martinet, Marie-Anne Lachaux, Timothée Lacroix, Baptiste Rozière, Naman Goyal, Eric Hambro, Faisal Azhar, Aurélien Rodriguez, Armand Joulin, Edouard Grave, and Guillaume Lam- ple. 2023. LLaMA: Open and Efficient Foundation Language Models.arXiv preprint arXiv:2302.13971(2023)
Pith/arXiv arXiv 2023
-
[27]
Gomez, Lukasz Kaiser, and Illia Polosukhin
Ashish Vaswani, Noam Shazeer, Niki Parmar, Jakob Uszkoreit, Llion Jones, Aidan N. Gomez, Lukasz Kaiser, and Illia Polosukhin. 2017. Attention is All you Need. InAdvances in Neural Information Processing Systems 30: Annual Con- ference on Neural Information Processing Systems 2017, December 4-9, 2017, Long Beach, CA, USA. 5998–6008
2017
-
[28]
Haixun Wang. 2024. Generative AI in E-Commerce: What Can We Expect?. In Proceedings of the 30th ACM SIGKDD Conference on Knowledge Discovery and Data Mining(Barcelona, Spain)(KDD ’24). 4739–4740
2024
-
[29]
Yuxin Wang, Yuhan Chen, Zeyu Li, Xueze Kang, Yuchu Fang, Yeju Zhou, Yang Zheng, Zhenheng Tang, Xin He, Rui Guo, Xin Wang, Qiang Wang, Amelie Chi Zhou, and Xiaowen Chu. 2025. BurstGPT: A Real-World Workload Dataset to Optimize LLM Serving Systems. InProceedings of the 31st ACM SIGKDD Conference on Knowledge Discovery and Data Mining V.2 (KDD ’25). Associat...
doi:10.1145/3711896 2025
-
[30]
Qizhen Weng, Wencong Xiao, Yinghao Yu, Wei Wang, Cheng Wang, Jian He, Yong Li, Liping Zhang, Wei Lin, and Yu Ding. 2022. MLaaS in the Wild: Workload Analysis and Scheduling in Large-Scale Heterogeneous GPU Clusters. In19th Zhang and Huang, et al. USENIX Symposium on Networked Systems Design and Implementation (NSDI 22). USENIX Association, Renton, WA, 945...
2022
-
[31]
Bingyang Wu, Yinmin Zhong, Zili Zhang, Shengyu Liu, Fangyue Liu, Yuanhang Sun, Gang Huang, Xuanzhe Liu, and Xin Jin. 2024. Fast Distributed Inference Serving for Large Language Models. arXiv:2305.05920 [cs.LG]
Pith/arXiv arXiv 2024
-
[32]
Awadallah, Ryen White, Doug Burger, and Chi Wang
Qingyun Wu, Gagan Bansal, Jieyu Zhang, Yiran Wu, Beibin Li, Erkang Zhu, Li Jiang, Xiaoyun Zhang, Shaokun Zhang, Jiale Liu, Ahmed H. Awadallah, Ryen White, Doug Burger, and Chi Wang. 2024. AutoGen: Enabling Next-Gen LLM Applications via Multi-Agent Conversation. InWorkshop on Large Language Models for Agents. ICLR 2024 Workshop
2024
-
[33]
Yuxing Xiang, Xue Li, Kun Qian, Wenyuan Yu, Ennan Zhai, and Xin Jin. 2025. ServeGen: Workload Characterization and Generation of Large Language Model Serving in Production. arXiv:2505.09999 [cs.DC] https://arxiv.org/abs/2505.09999
Pith/arXiv arXiv 2025
-
[34]
Gyeong-In Yu, Joo Seong Jeong, Geon-Woo Kim, Soojeong Kim, and Byung- Gon Chun. 2022. Orca: A Distributed Serving System for Transformer-Based Generative Models. In16th USENIX Symposium on Operating Systems Design and Implementation, OSDI 2022, Carlsbad, CA, USA, July 11-13, 2022, Marcos K. Aguilera and Hakim Weatherspoon (Eds.). USENIX Association, 521–538
2022
-
[35]
Gonzalez, Clark W
Lianmin Zheng, Liangsheng Yin, Zhiqiang Xie, Chuyue Sun, Jeff Huang, Cody Hao Yu, Shiyi Cao, Christos Kozyrakis, Ion Stoica, Joseph E. Gonzalez, Clark W. Barrett, and Ying Sheng. 2024. SGLang: Efficient Execution of Struc- tured Language Model Programs. InAdvances in Neural Information Processing Systems 38: Annual Conference on Neural Information Process...
2024
-
[36]
Yinmin Zhong, Shengyu Liu, Junda Chen, Jianbo Hu, Yibo Zhu, Xuanzhe Liu, Xin Jin, and Hao Zhang. 2024. DistServe: Disaggregating Prefill and Decoding for Goodput-optimized Large Language Model Serving. In18th USENIX Symposium on Operating Systems Design and Implementation, OSDI 2024, Santa Clara, CA, USA, July 10-12, 2024, Ada Gavrilovska and Douglas B. T...
2024
-
[2023]
Qwen Technical Report.arXiv preprint arXiv:2309.16609(2023)
Pith/arXiv arXiv 2023
-
[2024]
Association for Computational Linguistics, 1280–1297
-
[2025]
InIEEE International Symposium on High-Performance Computer Architecture (HPCA)
DynamoLLM: Designing LLM Inference Clusters for Performance and En- ergy Efficiency. InIEEE International Symposium on High-Performance Computer Architecture (HPCA). arXiv:2408.00741
discussion (0)
Sign in with ORCID, Apple, or X to comment. Anyone can read and Pith papers without signing in.