REVIEW 4 major objections 5 minor 59 references
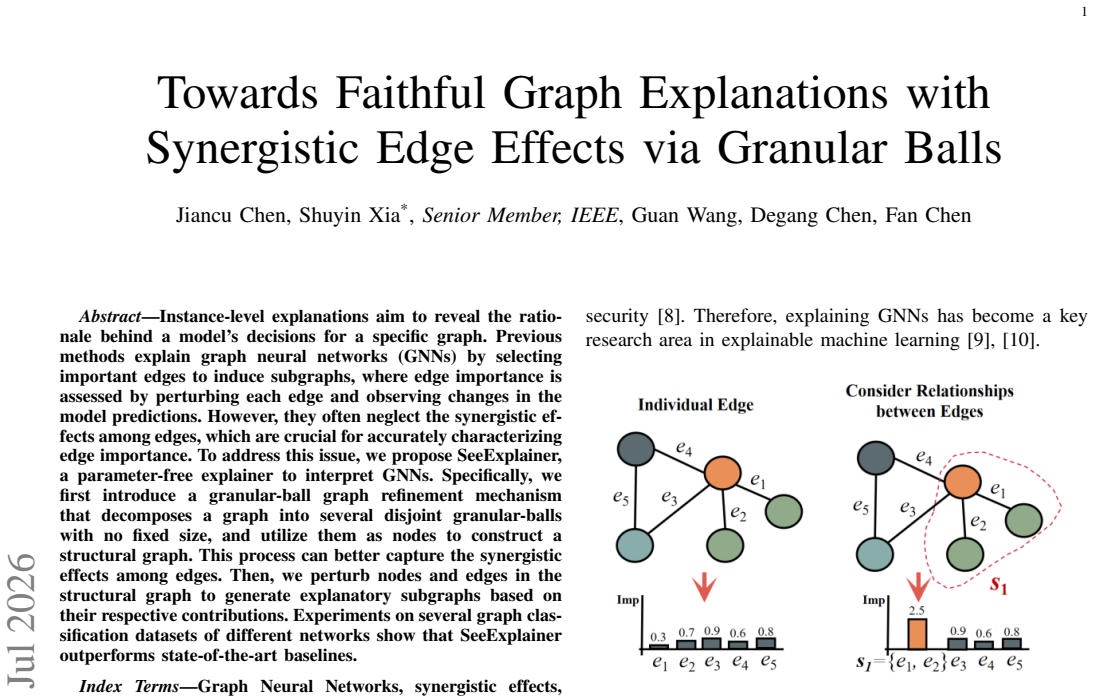
Explaining a GNN faithfully requires capturing how edges work together, and SeeExplainer does this by first grouping edges into granular balls.
Reviewed by Pith at T0; open to challenge. T0 means a machine referee read the full paper against a public rubric. the ladder, T0–T4 →
2026-08-01 07:36 UTC pith:XBFTUSFQ
load-bearing objection New granular-ball grouping mechanism for GNN explanations, but the evaluation's stability result is a definitional artifact and fidelity comparisons don't control for explanation size, so the headline claims don't hold. the 4 major comments →
Towards Faithful Graph Explanations with Synergistic Edge Effects via Granular Balls
The pith
A machine-rendered reading of the paper's core claim, the machinery that carries it, and where it could break.
Core claim
On its own terms, the central discovery is that a graph can be re-organized into a structural graph whose nodes are granular balls — disjoint subgraphs of variable size produced by a density-based splitting rule — and that scoring these balls as units, rather than scoring original edges one by one, yields explanatory subgraphs that better reproduce the GNN's predictions. The splitting rule starts with the whole graph, splits into √n balls around highest-degree centers, then recursively splits any ball whose two children have greater combined edge density than the parent. The resulting balls preserve the original edges inside them, so each ball acts as a composite feature. Contributions are m
What carries the argument
The granular-ball structural graph — a coarsened representation in which disjoint, adaptively sized subgraphs (granular balls) become nodes and edges between them become structural edges — is the central object. It carries the argument because it moves the unit of attribution from a single edge to a group of edges that share vertices, so that a functional group's contribution is evaluated as a whole rather than as a sum of parts. The density-based splitting condition (split when the two children's edge densities sum to more than the parent's density) determines the balls; the average-contribution threshold I(G) selects the final explanatory subgraph parameter-free.
Load-bearing premise
The fidelity and stability evaluations assume the method's output can be compared at multiple sparsity levels even though SeeExplainer returns one fixed subgraph with no sparsity parameter; the paper never specifies how sparsity enters the fidelity equations for its method.
What would settle it
Run SeeExplainer and a strong edge-only baseline (e.g., Eig-Search) while forcing both to output exactly the same number of kept edges (or the same induced-subgraph size) on the same GNN and datasets. If SeeExplainer's fidelity advantage vanishes when explanation sizes are equal, the claimed synergy benefit is not what drives the reported gains.
If this is right
- If SeeExplainer's claims hold, explanation methods no longer need a tunable explanation-size parameter; a threshold derived from the graph itself decides what to include.
- Chemical and biological substructures that a GNN actually relies on could be extracted as granular balls, giving domain experts directly inspectable motifs rather than scattered edges.
- Since the structural graph preserves original edges inside balls, the same decomposition can be reused across multiple explanation queries or for counterfactual analysis.
- The reported stability improvement suggests group-level attribution is less sensitive to arbitrary sparsity cutoffs than edge-level attribution.
- The method's complexity O((m+n)log n) makes synergy-aware explanation feasible for large graphs such as DD.
Where Pith is reading between the lines
- Editorial inference: the reported fidelity gains may be confounded by explanation size — granular-ball subgraphs tend to be larger than edge-only masks, and larger subgraphs mechanically raise fidelity under the Fidelity+ metric; a size-controlled comparison is needed to isolate the synergy effect.
- Editorial inference: the structural graph is built without regard to node features, yet GNNs with GIN/GCN read features; testing feature-aware splitting (e.g., by feature similarity) would reveal whether unsupervised geometry alone, or feature alignment, drives the improvement.
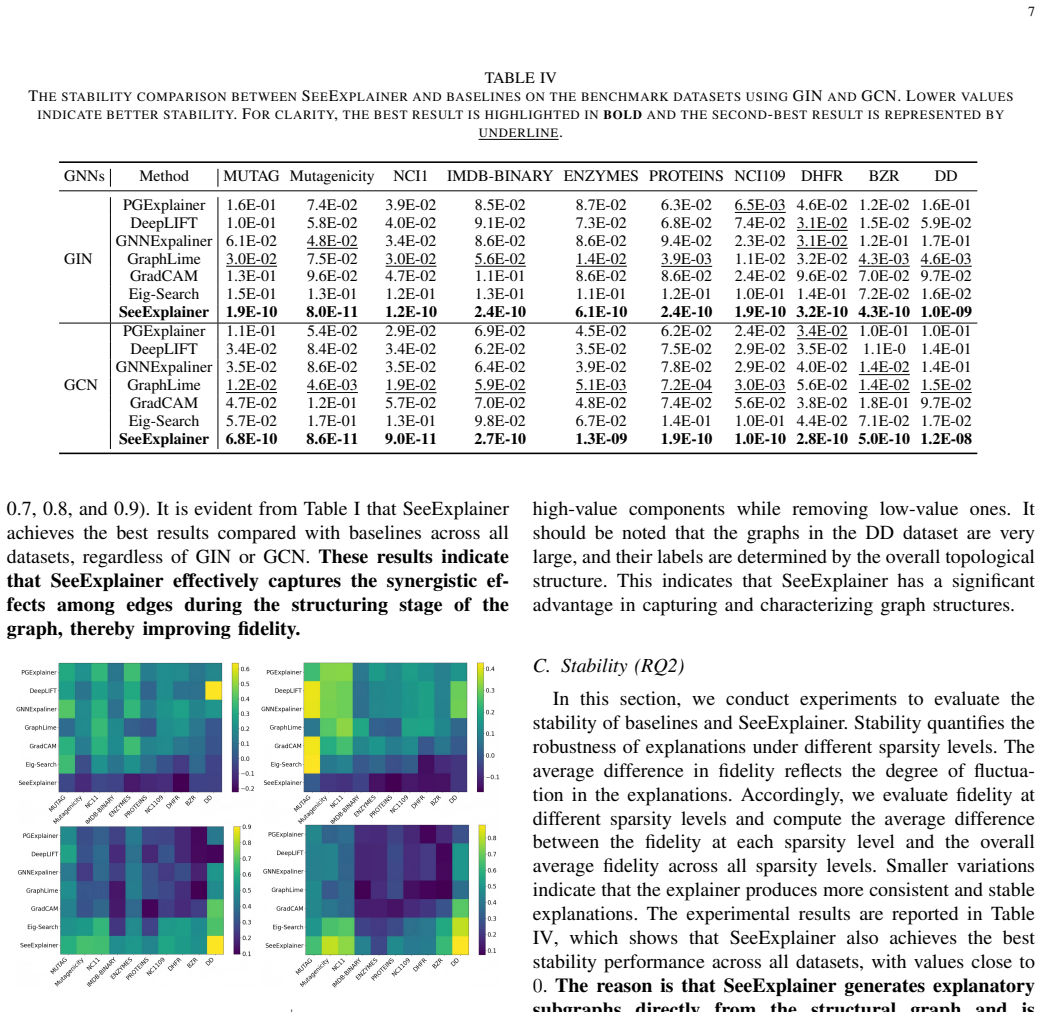
- Editorial inference: because SeeExplainer returns a single fixed subgraph, the near-zero stability values in Table IV likely reflect constancy across sparsity levels rather than robustness of ranking; a meaningful stability test would re-run the explanation under input or model perturbations.
- Editorial inference: the √n initial centers are an empirical constant; varying it between, say, 2 and n/2 and tracking fidelity would make the method's 'parameter-free' claim more credible.
Editorial analysis
A structured set of objections, weighed in public.
Referee Report
Summary. The paper proposes SeeExplainer, a GNN instance-level explainer. It partitions an input graph into disjoint granular balls via degree-based BFS splitting and a quality criterion, abstracts these balls as nodes of a structural graph, computes node and edge contributions by measuring prediction differences under perturbation, and selects an explanatory subgraph by thresholding these contributions against the graph-level average. The central claims are that the granular-ball structural graph captures synergistic effects among edges and that SeeExplainer outperforms PGExplainer, DeepLIFT, GNNExplainer, GraphLime, GradCAM, and Eig-Search in fidelity and stability on ten graph-classification datasets.
Significance. The motivating observation—that edge importance can be non-additive when edges form functional substructures—is legitimate and relevant for GNN explainability. If the proposed decomposition were shown to yield faithful and compact explanations, the paper would make a useful contribution. The authors also provide a large experimental comparison, ablations, case studies, and a complexity analysis. However, the evaluation protocol is not valid for SeeExplainer as presented: the method has no sparsity parameter, so the stability metric is definitionally near zero, and the fidelity comparisons do not control for the size of the returned explanations. These issues affect every reported empirical claim, so the current evidence does not support the paper's main conclusions.
major comments (4)
- [§V-C, Eqs. (12)–(15), Algorithm 2] Algorithm 2 returns a single subgraph: a node or edge is included if its contribution exceeds I(G). There is no sparsity level s_k in the algorithm. Yet Eqs. (12)–(14) define fidelity at a sparsity level and Eq. (15) defines stability as the variation of fidelity across u sparsity levels. The paper never states how SeeExplainer is evaluated at s_k=0.5,…,0.9. If the same fixed explanation is used at every s_k, fidelity is constant and S(s_k) is zero up to floating-point round-off. This exactly matches the ~1e-10 values in Table IV. Thus the RQ2 stability result is a definitional artifact, not an empirical property.
- [Table I, §V-B] The fidelity comparison is not size-controlled. Baselines are evaluated with sparsity constraints that fix the number of retained edges, while SeeExplainer's threshold can return an arbitrary—and potentially much larger—subgraph. Because Fidelity+ in Eq. (12) measures the prediction change when a subgraph is removed, a larger retained subgraph tends to inflate Fidelity+, and the combined fidelity in Eq. (14) can be inflated as well. Without reporting the size distribution of SeeExplainer's explanations or matching explanation sizes across methods, the large gains in Table I cannot be attributed to better explanations.
- [§IV-B1, Eqs. (10)–(11)] The operations G\v'_i and G\e'_j are undefined. Here v'_i is a granular ball—a subset of original nodes—and e'_j is an inter-ball edge in the structural graph, not necessarily an edge in G. The paper states that the original structure is preserved, but it never defines how removing a structural node or edge acts on the original graph. This makes the contribution scores in Eqs. (10)–(11) and the resulting explanatory subgraph ill-defined.
- [§IV-B and §V-B] The selection rule and the evaluation metric share the same prediction-difference objective. Contributions I(v'_i) and I(e'_j) are measured by ϕ(G)−ϕ(G\·), and Fidelity+ measures ϕ(G)−ϕ(G\delete). SeeExplainer therefore selects components that score well on the very criterion used to evaluate it. The reported high fidelity is partly self-fulfilling. An independent metric—or at least a clear separation between selection and evaluation—is needed to support the claim of superior faithfulness.
minor comments (5)
- [Tables I, IV] Typos: 'GNNExpaliner' appears in Tables I and IV; 'F idelity' is broken in Eq. (12) and the Metrics paragraph; Table IV (GCN/BZR/DeepLIFT) reports '1.1E-0' with a missing digit.
- [Algorithm 1, Eq. (6)] A granular ball with one node cannot be split into two centers as required by Eq. (6); a termination condition for singleton balls is missing.
- [Eq. (4), §IV-A] Center selection should be stated as 'top-s nodes with largest degree'; the argmax notation is ambiguous. Also, s=√n is an empirical setting, so the paper should clarify whether 'parameter-free' means 'no learned parameters' or 'no user-specified hyperparameters.'
- [§IV-A] The term 'non-isomorphic factorization' is used but never defined; the BFS splitting procedure does not obviously implement it. This should be clarified or removed.
- [Tables I, IV, V, VI] Tables I, IV, V, and VI report only point estimates. Since models are trained 20 times, standard deviations or statistical significance tests should be reported for the fidelity and stability comparisons.
Circularity Check
SeeExplainer's near-zero stability is a definitional artifact: the method returns one fixed explanation with no sparsity parameter, so Eq. (15) is ~0 by construction.
specific steps
-
self definitional
[Section V-A (Metrics, Eqs. 12–15), Section V-C (Stability), Algorithm 2, Table IV]
"Stability is defined as the difference between the average fidelity across all sparsity levels and the fidelity at a specific sparsity level. A smaller difference indicates stronger stability. Formally, S(s_k) = |1/u sum_{k=1}^u Fidelity(G,s_k) - Fidelity(G,s_k)|. ... The reason is that SeeExplainer generates explanatory subgraphs directly from the structural graph and is therefore unaffected by parameter settings."
Algorithm 2 takes no sparsity input: it thresholds I(G), I(v'_i), and I(e'_j) and returns a single fixed explanatory subgraph. Yet Eqs. (12)–(15) define fidelity and stability as functions of a sparsity level s_k, and Table I reports averages over s_k = 0.5,...,0.9. If the same fixed explanation is used at every sparsity level, Fidelity(G,s_k) is identical for all k, so Eq. (15) is zero up to floating-point precision. The ~1e-10 values in Table IV are therefore a direct consequence of the metric/output mismatch, not an empirical finding that SeeExplainer is stable.
full rationale
The load-bearing circularity is confined to the stability evaluation. The paper's own equations define stability as variation of fidelity across sparsity levels, but SeeExplainer is explicitly parameter-free and Algorithm 2 returns one subgraph with no sparsity mechanism; hence the reported near-zero stability is definitional. The fidelity comparison also lacks a stated mapping from s_k to SeeExplainer's output, so explanation size is not controlled, which is a serious confound, but the paper does not provide enough detail to prove that the fidelity advantage reduces purely by construction. The granular-ball/synergy construction is asserted rather than derived, but that is a validation gap, not a circular derivation. Self-citations to prior granular-ball work are not load-bearing for the experimental claims. Score 6 reflects one central evaluation result that is forced by construction, while the method itself is not wholly identical to its evaluation metric.
Axiom & Free-Parameter Ledger
free parameters (4)
- Initial granular-ball count s = sqrt(n) =
sqrt(n) (graph-dependent)
- Fine-split center count (2) =
2
- Split criterion Q(child1)+Q(child2) > Q(parent) =
Edge-density ratio comparison
- Selection threshold I(G) =
Average of per-edge prediction drops
axioms (5)
- domain assumption Global precedence cognitive rule implies coarse-to-fine granular decomposition is a useful representation.
- ad hoc to paper Degree-based BFS splitting into disjoint balls yields substructures that are meaningful for the model's decision and capture synergistic edge effects.
- ad hoc to paper Q(GB)=|E_GB|/|V_GB| is a valid quality measure for deciding splits.
- ad hoc to paper Removing a structural node/edge (G\v'_i, G\e'_j) is a well-defined operation on the original graph.
- domain assumption The pretrained GNN's prediction differences phi(G)-phi(G\S) are meaningful additive importance scores.
Cite this review
Pith. "Pith review of Towards Faithful Graph Explanations with Synergistic Edge Effects via Granular Balls." pith.science (2026). https://pith.science/paper/XBFTUSFQ
@misc{pith2026260721381,
  author       = {Pith},
  title        = {Pith review of: Towards Faithful Graph Explanations with Synergistic Edge Effects via Granular Balls},
  year         = {2026},
  howpublished = {\url{https://pith.science/paper/XBFTUSFQ}},
  note         = {Machine review of arXiv:2607.21381}
}
read the original abstract
Instance-level explanations aim to reveal the rationale behind a model's decisions for a specific graph. Previous methods explain graph neural networks (GNNs) by selecting important edges to induce subgraphs, where edge importance is assessed by perturbing each edge and observing changes in the model predictions. However, they often neglect the synergistic effects among edges, which are crucial for accurately characterizing edge importance. To address this issue, we propose SeeExplainer, a parameter-free explainer to interpret GNNs. Specifically, we first introduce a granular-ball graph refinement mechanism that decomposes a graph into several disjoint granular-balls with no fixed size, and utilize them as nodes to construct a structural graph. This process can better capture the synergistic effects among edges. Then, we perturb nodes and edges in the structural graph to generate explanatory subgraphs based on their respective contributions. Experiments on several graph classification datasets of different networks show that SeeExplainer outperforms state-of-the-art baselines.
Figures



Reference graph
Works this paper leans on
-
[1]
Active and semi-supervised graph neural networks for graph classification,
Y . Xie, S. Lv, Y . Qian, C. Wen, and J. Liang, “Active and semi-supervised graph neural networks for graph classification,”IEEE Transactions on Big Data, vol. 8, no. 4, pp. 920–932, 2022
2022
-
[2]
Semisuper- vised graph neural networks for graph classification,
Y . Xie, Y . Liang, M. Gong, A. K. Qin, Y .-S. Ong, and T. He, “Semisuper- vised graph neural networks for graph classification,”IEEE Transactions on Cybernetics, vol. 53, no. 10, pp. 6222–6235, 2022
2022
-
[3]
Edge classification on graphs: New directions in topological imbalance,
X. Cheng, Y . Wang, Y . Liu, Y . Zhao, C. C. Aggarwal, and T. Derr, “Edge classification on graphs: New directions in topological imbalance,” in Proceedings of the Eighteenth ACM International Conference on Web Search and Data Mining, 2025, pp. 392–400
2025
-
[4]
A simple yet effective baseline for non-attributed graph classification,
C. Cai and Y . Wang, “A simple yet effective baseline for non-attributed graph classification,” arXiv preprint arXiv:1811.03508, 2018
Pith/arXiv arXiv 2018
-
[5]
Tudataset: A collection of benchmark datasets for learning with graphs,
C. Morris, N. M. Kriege, F. Bause, K. Kersting, P. Mutzel, and M. Neumann, “Tudataset: A collection of benchmark datasets for learning with graphs,” arXiv preprint arXiv:2007.08663, 2020
Pith/arXiv arXiv 2007
-
[6]
Protein function prediction via graph kernels,
K. M. Borgwardt, C. S. Ong, S. Schonauer, S. Vishwanathan, A. J. Smola, and H.-P. Kriegel, “Protein function prediction via graph kernels,” Bioinformatics, vol. 21, no. suppl 1, pp. i47–i56, 2005
2005
-
[7]
Spline-fitting with a genetic algorithm: A method for developing classification structure activity relationships,
J. J. Sutherland, L. A. O’brien, and D. F. Weaver, “Spline-fitting with a genetic algorithm: A method for developing classification structure activity relationships,”Journal of Chemical Information and Computer Sciences, vol. 43, no. 6, pp. 1906–1915, 2003
1906
-
[8]
Towards a rigorous science of interpretable machine learning,
F. Doshi-Velez and B. Kim, “Towards a rigorous science of interpretable machine learning,” arXiv preprint arXiv:1702.08608, 2017. 10
Pith/arXiv arXiv 2017
-
[9]
Explainability in graph neural networks: A taxonomic survey,
H. Yuan, H. Yu, S. Gui, and S. Ji, “Explainability in graph neural networks: A taxonomic survey,”IEEE Transactions on Pattern Analysis and Machine Intelligence, vol. 45, no. 5, pp. 5782–5799, 2022
2022
-
[10]
Gnnex- plainer: Generating explanations for graph neural networks,
Z. Ying, D. Bourgeois, J. You, M. Zitnik, and J. Leskovec, “Gnnex- plainer: Generating explanations for graph neural networks,”Advances in Neural Information Processing Systems, vol. 32, 2019
2019
-
[11]
Xgnn: Towards model-level explanations of graph neural networks,
H. Yuan, J. Tang, X. Hu, and S. Ji, “Xgnn: Towards model-level explanations of graph neural networks,” inProceedings of the 26th ACM SIGKDD International Conference on Knowledge Discovery & Data Mining, 2020, pp. 430–438
2020
-
[12]
Gnninterpreter: A probabilistic genera- tive model-level explanation for graph neural networks,
X. Wang and H.-W. Shen, “Gnninterpreter: A probabilistic genera- tive model-level explanation for graph neural networks,” arXiv preprint arXiv:2209.07924, 2022
Pith/arXiv arXiv 2022
-
[13]
D4explainer: In-distribution explanations of graph neural network via discrete denoising diffusion,
J. Chen, S. Wu, A. Gupta, and R. Ying, “D4explainer: In-distribution explanations of graph neural network via discrete denoising diffusion,” Advances in Neural Information Processing Systems, vol. 36, pp. 78 964–78 986, 2023
2023
-
[14]
Gnnboundary: Towards explaining graph neural networks through the lens of decision boundaries,
X. Wang and H. W. Shen, “Gnnboundary: Towards explaining graph neural networks through the lens of decision boundaries,” in TheTwelfth International Conference on Learning Representations, 2024
2024
-
[15]
Graphon-explainer: Generating model- level explanations for graph neural networks using graphons,
S. Saha and S. Bandyopadhyay, “Graphon-explainer: Generating model- level explanations for graph neural networks using graphons,”Transac- tions on Machine Learning Research, 2024
2024
-
[16]
Graphlime: Local interpretable model explanations for graph neural networks,
Q. Huang, M. Yamada, Y . Tian, D. Singh, and Y . Chang, “Graphlime: Local interpretable model explanations for graph neural networks,”IEEE Transactions on Knowledge and Data Engineering, vol. 35, no. 7, pp. 6968–6972, 2022
2022
-
[17]
Eig-search: Generating edge-induced subgraphs for gnn explanation in linear time,
S. Lu, B. Liu, K. G. Mills, J. He, and D. Niu, “Eig-search: Generating edge-induced subgraphs for gnn explanation in linear time,” inForty-first International Conference on Machine Learning, 2024
2024
-
[18]
Interpreting graph neural networks for nlp with differentiable edge masking,
M. S. Schlichtkrull, N. De Cao, and I. Titov, “Interpreting graph neural networks for nlp with differentiable edge masking,” arXiv preprint arXiv:2010.00577, 2020
Pith/arXiv arXiv 2010
-
[19]
On explainability of graph neural networks via subgraph explorations,
H. Yuan, H. Yu, J. Wang, K. Li, and S. Ji, “On explainability of graph neural networks via subgraph explorations,” inInternational Conference on Machine Learning. PMLR, 2021, pp. 12 241–12 252
2021
-
[20]
Parameterized explainer for graph neural network,
D. Luo, W. Cheng, D. Xu, W. Yu, B. Zong, H. Chen, and X. Zhang, “Parameterized explainer for graph neural network,”Advances in Neural Information Processing Systems, vol. 33, pp. 19 620–19 631, 2020
2020
-
[21]
Zhang and G
P. Zhang and G. Chartrand, Introduction to graph theory. Tata McGraw- Hill New York, 2006, vol. 2, no. 2.1
2006
-
[22]
Network flows: Theory, algorithms, and applications,
G. R. Waissi, “Network flows: Theory, algorithms, and applications,” 1994
1994
-
[23]
A fast adaptive k-means with no bounds,
S. Xia, D. Peng, D. Meng, C. Zhang, G. Wang, E. Giem, W. Wei, and Z. Chen, “A fast adaptive k-means with no bounds,”IEEE Transactions on Pattern Analysis and Machine Intelligence, 2020
2020
-
[24]
An efficient and adaptive granular-ball generation method in classification problem,
S. Xia, X. Dai, G. Wang, X. Gao, and E. Giem, “An efficient and adaptive granular-ball generation method in classification problem,”IEEE Transactions on Neural Networks and Learning Systems, vol. 35, no. 4, pp. 5319–5331, 2024
2024
-
[25]
Online graph dictionary learning
C. Vincent-Cuaz, T. Vayer, R. Flamary, M. Corneli, and N. Courty, “Online graph dictionary learning”,International Conference on Machine Learning. PMLR, 2021, pp. 10 564–10 574
2021
-
[26]
Semi-supervised classification with graph convolutional networks,
T. N. Kipf and M. Welling, “Semi-supervised classification with graph convolutional networks,” CoRR, vol. abs/1609.02907, 2016. [Online]. Available: http://arxiv.org/abs/1609.02907
Pith/arXiv arXiv 2016
-
[27]
How powerful are graph neural networks?
K. Xu, W. Hu, J. Leskovec, and S. Jegelka, “How powerful are graph neural networks?” 2019. [Online]. Available: https://arxiv.org/abs/1810.00826
Pith/arXiv arXiv 2019
-
[28]
Explainability methods for graph convolutional neural networks,
P. E. Pope, S. Kolouri, M. Rostami, C. E. Martin, and H. Hoffmann, “Explainability methods for graph convolutional neural networks,” in Proceedings of the IEEE/CVF Conference on Computer Vision and Pattern Recognition (CVPR), June 2019
2019
-
[29]
Explainability techniques for graph convolutional networks,
F. Baldassarre and H. Azizpour, “Explainability techniques for graph convolutional networks,” arXiv preprint arXiv:1905.13686, 2019
Pith/arXiv arXiv 1905
-
[30]
Degree: Decomposition based explanation for graph neural networks,
Q. Feng, N. Liu, F. Yang, R. Tang, M. Du, and X. Hu, “Degree: Decomposition based explanation for graph neural networks,” arXiv preprint arXiv:2305.12895, 2023
Pith/arXiv arXiv 2023
-
[31]
Graphsvx: Shapley value explanations for graph neural networks,
A. Duval and F. D. Malliaros, “Graphsvx: Shapley value explanations for graph neural networks,” inJoint European Conference on Machine Learn- ing and Knowledge Discovery in Databases. Springer, 2021, pp.302–318
2021
-
[32]
Dis- till n’explain: explaining graph neural networks using simple surrogates,
T. Pereira, E. Nascimento, L. E. Resck, D. Mesquita, and A. Souza, “Dis- till n’explain: explaining graph neural networks using simple surrogates,” inInternational Conference on Artificial Intelligence and Statistics. PMLR, 2023, pp. 6199–6214
2023
-
[33]
Relex: A model-agnostic relational model explainer,
Y . Zhang, D. Defazio, and A. Ramesh, “Relex: A model-agnostic relational model explainer,” inProceedings of the 2021 AAAI/ACM Conference on AI, Ethics, and Society, 2021, pp. 1042–1049
2021
-
[34]
Towards multi- grained explainability for graph neural networks,
X. Wang, Y . Wu, A. Zhang, X. He, and T.-S. Chua, “Towards multi- grained explainability for graph neural networks,”Advances in Neural Information Processing Systems, vol. 34, pp. 18 446–18 458, 2021
2021
-
[35]
Zorro: Valid, sparse, and stable explanations in graph neural networks,
T. Funke, M. Khosla, M. Rathee, and A. Anand, “Zorro: Valid, sparse, and stable explanations in graph neural networks,”IEEE Transactions on Knowledge and Data Engineering, vol. 35, no. 8, pp. 8687–8698, 2022
2022
-
[36]
Gstarx: Explaining graph neural networks with structure-aware cooperative games,
S. Zhang, Y . Liu, N. Shah, and Y . Sun, “Gstarx: Explaining graph neural networks with structure-aware cooperative games,”Advances in Neural Information Processing Systems, vol. 35, pp. 19 810–19 823, 2022
2022
-
[37]
Topological structure in visual perception,
L. Chen, “Topological structure in visual perception,”Science, vol. 218, no. 4573, pp. 699–700, 1982
1982
-
[38]
Dgcc: data-driven granular cognitive computing,
G. Wang, “Dgcc: data-driven granular cognitive computing,”Granular Computing, vol. 2, no. 4, pp. 343–355, 2017
2017
-
[39]
Gb-rvfl: Fusion of randomized neural network and granular ball computing,
M. Sajid, A. Quadir, M. Tanveer, A. D. N. Initiative et al., “Gb-rvfl: Fusion of randomized neural network and granular ball computing,” Pattern Recognition, vol. 159, p. 111142, 2025
2025
-
[40]
Ball kk-means: Fast adaptive clustering with no bounds,
S. Xia, D. Peng, D. Meng, C. Zhang, G. Wang, E. Giem, W. Wei, and Z. Chen, “Ball kk-means: Fast adaptive clustering with no bounds,”IEEE Transactions on Pattern Analysis and Machine Intelligence, vol. 44, no. 1, pp. 87–99, 2022
2022
-
[41]
Gbct: efficient and adaptive clustering via granular-ball computing for complex data,
S. Xia, B. Shi, Y . Wang, J. Xie, G. Wang, and X. Gao, “Gbct: efficient and adaptive clustering via granular-ball computing for complex data,” IEEE Transactions on Neural Networks and Learning Systems, 2025
2025
-
[42]
Generation of granular-balls for clus- tering based on the principle of justifiable granularity,
Z. Jia, Z. Zhang, and W. Pedrycz, “Generation of granular-balls for clus- tering based on the principle of justifiable granularity,”IEEE Transactions on Cybernetics, 2025
2025
-
[43]
Granular-ball regeneration clustering with principle of justifiable gran- ularity,
W. Li, L. Wei, W. Pedrycz, W. Ding, C. Zhang, T. Zhan, and S. Xia, “Granular-ball regeneration clustering with principle of justifiable gran- ularity,”IEEE Transactions on Neural Networks and Learning Systems, 2025
2025
-
[44]
Aw-gbgae: an adaptive weighted graph autoencoder based on granular-balls for general data clustering,
J. Xie, Y . Cheng, S. Xia, C. Hua, G. Wang, and X. Gao, “Aw-gbgae: an adaptive weighted graph autoencoder based on granular-balls for general data clustering,”IEEE Transactions on Pattern Analysis and Machine Intelligence, 2025
2025
-
[45]
Gbrs: A unified granular-ball learning model of pawlak rough set and neighborhood rough set,
S. Xia, C. Wang, G. Wang, X. Gao, W. Ding, J. Yu, Y . Zhai, and Z. Chen, “Gbrs: A unified granular-ball learning model of pawlak rough set and neighborhood rough set,”IEEE Transactions on Neural Networks and Learning Systems, vol. 36, no. 1, pp. 1719–1733, 2025
2025
-
[46]
Constructing three-way decision with fuzzy granular-ball rough sets based on uncertainty invariance,
J. Yang, Z. Liu, G. Wang, Q. Zhang, S. Xia, D. Wu, and Y . Liu, “Constructing three-way decision with fuzzy granular-ball rough sets based on uncertainty invariance,”IEEE Transactions on Fuzzy Systems, 2025
2025
-
[47]
Fuzzy granule density-based outlier detection with multi-scale granular balls,
C. Gao, X. Tan, J. Zhou, W. Ding, and W. Pedrycz, “Fuzzy granule density-based outlier detection with multi-scale granular balls,”IEEE Transactions on Knowledge and Data Engineering, 2025
2025
-
[48]
Graph coarsening via supervised granular-ball for scalable graph neural network training,
S. Xia, X. Ma, Z. Liu, C. Liu, S. Zhao, and G. Wang, “Graph coarsening via supervised granular-ball for scalable graph neural network training,” inProceedings of the AAAI Conference on Artificial Intelligence, 2025, pp. 12 872–12 880
2025
-
[49]
D. B. West et al., Introduction to graph theory. Prentice hall Upper Saddle River, 2001, vol. 2
2001
-
[50]
A new internal index based on density core for clustering validation,
J. Xie, Z.-Y . Xiong, Q.-Z. Dai, X.-X. Wang, and Y .-F. Zhang, “A new internal index based on density core for clustering validation,”Information Sciences, vol. 506, pp. 346–365, 2020
2020
-
[51]
The upper bound of the optimal number of clusters in fuzzy clustering,
J. Yu and Q. Cheng, “The upper bound of the optimal number of clusters in fuzzy clustering,” Science in China Series:Information Sciences, vol. 44, no. 2, pp. 119–125, 2001
2001
-
[52]
T. H. Cormen, C. E. Leiserson, R. L. Rivest, and C. Stein, Introduction to algorithms. MIT press, 2022
2022
-
[53]
A. K. Debnath, R. L. Lopez de Compadre, G. Debnath, A. J. Shusterman, and C. Hansch, “Structure-activity relationship of muta- genic aromatic and heteroaromatic nitro compounds. correlation with molecular orbital energies and hydrophobicity,”Journal of Medicinal Chemistry, vol. 34, no. 2, pp. 786–797, 1991. [Online]. Available: https://doi.org/10.1021/jm00106a046
-
[54]
Derivation and validation of tox- icophores for mutagenicity prediction,
J. Kazius, R. McGuire, and R. Bursi, “Derivation and validation of tox- icophores for mutagenicity prediction,”Journal of Medicinal Chemistry, vol. 48, no. 1, pp. 312–320, 2005, pMID: 15634026. [Online]. Available: https://doi.org/10.1021/jm040835a
-
[55]
Comparison of descriptor spaces for chemical compound retrieval and classification,
N. Wale, I. A. Watson, and G. Karypis, “Comparison of descriptor spaces for chemical compound retrieval and classification,”Knowledge and Information Systems, vol. 14, no. 3, pp. 347–375, 2008. 11
2008
-
[56]
Fast unfolding of communities in large networks,
V . D. Blondel, J.-L. Guillaume, R. Lambiotte, and E. Lefebvre, “Fast unfolding of communities in large networks,”Journal of Statistical Mechanics: Theory and Experiment, vol. 2008, no. 10, p. P10008, 2008
2008
-
[57]
Weisfeiler and leman go sparse: Towards scalable higher-order graph embeddings,
C. Morris, G. Rattan, and P. Mutzel, “Weisfeiler and leman go sparse: Towards scalable higher-order graph embeddings,”Advances in Neural Information Processing Systems, vol. 33, pp. 21 824–21 840, 2020
2020
-
[58]
A unified view of gradient-based attribution methods for deep neu- ral networks,
M. Ancona, E. Ceolini, A. C. Oztireli, and M. H. Gross, “A unified view of gradient-based attribution methods for deep neu- ral networks,” CoRR, vol. abs/1711.06104, 2017. [Online]. Avail- able:http://arxiv.org/abs/1711.06104
Pith/arXiv arXiv 2017
-
[59]
Explainability methods for graph convolutional neural networks,
P. E. Pope, S. Kolouri, M. Rostami, C. E. Martin, and H. Hoffmann, “Explainability methods for graph convolutional neural networks,” in Proceedings of the IEEE/CVF Conference on Computer Vision and Pattern Recognition, 2019, pp. 10 772–10 781
2019
This paper was first reviewed by deepseek-v4-flash on August 1, 2026.
discussion (0)
Sign in with ORCID, Apple, or X to comment. Anyone can read and Pith papers without signing in.