Effective degrees of freedom for surface finish defect detection and classification
Pith reviewed 2026-05-25 19:52 UTC · model grok-4.3
The pith
Reduced-rank cubic regression splines extract effective degrees of freedom that serve as features enabling near-zero misclassification of surface defects on specular car bodies.
A machine-rendered reading of the paper's core claim, the machinery that carries it, and where it could break.
Core claim
The central claim is that the effective degrees of freedom computed from reduced-rank cubic regression splines fitted to structured-light images provide a feature vector that reliably separates defect from non-defect surfaces, allowing standard classifiers such as k-nearest neighbours to achieve near zero misclassification error rates on real data from a Volvo plant, while probability-based metrics offer alternatives for performance evaluation with uncertainty quantification.
What carries the argument
Effective degrees of freedom from reduced-rank cubic regression splines on structured-light images, used as the feature vector for classification.
If this is right
- The approach reaches near zero misclassification error when applying standard learning classifiers.
- Probability based performance evaluation metrics provide means for uncertainty estimation of the predictive performance.
- The proposed method is much more efficient than the compared methods on the pilot system images.
- Automated detection of small size defects on specular surfaces becomes feasible with high accuracy.
Where Pith is reading between the lines
- If the features work well, similar spline smoothing might extract useful information from other image types in quality control.
- The use of effective degrees of freedom highlights how model complexity measures can serve as discriminative features beyond traditional statistics.
- Extending the probability metrics to other domains could improve reliability assessments in machine learning applications for manufacturing.
Load-bearing premise
That the effective degrees of freedom computed from reduced-rank cubic regression splines on structured-light images form a feature vector that reliably separates defect from non-defect surfaces.
What would settle it
A test on an independent set of structured-light images from car bodies showing that the k-nearest neighbor classifier using these effective degrees of freedom features has a misclassification rate significantly above zero.
Figures




read the original abstract
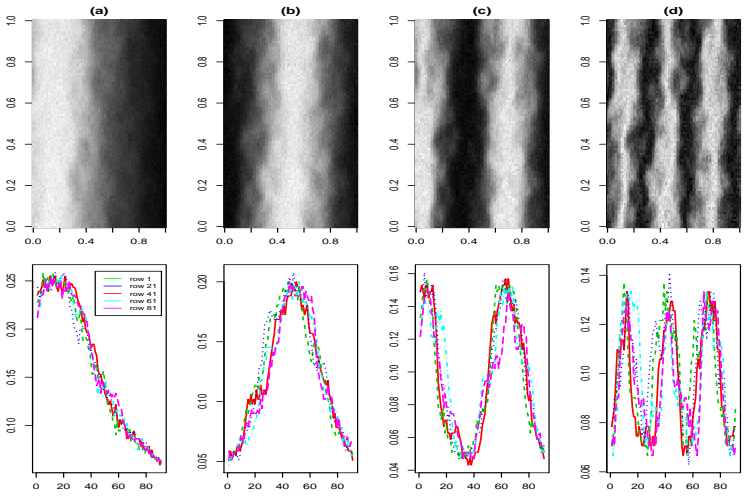
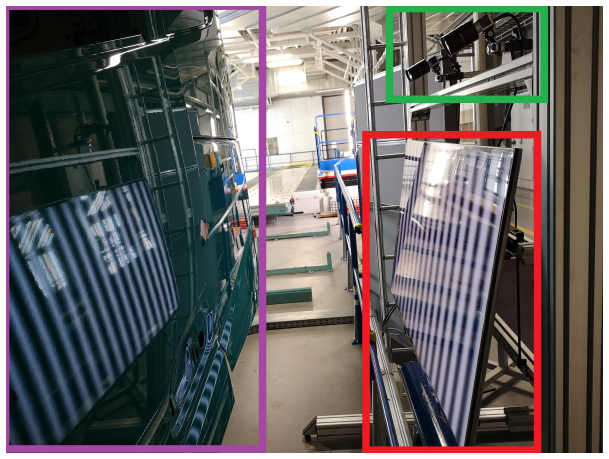
One of the primary concerns of product quality control in the automotive industry is an automated detection of defects of small sizes on specular car body surfaces. A new statistical learning approach is presented for surface finish defect detection based on spline smoothing method for feature extraction and $k$-nearest neighbour probabilistic classifier. Since the surfaces are specular, structured lightning reflection technique is applied for image acquisition. Reduced rank cubic regression splines are used to smooth the pixel values while the effective degrees of freedom of the obtained smooths serve as components of the feature vector. A key advantage of the approach is that it allows reaching near zero misclassification error rate when applying standard learning classifiers. We also propose probability based performance evaluation metrics as alternatives to the conventional metrics. The usage of those provides the means for uncertainty estimation of the predictive performance of a classifier. Experimental classification results on the images obtained from the pilot system located at Volvo GTO Cab plant in Ume{\aa}, Sweden, show that the proposed approach is much more efficient than the compared methods.
Editorial analysis
A structured set of objections, weighed in public.
Referee Report
Summary. The paper proposes a pipeline for automated detection of small defects on specular automotive surfaces: structured-light images are smoothed via reduced-rank cubic regression splines; the vector of effective degrees of freedom from each smoother is used as the feature representation; a k-nearest-neighbour probabilistic classifier is applied; probability-based performance metrics are introduced for uncertainty quantification. Experiments on images from a Volvo pilot system are said to yield near-zero misclassification and clear superiority over the compared methods.
Significance. If the central empirical claim holds, the work supplies a compact, interpretable feature set derived from spline smoothers that could be useful for industrial surface inspection. The introduction of probability-based metrics is a constructive addition that allows uncertainty statements around classifier performance.
major comments (2)
- [Abstract] Abstract: the headline claim that the method 'allows reaching near zero misclassification error rate' is presented without any numerical results, sample sizes, cross-validation protocol, or error-bar information, so the data-to-claim link cannot be assessed.
- [Feature extraction] Feature-extraction step (paragraph describing spline smoothing): because each image is represented by a single global reduced-rank cubic regression spline, localized defects can be absorbed into the residual without materially changing the trace of the smoother matrix. No knot-placement strategy, rank-reduction details, or per-image fitting procedure is supplied that would establish sensitivity to the defect scale of interest.
minor comments (2)
- [Abstract] Abstract: 'structured lightning reflection technique' is presumably intended to read 'structured lighting reflection technique'.
- [Abstract] The abstract states that probability-based metrics are proposed but does not name or define them.
Simulated Author's Rebuttal
We thank the referee for the constructive comments on our manuscript. We address each major comment point by point below, indicating the revisions we will make.
read point-by-point responses
-
Referee: [Abstract] Abstract: the headline claim that the method 'allows reaching near zero misclassification error rate' is presented without any numerical results, sample sizes, cross-validation protocol, or error-bar information, so the data-to-claim link cannot be assessed.
Authors: We agree that the abstract would be strengthened by including supporting numerical details. In the revised version we will update the abstract to report the specific misclassification rates obtained (near-zero on the Volvo dataset), the number of images and defect classes, the cross-validation protocol, and any uncertainty quantification used. revision: yes
-
Referee: [Feature extraction] Feature-extraction step (paragraph describing spline smoothing): because each image is represented by a single global reduced-rank cubic regression spline, localized defects can be absorbed into the residual without materially changing the trace of the smoother matrix. No knot-placement strategy, rank-reduction details, or per-image fitting procedure is supplied that would establish sensitivity to the defect scale of interest.
Authors: We will expand the methods section to supply the requested details. Knots are placed uniformly at a fixed spacing chosen to match the expected defect scale; rank reduction is performed by truncating the basis after penalization with a smoothing parameter selected by GCV on each image individually. Although the smoother is global, defects on specular surfaces produce systematic changes in the reflection intensity profile that alter the penalized fit and therefore the trace of the smoother matrix. We will add an explicit description of the fitting procedure together with a small-scale sensitivity study confirming that defects of the sizes observed in the Volvo images produce measurable shifts in effective degrees of freedom. revision: yes
Circularity Check
No circularity: empirical pipeline with independent feature extraction and classification
full rationale
The paper presents an applied statistical learning method: reduced-rank cubic regression splines are fit to structured-light images to extract effective degrees of freedom as a feature vector, which is then input to a kNN probabilistic classifier. No derivation chain, uniqueness theorem, or prediction step is claimed that reduces by construction to its own inputs. The central performance claim (near-zero misclassification) is presented as an empirical result on Volvo plant data, not as a mathematical reduction. No self-citations are invoked as load-bearing premises, and the effective-df computation follows standard spline smoothing theory without re-deriving or renaming its own outputs. The work is self-contained against external benchmarks.
Axiom & Free-Parameter Ledger
Reference graph
Works this paper leans on
-
[1]
L. Armesto, J. Tornero, A. Herraez, and J. Asensio. Inspection system based on artificial vision for paint defects detection on cars bodies. In Proceedings of the IEEE International Conference on Robotics and Automation (ICRA 2011), Shanghai, China, 9–13 May 2011. IEEE, 2011
work page 2011
-
[2]
FNN: Fast Nearest Neighbor Search Algorithms and Applications, 2018
Alina Beygelzimer, Sham Kakadet, John Langford, Sunil Arya, David Mount, and Shengqiao Li. FNN: Fast Nearest Neighbor Search Algorithms and Applications, 2018. URL https://CRAN.R-project.org/package=FNN. R package version 1.1.2.2
work page 2018
-
[3]
C.M. Bishop. Pattern Recognition and Machine Learning. Springer, 2007
work page 2007
-
[4]
A bayesian reassessment of nearest-neighbor classification
Lionel Cucala, Jean-Michel Marin, Christian P Robert, and D Michael Titterington. A bayesian reassessment of nearest-neighbor classification. Journal of the American Statistical Association, 104 0 (485): 0 263--273, 2009
work page 2009
-
[5]
N. Dalal and B. Triggs. Histograms of oriented gradients for human detection. In 2005 IEEE Computer Society Conference on Computer Vision and Pattern Recognition (CVPR'05), volume 1, pages 886--893 vol. 1, June 2005. doi:10.1109/CVPR.2005.177
-
[6]
Ten Lectures on Wavelets, volume 61
Ingrid Daubechies. Ten Lectures on Wavelets, volume 61. Siam, 1992
work page 1992
-
[7]
E.R. Fotsing, A. Ross, and E. Ruiz. Characterization of surface defects on composite sandwich materials based on deflectrometry. NDT& E International, 62: 0 29–--39, 2014
work page 2014
-
[8]
Brilliant insights – deflectometry for the inspection of specular surfaces, 2017
Fraunhofer-IOSB. Brilliant insights – deflectometry for the inspection of specular surfaces, 2017
work page 2017
-
[9]
Classification using distance nearest neighbours
Nial Friel and Anthony N Pettitt. Classification using distance nearest neighbours. Statistics and Computing, 21 0 (3): 0 431--437, 2011
work page 2011
-
[10]
Zur theorie der orthogonalen funktionensysteme
Alfred Haar. Zur theorie der orthogonalen funktionensysteme. Mathematische Annalen, 69 0 (3): 0 331--371, 1910
work page 1910
-
[11]
M. Heizmann and F.P. Le\' o n. Architectures for Image Fusion. INTECH Open Access Publisher, 2011
work page 2011
-
[12]
A probabilistic nearest neighbour method for statistical pattern recognition
CC Holmes and NM Adams. A probabilistic nearest neighbour method for statistical pattern recognition. Journal of the Royal Statistical Society: Series B (Statistical Methodology), 64 0 (2): 0 295--306, 2002
work page 2002
-
[13]
S. Kammel and F.P. Le\' o n. Deflectometric measurement of specular surfaces. IEEE Transactions on Instrumentation and Measurement, 57(4): 0 763–--769, 2008
work page 2008
-
[14]
M.S.L. Khan and S. ur R\' e hman. Computer vision approach towards final inspection quality analysis, 2018. FIQA Research Report I
work page 2018
-
[15]
Knauer, Jurgen Kaminski, and Gerd Hausler
Markus C. Knauer, Jurgen Kaminski, and Gerd Hausler. Phase measuring deflectometry: a new approach to measure specular free-form surfaces. In Proc.SPIE, volume 5457, pages 5457 -- 5457 -- 11, 2004. doi:10.1117/12.545704. URL https://doi.org/10.1117/12.545704
-
[16]
F.P. Le\' o n and S. Kammel. Inspection of specular and painted surfaces with centralized fusion techniques. Measurement, 39(6): 0 536--546, 2006
work page 2006
-
[17]
D. Maestro-Watson, J. Balzategui, L. Eciolaza, and N. Arana-Arexolaleiba. Deep learning for deflectometric inspection of specular surfaces. In Proceedings of International Joint Conference SOCO’18-CISIS’18- ICEUTE’18, pages 280--289, 2018
work page 2018
-
[18]
David Meyer, Evgenia Dimitriadou, Kurt Hornik, Andreas Weingessel, and Friedrich Leisch. e1071: Misc Functions of the Department of Statistics, Probability Theory Group (Formerly: E1071), TU Wien, 2018. URL https://CRAN.R-project.org/package=e1071. R package version 1.7-0
work page 2018
-
[19]
Micro-Epsilon. Automated surface inspection. https://www.micro-epsilon.com/download/products/dat--reflectCONTROL-PSS-8005-D--en.pdf, 2016
work page 2016
-
[20]
J. Molina, J.E. Solanes, L. Arnal, and J. Tornero. On the detection of defects on specular car body surfaces. Robotics and Computer–Integrated Manufacturing, 48: 0 263–--278, 2017
work page 2017
-
[21]
Multiresolution gray-scale and rotation invariant texture classification with local binary patterns
Timo Ojala, Matti Pietikainen, and Topi Maenpaa. Multiresolution gray-scale and rotation invariant texture classification with local binary patterns. IEEE Transactions on pattern analysis and machine intelligence, 24 0 (7): 0 971--987, 2002
work page 2002
-
[22]
N. Pya Arnqvist, B. Ngendangenzwa, L. Nilsson, E. Lindahl, and J. Yu. Defect detection and classification: Statistical learning approach, 2018. FIQA Research Report II
work page 2018
-
[23]
R: A Language and Environment for Statistical Computing
R Core Team . R: A Language and Environment for Statistical Computing. R Foundation for Statistical Computing, Vienna, Austria, 2018. URL https://www.R-project.org/
work page 2018
-
[24]
Bo Ranneby and Jun Yu. Nonparametric and probabilistic classification using nn-balls with environmental and remote sensing applications. In Advances in Directional and Linear Statistics, pages 201--216. Springer, 2011
work page 2011
-
[25]
Pattern recognition and neural networks
Brian D Ripley. Pattern recognition and neural networks. Cambridge university press, 2007
work page 2007
-
[26]
J. Santolaria, J. Vel\' a zquez, D. Samper, J. Aguilar, and I. Escursell. Sistema de inspecci\' o n de defectos opel espa\ n a, 2016
work page 2016
-
[27]
O. Severino Jr and A. Gonzaga. A new approach for color image segmentation based on color mixture. Machine Vision and Application, 24(3): 0 607--618, 2013
work page 2013
- [28]
-
[29]
A. Weckenmann, X. Jiang, K.D. Sommer, U. Neuschaefer-Rube, J. Seewig, L. Shaw, and T. Estler. Multisensor data fusion in dimensional metrology. CIRP Annals-Manufacturing Technology, 58(2): 0 701--721, 2009
work page 2009
-
[30]
Generalized Additive Models: An Introduction with R
Simon N Wood. Generalized Additive Models: An Introduction with R. CRC press, 2017
work page 2017
- [31]
-
[32]
Efficient knn classification with different numbers of nearest neighbors
Shichao Zhang, Xuelong Li, Ming Zong, Xiaofeng Zhu, and Ruili Wang. Efficient knn classification with different numbers of nearest neighbors. IEEE transactions on neural networks and learning systems, 29 0 (5): 0 1774--1785, 2018
work page 2018
discussion (0)
Sign in with ORCID, Apple, or X to comment. Anyone can read and Pith papers without signing in.