REVIEW 3 major objections 5 minor 24 references
A Molecule-Based Single-Photon Source Applied in Quantum Radiometry
T0 review · 3 major / 5 minor · reviewed 2026-08-14 · deepseek-v4-flash
Pith's one-line read A single dye molecule's photon stream calibrates a single-photon detector directly, giving an efficiency of (0.603 ± 0.012).
desk verdict A credible traceable SPAD calibration with a molecule single-photon source, but the uncertainty budget misses source drift and coupling reproducibility, so the quoted numbers hang on an unverified assumption. read the letter →
The pith
A machine-rendered reading of the paper's core claim, the machinery that carries it, and where it could break.
The reading
What carries the argument
The central object is a single dibenzoterrylene molecule in an anthracene nanocrystal, positioned about 100 nm from a gold mirror so that its emission is directed into the collection objective. The load-bearing identity is the radiometric link $\Phi = n h c / \lambda$ combined with the measurement ratio $\eta_{\mathrm{SPAD}} = \langle N_{\mathrm{SPAD}}\rangle / \langle N_{\mathrm{ref}}\rangle$, where $N_{\mathrm{ref}} = \langle I_f\rangle / (s_{\mathrm{ref}} E)$. The narrow zero-phonon line at 785.6 nm makes spectral-power-distribution corrections negligible, and the reference detector is calibrated through a traceability chain ending at the cryogenic radiometer. The antibunching fit $g^{(2)}(t) = (1 - b\, e^{-|t|/t_1}) e^{-Rt}$ certifies the single-photon purity of the stream.
What would settle it
Repeatedly reconnect the fiber between the SPAD and the reference detector while leaving the molecule and pump fixed, recording the reference photocurrent each time; if the reproduced flux varies by more than the 2% source drift and the inferred SPAD efficiency moves outside (0.603 ± 0.012), the sequential-comparison assumption fails. Alternatively, calibrate the same SPAD with correlated photon pairs and compare the efficiencies.
Extended reading notes
Core claim
The central claim is that a single DBT molecule, placed near a gold mirror to enhance collection, can act as an absolute low-photon-flux standard: its emitted power is determined by comparing the mean photocurrent of a calibrated analog Si detector with the photon energy $E = hc/\lambda$, and the SPAD efficiency follows from $\eta_{\mathrm{SPAD}} = \langle N_{\mathrm{SPAD}}\rangle / \langle N_{\mathrm{ref}}\rangle$. The paper reports a traceably measured optical radiant flux adjustable between 37 fW and 334 fW at 785.6 nm, sub-Poissonian statistics with $g^{(2)}(0) = 0.08 \pm 0.01$ at the maximum rate, and a SPAD efficiency of $(0.603 \pm 0.012)$.
Load-bearing premise
The calibration assumes the same photon flux reaches the SPAD and the reference detector, but the fiber connector is moved between the two measurements and the source drifts by about 2% over 10 minutes, with no term for either effect in the uncertainty budget.
Editorial extensions
If this is right
- An unattenuated, sub-Poissonian flux can be used to calibrate photon-counting detectors in the femtowatt range, removing the attenuation-related errors of weak coherent pulses.
- The same measurement bridges two metrology scales: the counting scale of SPADs and the watt scale of analog detectors traceable to the cryogenic radiometer.
- Because the source linewidth is below 0.2 nm, spectral corrections to detector responsivity become negligible.
- In pulsed operation at a 20 MHz repetition rate, the photon flux would be set by the pump clock, giving a predictable flux of about 300 000 photons per second.
- The device can serve as a low-photon-flux standard source, complementing blackbody and synchrotron radiation sources.
Reading between the lines
- If a molecule or emitter with a different zero-phonon line were available, the same ratio method could transfer the watt-traceable calibration to detectors with different spectral responses.
- Because the delivered flux is known independently of the SPAD, the source could also be used to characterise SPAD dead time and afterpulsing by comparing recorded rates with the known input rate.
- The sequential fiber-switching geometry means the reported 2% source drift and the reproducibility of re-coupling should be folded into the uncertainty budget; a simultaneous or in-situ flux monitor would settle how much they contribute.
- A clock-referenced pulsed version would make the source a 'predictable' single-photon source whose flux is set by an electrical frequency, a property that could be exploited as a quantum standard.
Signed reviews
Editorial analysis
A structured set of objections, weighed in public.
Referee Report
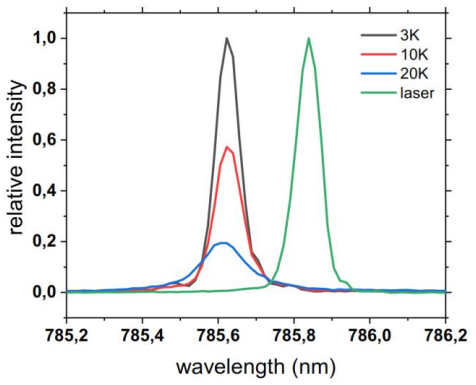
Summary. The manuscript reports a single-photon source based on a single DBT molecule in an anthracene nanocrystal, operated at 3 K, and characterizes its flux, spectral purity, and photon statistics. The central metrological claim is that the source delivers a traceable radiant flux adjustable between 37 fW and 334 fW at 785.6 nm, with g(2)(0)<0.1, and that this source can be used to calibrate a Si-SPAD directly against a calibrated analog Si photodiode, yielding η_SPAD = (0.603 ± 0.012) with 2–6% uncertainty over the range. The traceability chain connects the reference detector to the PTB cryogenic radiometer.
Significance. If the calibration result is valid, this is a significant advance: it demonstrates a low-flux, narrow-band, sub-Poissonian source that bridges single-photon counting and classical radiometry, with an unbroken traceability chain. The small spectral bandwidth makes corrections for the spectral power distribution negligible, a practical advantage over broadband sources. The source's stability and the clarity of the measurement chain are strengths, as is the explicit use of a primary standard via an external calibration. However, the load-bearing uncertainty estimate for the SPAD efficiency omits several stated effects, so the numerical result as presented is not fully supported.
major comments (3)
- [§4 and Table 2] The efficiency ratio η_SPAD = <N_SPAD>/<N_ref> assumes the same photon flux is delivered to both detectors. Section 3 reports a drift of "around 2%" over 10 minutes and <1% short-term fluctuations. The text does not describe any monitoring or correction for this drift, nor any measurement of the reproducibility of the FC/PC fiber coupling when reconnecting the fiber between the reference detector and the SPAD. Table 2's uncertainty budget contains no line for source stability or coupling reproducibility, even though a 2% drift is comparable to the largest component (Vf = 1.870%) and larger than the combined uncertainty of 1.92%. Because any flux difference between the two sequential readings enters η_SPAD as a direct multiplicative bias, the central value and the claimed uncertainty range are not justified without a quantitative treatment of these components.
- [§4 and Table 2] The text notes that "the molecule emission rate approaches the regime in which the detector dead time (τ_dead) affects the measurement of the detection efficiency η_SPAD" but no dead-time correction or uncertainty component is included in the budget. If the dead-time effect is significant at the highest flux (1.32 Mphoton/s), the efficiency values at the upper end of the range are biased, and the statement of a 2–6% uncertainty range does not hold. The authors should either correct the data for dead time, restrict the range to fluxes where the effect is negligible, or add an explicit uncertainty term.
- [§4] The final reported value η_SPAD = (0.603 ± 0.012) is given at the end of Section 4, but the manuscript does not state how this single value is derived from the flux-dependent measurements shown in Figure 4 (e.g., weighted mean over the range?). Without this, the reader cannot assess whether the value is representative of the whole range or whether the uncertainty is the combined uncertainty at a specific flux. This is needed to interpret the claimed "between 2% and 6%" range.
minor comments (5)
- [§6] In the Experimental Section, "Hambury-Brown and Twiss" should be "Hanbury Brown and Twiss".
- [Table 2] "Planck´s constant" should be "Planck's constant". The dashes for h and c are unusual; since these are exactly known constants, they can be listed with zero standard uncertainty or omitted.
- [Table 1] The table formatting is garbled; rows for 10 K and 15 K lack entries for max counts and g(2)(0), which should be completed for readability.
- [Figure 4] The figure caption should state the meaning of the error bars and the units on both axes; the text alone does not clarify whether the plotted efficiency is a single measurement at each flux or an average of repeated readings.
- [§3] The sentence on stability would benefit from a more quantitative description of the 2% drift, for example whether it is linear over the 10-minute interval or includes a settling time.
Circularity Check
No significant circularity: the SPAD efficiency is an independently measured ratio anchored to an external radiometric traceability chain.
full rationale
The paper's central quantitative result, η_SPAD = <N_SPAD>/<N_ref>, is a ratio of two independently measured quantities: the SPAD count rate and the photon flux derived from the analog reference detector's photocurrent and its PTB-traceable spectral responsivity. The reference detector responsivity is calibrated against an external cryogenic radiometer chain, not derived from the molecule source or from the SPAD being calibrated. The g(2)(0) value is a fit parameter of the measured photon autocorrelation histogram, not an input to the calibration equation, and the source flux is directly measured rather than assumed from the molecule's lifetime or from any prior publication. Self-citations to earlier work on DBT molecules provide context and supporting material properties, but the load-bearing metrological link is the in-paper measurement of flux and the PTB traceability chain. The sequential measurement concern about source drift and fiber-coupling reproducibility is a legitimate uncertainty and correctness issue, but it is not circularity: it questions whether the comparison geometry is stable, not whether the derivation reduces to its own inputs. The uncertainty budget is incomplete by the paper's own reported 2% drift, but that is an experimental weakness, not a self-referential argument. No step in the derivation defines the predicted quantity in terms of itself, fits a parameter and then renames it as a prediction, or imports a uniqueness claim from the authors' prior work. The derivation is self-contained against external benchmarks, so the appropriate circularity score is 0.
Assumptions & free parameters
free parameters (3)
- b (antibunching dip depth) =
0.92, giving g(2)(0) = 0.08 ± 0.01
- t1 (antibunching time constant) =
0.58 ns (from Figure 2d)
- R (count rate per SPAD in g(2) fit) =
146 kHz (agrees with direct readout)
assumptions (5)
- standard math Φ = n h c / λ relates photon flux to optical power
- standard math Variance relation for photodetection, Eq. (1) from Loudon
- domain assumption g(2)(t) fit model of Eq. 2
- domain assumption Reference Si-detector responsivity s_Si = (57.52 ± 0.58) x 10^-2 A/W at 785.6 nm is traceable to PTB cryogenic radiometer
- domain assumption DBT in anthracene behaves as a stable single-photon emitter with high quantum efficiency and narrow zero-phonon line at cryogenic temperatures
Cite this review
Pith. "Pith review of A Molecule-Based Single-Photon Source Applied in Quantum Radiometry." pith.science (2026). https://pith.science/paper/7KSL4OKX
@misc{pith2026190800616,
  author       = {Pith},
  title        = {Pith review of: A Molecule-Based Single-Photon Source Applied in Quantum Radiometry},
  year         = {2026},
  howpublished = {\url{https://pith.science/paper/7KSL4OKX}},
  note         = {Machine review of arXiv:1908.00616}
}
read the original abstract
Single photon sources (SPSs) based on quantum emitters hold promise in quantum radiometry as metrology standard for photon fluxes at the low light level. Ideally this requires control over the photon flux in a wide dynamic range, sub-Poissonian photon statistics and narrow-band emission spectrum. In this work, a monochromatic single-photon source based on an organic dye molecule is presented, whose photon flux is traceably measured to be adjustable between 144 000 and 1320 000 photons per second at a wavelength of (785.6 +/- 0.1) nm, corresponding to an optical radiant flux between 36.5 fW and 334 fW. The high purity of the single-photon stream is verified, with a second-order autocorrelation function at zero time delay below 0.1 throughout the whole range. Featuring an appropriate combination of emission properties, the molecular SPS shows here application in the calibration of a silicon Single-Photon Avalanche Detector (SPAD) against a low-noise analog silicon photodiode traceable to the primary standard for optical radiant flux (i.e. the cryogenic radiometer). Due to the narrow bandwidth of the source, corrections to the SPAD detection efficiency arising from the spectral power distribution are negligible. With this major advantage, the developed device may finally realize a low-photon-flux standard source for quantum radiometry.
Figures

Reference graph
Works this paper leans on
-
[1]
J. L. O’Brien, A. Furusawa, J. Vuckovic, Nat. Photonics 2009, 3, 687-695
work page 2009
- [2]
-
[3]
D. Gatto Monticone, K. Katamadze, P. Traina, E. Moreva, J. Forneris, I. Ruo- Berchera, P. Olivero, I. P. Degiovanni, G. Brida, and M. Genovese, Phys. Rev. Lett. 2014, 113, 143602
work page 2014
-
[4]
a) A. Peruzzo, M. Lobino, J. C. F. Matthews, N. Matsuda, A. Politi, K. Poulios, X.-Q. Zhou, Y. Lahini, N. Ismail, K. Wörhoff, Y. Bromberg, Y. Silberberg, M. G. Thompson, J. L. Obrien, Science 2010, 329 (5998), 1500-1503; b) H. Wang, Y. He, Y.-H. Li, Z.-E. Su, B. Li, H.-L. Huang, X. Ding, M.-C. Chen, C. Liu, J. Qin, Jin-Peng Li, Y.-M. He, C. Schneider, M. ...
work page 2010
- [5]
-
[6]
a) C. J. Chunnilall,,I. P. Degiovanni,,S. Kück, I. Müller, and A. G. Sinclair, Optical Engineering 2014, 53, 081910; b) J. Zwinkels, A. Sperling, T. Goodman, J. Campos Acosta, Y. Ohno, M. L. Rastello, M. Stock, E. Woolliams, Metrologia 2016, 53 (3)
work page 2014
-
[7]
W. Schmunk, M. Rodenberger, S. Peters, H. Hofer, and S. Kück, Journal of Modern Optics 2011, 58, 1252
work page 2011
- [8]
Show all 24 references
-
[9]
J. Y. Cheung, C. J. Chunnilall, E. R. Woolliams, N. P. Fox, J. R. Mountford, J. Wang and P. J. Thomas, Journal of Modern Optics 2007, 54, 373
2007
-
[10]
Loudon, Quantum theory of light, Oxford University Press, Oxford, UK, 2000
G. Loudon, Quantum theory of light, Oxford University Press, Oxford, UK, 2000
2000
-
[11]
Rodiek, M
B. Rodiek, M. Lopez, H. Hofer, G. Porrovecchio, M. Smid, X.-L. Chu, S. Götzinger, V. Sandoghdar, S. Lindner, C. Becher, S. Kueck, Optica 2017, 4 (1), 71-76
2017
-
[12]
Vaigu, G
a) A. Vaigu, G. Porrovecchio, X.-L. Chu, S. Lindner, M. Smid, A. Manninen, C. Becher, V. Sandoghdar, S. Götzinger, E. Ikonen, Metrologia 2017, 54, 218-223; b) Erratum (Metrologia 2017, 54, 218-23), Metrologia 2017, 54, 417
2017
-
[13]
Senellart, G
P. Senellart, G. Solomon, A. White, Nat. Nanotechnol. 2017, 12 (11), 1026
2017
-
[14]
Wrigge, I
a) G. Wrigge, I. Gerhardt, J. Hwang, G Zumofen, V. Sandoghdar, Nat. Phys. 2008, 4, 60-66; b) in preparation
2008
-
[15]
a) A. A. L. Nicolet, B. Kozankiewicz, C. Hofmann, M. Orrit, ChemPhysChem 2007, 8, 1929– 1936; b) C. Toninelli, K. Early, J. Bremi, A. Renn, S. Goetzinger, V. Sandoghdar, Opt. Express 2010, 18 (7), 6577-6582; c) B. Kozankiewicz, M. Orrit, Chem. Soc. Rev. 2014, 43, 1029-1043
2007
-
[16]
A. A. L. Nicolet, C. Hofmann, M. A. Kol’chenko, B. Kozankiewicz, M. Orrit, ChemPhysChem 2007, 8, 1215– 1220
2007
-
[17]
Trebbia, P
a) J.-B. Trebbia, P. Tamarat, B. Lounis, Phys. Rev. A 2010, 82, 063803; b) S. Grandi, K. D. Major, C. Polisseni, S. Boissier, A. S. Clark, E. A. Hinds, Phys. Rev. A 2016, 94, 063839
2010
-
[18]
Pazzagli, P
S. Pazzagli, P. Lombardi, D. Martella, M. Colautti, B. Tiribilli, F. S. Cataliotti, C. Toninelli, ACS Nano 2018, 12, 54295-4303
2018
-
[19]
Checcucci, P
S. Checcucci, P. Lombardi, S. Rizvi, F. Sgrignuoli, N. Grhuler, F. B. C. Dieleman, F. S. Cataliotti, W. H. P. Pernice, M. Agio, C. Toninelli, Light: Sci. Appl. 2017 6, e16245
2017
-
[20]
C. A. Balanis, Antenna Theory: Analysis and Design. 3rd edn. Hoboken: John Wiley & Sons, 2005
2005
-
[22]
parameters b and t1 are related to g(2)(0) and as follows: g(2)(0) = 1 - b ; 1/t1 = 1/ + P, where P is the pump rate
-
[23]
see projects of the European Metrology Program for Innovation and Research (EMPIR), project 17FUN06 SIQUST (Single-photon sources as new quantum standards): https://www.siqust.eu/summary/
-
[24]
Guide to the expression of uncertainty in measurement,
“Guide to the expression of uncertainty in measurement,” BIPM, first edition, Sept. 2008
2008
-
[25]
Werner, J
L. Werner, J. Fischer, U. Johannsen, J. Hartmann, Metrologia 2000, 37 (4), 279 – 284 Figures Figure 1 a) Blue-detuned (767nm) pumping scheme used to collect photons emitted into the 00-ZPL (785nm). b) wide-field (WF) fluorescence image: zoom (40x40 um2) on a region of the samp...
2000
Reviewed August 14, 2026 · model on record in the stance chip above.
Discussion (0). Continue with ORCID to comment.