REVIEW 3 major objections 5 minor 51 references
Cross-validation tests for cryo-EM maps using an independent particle set
T0 review · 3 major / 5 minor · reviewed 2026-08-14 · deepseek-v4-flash
Pith's one-line read Cryo-EM reconstructions can be cross-validated by watching how their Bayesian posterior behaves over a small withheld particle set.
desk verdict A plausible R-free-like control-set test for cryo-EM maps that deserves a serious referee, but the held-out set is not fully independent because the orientation search uses the map under validation. read the letter →
The pith
A machine-rendered reading of the paper's core claim, the machinery that carries it, and where it could break.
The reading
What carries the argument
The central object is the BioEM posterior probability $P_{m\omega}$: a Bayesian likelihood of a map $m$ given a single particle image $\omega$, with nuisance parameters (center displacement, normalization, offset, noise, orientation, CTF defocus, amplitude, B-factor) integrated out. The cumulative log-posterior over the control set, $\sum_\omega \ln P_{m\omega}/N_\omega - \ln P_{\mathrm{noise}}$, acts as the first test statistic, and the normalized Jensen-Shannon divergence between the posterior distributions of the two half-set reconstructions acts as the second. The integrations are done in two rounds: a coarse all-orientation search selects the best ten orientations per particle, then a fine zoom around those orientations scores each low-pass filtered map. This machinery converts a held-out particle set into a quality ladder: genuine maps climb it as frequencies are added and refinement proceeds, while overfitted maps do not.
What would settle it
Take a deliberately overfitted map and rerun the cross-validation with the control particles' orientations fixed by a reference map unrelated to the refinement, or randomized; if the rising cumulative log-posterior and NJSD signature reappears, the discrimination is an artifact of the orientation search rather than a property of genuine maps.
Extended reading notes
Core claim
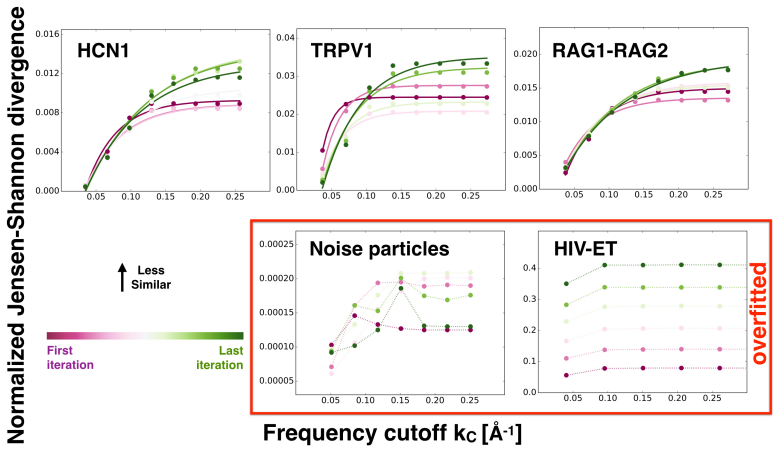
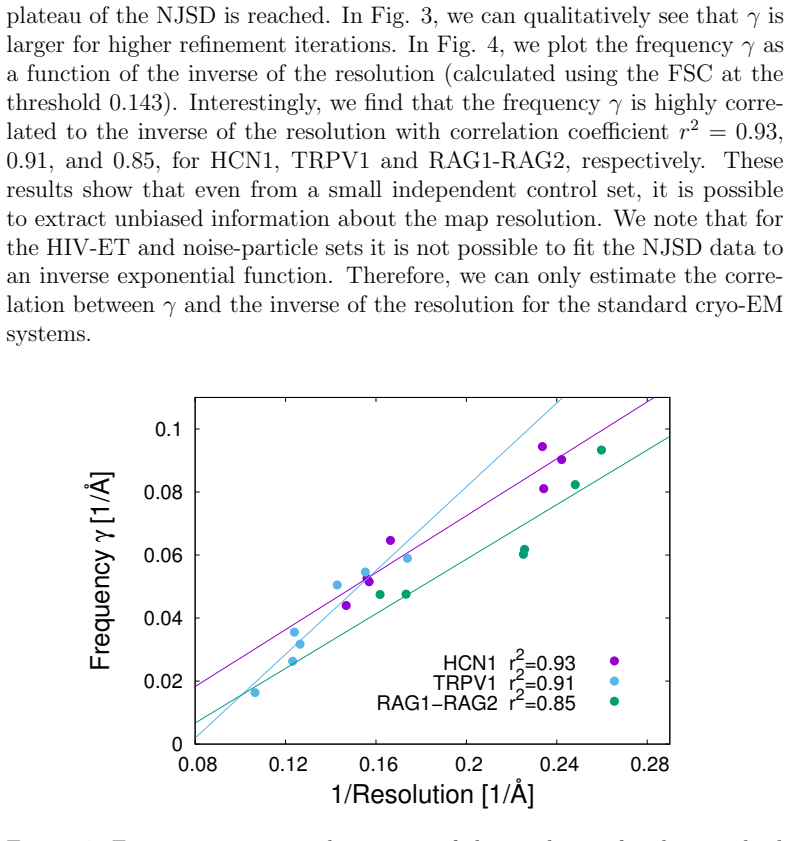
Using the BioEM posterior, a per-image likelihood of a map integrated over orientation, CTF, displacement, and noise parameters, as a map-quality statistic over an independent particle set, the paper shows that the cumulative log-posterior grows with low-pass frequency cutoff and refinement iteration for the genuine reconstructions of HCN1, TRPV1, and RAG1-RAG2, while it decreases or stays constant for a low-resolution HIV-1 envelope trimer reconstruction and for reconstructions evaluated against pure-noise images. The normalized Jensen-Shannon divergence between the probability distributions of the two gold-standard half-set reconstructions rises with added high frequencies and plateaus for the genuine systems, and the fitted plateau frequency $\gamma$ correlates strongly with the inverse of the FSC resolution ($r^2 = 0.93$, $0.91$, and $0.85$). The authors conclude that withholding a control particle set from refinement makes overfitting detectable and should become standard practice.
Load-bearing premise
The protocol assumes that the BioEM posterior over the control set measures genuine map quality even though the orientations of the control particles are chosen in a first round using the very reconstruction that is being validated, a fit that could let an overfitted map match noise in the control particles and fake the expected trends.
Editorial extensions
If this is right
- Every cryo-EM refinement could carry a small control set, giving an R-free-like, raw-data-based check on map quality at each iteration.
- The NJSD plateau frequency $\gamma$ tracks the inverse FSC resolution ($r^2 = 0.93$, $0.91$, $0.85$), so resolution information can be extracted from the control set rather than from mask-dependent FSC alone.
- The cross-validation observables converge with roughly 1000 control particles, so the extra cost of the protocol is small relative to a full refinement.
- Overfitted reconstructions show up as flat or decreasing cumulative log-posterior and non-monotonic NJSD, catching cases where a gold-standard FSC estimate might still look acceptable.
- The method generalizes to any posterior probability of a 3D density given particle images, and the authors point toward refining atomic models against the control set as a next step.
Reading between the lines
- Because the first round of the posterior calculation selects each control particle's best orientations against the final reconstruction being validated, the control set is not fully independent under the protocol as written; a stricter implementation that fixes orientations from an unrelated reference would test whether the discrimination survives.
- The strong correlation between $\gamma$ and the inverse FSC resolution suggests the method could be calibrated on a collection of deposited maps into an absolute resolution estimator that does not depend on a mask; the paper does not attempt that calibration.
- The per-particle probabilities that enter the cumulative log-posterior could be mined for diagnostics: particles where the two half-set reconstructions disagree most are prime candidates for heterogeneity or misassigned defocus, an application the paper does not explore.
Signed reviews
Editorial analysis
A structured set of objections, weighed in public.
Referee Report
Summary. This paper proposes a cross-validation protocol for cryo-EM reconstructions based on a small set of particle images excluded from refinement. For each gold-standard reconstruction, the authors low-pass filter the map at several cutoffs, compute the BioEM posterior probability of each filtered map over the control particles, and monitor the cumulative log-posterior and a normalized Jensen-Shannon divergence (NJSD) between the two half-set reconstructions as functions of frequency cutoff and refinement iteration. They report that for three standard maps (HCN1, TRPV1, RAG1-RAG2) the cumulative log-posterior increases with cutoff and iteration and the NJSD follows an inverse-exponential trend whose scale gamma correlates with the FSC-based resolution, whereas for an HIV-1 envelope trimer map and a synthetic pure-noise control the expected trends fail. The authors conclude that an independent control set is essential for unbiased map validation.
Significance. The proposed tool is a welcome addition to the cryo-EM validation toolbox: it uses raw particle data rather than post-processed maps, is conceptually analogous to R-free, and the authors provide open-source code, a tutorial, and tests on public EMPIAR datasets. If the reported trends are reproducible with truly held-out orientations, the method could provide a practical overfitting diagnostic complementary to the gold-standard FSC. However, the current manuscript's central claim is weakened by a statistical independence gap in the orientation fitting and by the limited evidence for the overfitted category.
major comments (3)
- [Methods: BioEM algorithm] The cumulative log-posterior reported in Fig. 2 is not a marginal held-out likelihood. In round 1 of the BioEM calculation, the best 10 orientations for each control particle are selected using 'the final reconstruction from the refinement with a broad mask and without low-pass filtering' (Methods, BioEM algorithm), i.e., the map being validated; in round 2, orientations are re-fitted for each low-pass filtered map by zooming around those 10 orientations. Thus the posterior in Eq. (2), which integrates over orientations, is approximated by a profile likelihood in which per-particle orientations are optimized against the control set. For an overfitted map whose high-frequency content is noise, the orientation search can align that noise with the control images, so the observed increase of cumulative log-posterior with kc (or its absence for overfitted maps) may reflect orientation overfitting rather than genuine generalization. Please show that the trends in Figs. 2 and 3 persist when orientations are fixed across all kc, for example by using the orientations produced by the gold-standard RELION refinement of the non-control particles, or by actually marginalizing over orientations.
- [Results: Map evidence from the cumulative log-posterior] The evidence for the central discrimination claim rests on only one real overfitted dataset (HIV-ET) and one synthetic pure-noise control. The HIV-ET map is externally controversial (refs. [42,43]), and the pure-noise control is not a reconstruction at all but a set of unrelated Gaussian images evaluated against RAG1-RAG2 maps; its failure is therefore an expected consequence of mismatched data rather than a demonstration of overfitting detection. To support the claim that the method 'discriminates the overfitted sets from the non-overfitted ones,' the authors should include additional known overfitted reconstructions (e.g., maps obtained by refining noise-substituted data or other disputed EMPIAR deposits) and report results over multiple random selections of the control set, with error bars.
- [Results: Cross-validation tests versus resolution] The correlation between the fitted frequency gamma and the inverse FSC resolution (Fig. 4, r²=0.93, 0.91, 0.85) is reported without uncertainties or goodness-of-fit measures. Each NJSD curve is fitted with three free parameters (A, B, gamma) to only eight cutoff frequencies, so the statistical significance of these correlations is unclear. Please report parameter errors, per-system fits, and the sensitivity of gamma to the fitting model.
minor comments (5)
- [Methods: Eq. (3)] The NJSD is defined with probabilities normalized per image such that P1ω + P2ω = 1; this is stated in the text but not in the equation, so consider making the normalization explicit in Eq. (3) to avoid ambiguity.
- [Figure 2] The gradient color scale from maroon to green over refinement iterations is difficult to read without a legend; adding iteration numbers or a color bar would improve interpretability.
- [Supplementary Figure 3 caption] The caption contains a typo: 'NSJD' should be 'NJSD'.
- [Discussion] The claim that the method 'converge[s] over a small particle set, typically only 1000 particles' is supported by a single system (TRPV1) at a single iteration; please either weaken the claim or show convergence for more systems.
- [Methods: Low-pass filter] The low-pass filter is implemented as a hard cutoff in Fourier space (Eq. 1); a soft-edged filter or a Butterworth filter might be preferable to avoid Gibbs ringing, and the choice deserves a sentence of justification.
Circularity Check
No significant circularity: the cross-validation observables are empirical and externally benchmarked, and the BioEM self-citation is not load-bearing.
full rationale
The paper's central claims are empirical rather than derivational. The cumulative log-posterior over the control set is computed from the BioEM posterior and compared across frequency cutoffs and refinement iterations; the observed increase for genuine maps and failure for overfitted maps is a measured result on external EMPIAR datasets and synthetic noise, not a quantity forced by the definition of the statistic. The NJSD is a standard divergence computed from the posterior distributions, and the inverse-exponential fit with parameter gamma is a post-hoc empirical description of the curves, not an input from which the trends are derived. The correlation between gamma and FSC resolution is a fit, not a construction. The paper cites BioEM from the same group, but BioEM is an open-source, publicly available code with stated assumptions, so this self-citation is not load-bearing in the sense of importing an unverified uniqueness or ansatz. The orientation-search protocol in the Methods (round 1 using the final reconstruction and round 2 re-fitting orientations for each filtered map) is a potential statistical-independence concern because orientations are optimized against the map under evaluation, but this is a soundness or validity issue rather than a circularity: no equation reduces to its inputs, and no fitted parameter is renamed as a prediction. The discrimination of overfitted versus non-overfitted maps is therefore an empirical benchmark result, not an equivalence to the method's inputs by construction.
Assumptions & free parameters
free parameters (3)
- gamma (NJSD inverse-exponential scale) =
varies by system and iteration, e.g., 0.05-0.1 1/Å
- A, B (NJSD fit amplitude and offset) =
not reported numerically
- Number of control particles N_omega =
5000 (standard), 1000 (convergence test)
assumptions (5)
- domain assumption BioEM posterior probability (Eq. 2) correctly models the image formation process for each particle given a map, including orientation, defocus, B-factor, noise, etc.
- domain assumption The control particle set is statistically independent of the refinement process.
- domain assumption The two gold-standard half-set reconstructions are independent realizations.
- ad hoc to paper The NJSD as a function of kc can be described by -A e^{-kc/gamma}+B.
- ad hoc to paper Noise particles generated as zero-mean unit-variance Gaussian images represent a 'false control' that mimics overfitting.
Cite this review
Pith. "Pith review of Cross-validation tests for cryo-EM maps using an independent particle set." pith.science (2026). https://pith.science/paper/RWWOSBZ6
@misc{pith2026190801054,
  author       = {Pith},
  title        = {Pith review of: Cross-validation tests for cryo-EM maps using an independent particle set},
  year         = {2026},
  howpublished = {\url{https://pith.science/paper/RWWOSBZ6}},
  note         = {Machine review of arXiv:1908.01054}
}
read the original abstract
Cryo-electron microscopy is a revolutionary technique that can provide 3D density maps at near-atomic resolution. However, map validation is still an open issue in the field. Despite several efforts from the community, it is possible to overfit the reconstructions to noisy data. Here, inspired by modern statistics, we develop a novel methodology that uses a small independent particle set to validate the 3D maps. The main idea is to monitor how the map probability evolves over the control set during the refinement. The method is complementary to the gold-standard procedure, which generates two reconstructions at each iteration. We low-pass filter the two reconstructions for different frequency cutoffs, and we calculate the probability of each filtered map given the control set. For high-quality maps, the probability should increase as a function of the frequency cutoff and of the refinement iteration. We also compute the similarity between the probability distributions of the two reconstructions. As higher frequencies are added to the maps, more dissimilar are the distributions. We optimized the BioEM software package to perform these calculations, and tested the method on several systems, some which were overfitted. Our results show that our method is able to discriminate the overfitted sets from the non-overfitted ones. We conclude that having a control particle set, not used for the refinement, is essential for cross-validating cryo-EM maps.
Figures


Figures from the paper (1 more)
Reference graph
Works this paper leans on
-
[1]
K¨ uhlbrandt, W. Cryo-EM enters a new era. eLife 3, e03678 (2014)
work page 2014
-
[2]
Single-Particle Cryo-EM at Crystallographic Resolution
Cheng, Y. Single-Particle Cryo-EM at Crystallographic Resolution. Cell 161, 450–457 (2015)
work page 2015
- [3]
-
[4]
Wu, S., Armache, J.-P. & Cheng, Y. Single-particle cryo-EM data acqui- sition by using direct electron detection camera. Microscopy 65, 35–41 (2016)
work page 2016
-
[5]
McMullan, G., Faruqi, A. & Henderson, R. Direct Electron Detectors. Methods in Enzymology 579, 1–17 (2016). 16
work page 2016
-
[6]
Kervrann, C., Sanchez Sorzano, C. O., Acton, S. T., Olivo-Marin, J.-C. & Unser, M. A Guided Tour of Selected Image Processing and Analysis Methods for Fluorescence and Electron Microscopy. IEEE Journal of Selected Topics in Signal Processing 10, 6–30 (2016)
work page 2016
-
[7]
Cossio, P. & Hummer, G. Likelihood-based structural analysis of elec- tron microscopy images. Current Opinion in Structural Biology 49, 162–168 (2018)
work page 2018
-
[8]
Lawson, C. L. et al. EMDataBank.org: unified data resource for Cry- oEM. Nucleic Acids Res 39, D456–D464 (2011)
work page 2011
Show all 51 references
-
[9]
Berman, H. et al. The Protein Data Bank. Nucleic Acids Res 28, 235–242 (2000)
2000
-
[10]
Henderson, R. et al. Outcome of the First Electron Microscopy Valida- tion Task Force Meeting. Structure 20, 205–214 (2012)
2012
-
[11]
Scheres, S. H. W. & Chen, S. Prevention of overfitting in cryo-EM structure determination. Nature methods 9, 853 (2012)
2012
-
[12]
Sorzano, C. et al. XMIPP: a new generation of an open-source image processing package for electron microscopy. Journal of Structural Biol- ogy 148, 194–204 (2004)
2004
-
[13]
Tang, G. et al. EMAN2: An extensible image processing suite for elec- tron microscopy. Journal of Structural Biology 157, 38–46 (2007)
2007
-
[14]
Scheres, S. H. W. RELION: implementation of a Bayesian approach to cryo-EM structure determination. Journal of structural biology 180, 519–530 (2012)
2012
-
[15]
L., Fleet, D
Punjani, A., Rubinstein, J. L., Fleet, D. J. & Brubaker, M. A. cryoSPARC: algorithms for rapid unsupervised cryo-EM structure de- termination. Nature Methods 14, 290–296 (2017)
2017
-
[16]
Saxton, W. O. & Baumeister, W. The correlation averaging of a reg- ularly arranged bacterial cell envelope protein. Journal of Microscopy 127, 127–138 (1982)
1982
-
[17]
& van Heel, M
Harauz, G. & van Heel, M. Exact Filters for General Geometry Three Dimensional Reconstruction. Optik 78, 6–30 (1986). 17
1986
-
[18]
Rosenthal, P. B. & Rubinstein, J. L. Validating maps from single particle electron cryomicroscopy. Current Opinion in Structural Biology 34, 135–144 (2015)
2015
-
[19]
Heymann, J. B. et al. The first single particle analysis Map Challenge: A summary of the assessments. Journal of structural biology 204, 291–300 (2018)
2018
-
[20]
& Schatz, M
Van Heel, M. & Schatz, M. Fourier shell correlation threshold criteria. Journal of structural biology 151, 250–262 (2005)
2005
-
[21]
Sorzano, C. O. S. et al. A review of resolution measures and related aspects in 3D Electron Microscopy. Progress in biophysics and molecular biology 124, 1–30 (2017)
2017
-
[22]
Penczek, P. A. Resolution Measures in Molecular Electron Microscopy. Methods in Enzymology 482, 73–100 (2010)
2010
-
[23]
& Chiu, W
Pintilie, G., Chen, D.-H., Haase-Pettingell, C., King, J. & Chiu, W. Resolution and Probabilistic Models of Components in CryoEM Maps of Mature P22 Bacteriophage. Biophysical Journal 110, 827–839 (2016)
2016
-
[24]
Afonine, P. V. et al. New tools for the analysis and validation of cryo-EM maps and atomic models. Acta Crystallographica Section D Structural Biology 74, 814–840 (2018)
2018
-
[25]
& Ficner, R
Neumann, P., Dickmanns, A. & Ficner, R. Validating Resolution Rev- olution. Structure 26, 785–795.e4 (2018)
2018
-
[26]
Avoiding the pitfalls of single particle cryo-electron mi- croscopy: Einstein from noise
Henderson, R. Avoiding the pitfalls of single particle cryo-electron mi- croscopy: Einstein from noise. Proceedings of the National Academy of Sciences 110, 18037–18041 (2013)
2013
-
[27]
J., Brenner, S
Shatsky, M., Hall, R. J., Brenner, S. E. & Glaeser, R. M. A method for the alignment of heterogeneous macromolecules from electron mi- croscopy. Journal of structural biology 166, 67–78 (2009)
2009
-
[28]
Chen, S. et al. High-resolution noise substitution to measure overfitting and validate resolution in 3D structure determination by single particle electron cryomicroscopy. Ultramicroscopy 135, 24–35 (2013). 18
2013
-
[29]
Afanasyev, P. et al. Single-particle cryo-EM using alignment by classifi- cation (ABC): the structure of Lumbricus terrestris haemoglobin.IUCrJ 4, 678–694 (2017)
2017
-
[30]
Kucukelbir, A., Sigworth, F. J. & Tagare, H. D. Quantifying the local resolution of cryo-EM density maps. Nature methods 11, 63–5 (2014)
2014
-
[31]
Cardone, G., Heymann, J. B. & Steven, A. C. One number does not fit all: mapping local variations in resolution in cryo-EM reconstructions. Journal of structural biology 184, 226–36 (2013)
2013
-
[32]
Vargas, J., Melero, R., G´ omez-Blanco, J., Carazo, J. M. & Sorzano, C. O. S. Quantitative analysis of 3D alignment quality: its impact on soft-validation, particle pruning and homogeneity analysis. Scientific Reports 7, 6307 (2017)
2017
-
[33]
Vargas, J., Ot´ on, J., Marabini, R., Carazo, J. M. & Sorzano, C. O. S. Particle alignment reliability in single particle electron cryomicroscopy: a general approach. Scientific Reports 6, 21626 (2016)
2016
-
[34]
Brown, A. et al. Tools for macromolecular model building and re- finement into electron cryo-microscopy reconstructions. Acta Crystal- lographica Section D Biological Crystallography 71, 136–153 (2015)
2015
-
[35]
Avramov, T. K. et al. Deep Learning for Validating and Estimating Resolution of Cryo-Electron Microscopy Density Maps. Molecules 24 (2019)
2019
-
[36]
Br¨ unger, A. T. Free R value: a novel statistical quantity for assessing the accuracy of crystal structures. Nature 355, 472–475 (1992)
1992
-
[37]
& Hummer, G
Cossio, P. & Hummer, G. Bayesian analysis of individual electron mi- croscopy images: Towards structures of dynamic and heterogeneous biomolecular assemblies. Journal of structural biology 184, 427–437 (2013)
2013
-
[38]
Cossio, P. et al. BioEM: GPU-accelerated computing of Bayesian infer- ence of electron microscopy images. Computer Physics Communications 210, 163–171 (2017). 19
2017
-
[39]
& Others
Ru, H. & Others. Molecular Mechanism of V(D)J Recombination from Synaptic RAG1-RAG2 Complex Structures. Cell 163, 1138–1152 (2015)
2015
-
[40]
& MacKinnon, R
Lee, C.-H. & MacKinnon, R. Structures of the human HCN1 hyperpolarization-activated channel. Cell 168, 111–120 (2017)
2017
-
[41]
Structure of the TRPV1 ion channel determined by electron cryo-microscopy
Liao Maofu, Cao Erhu, Julius David & Cheng Yifan. Structure of the TRPV1 ion channel determined by electron cryo-microscopy. Nature 504, 107 (2013)
2013
-
[42]
Mao, Y. et al. Molecular architecture of the uncleaved HIV-1 envelope glycoprotein trimer. Proceedings of the National Academy of Sciences 110, 12438–12443 (2013)
2013
-
[43]
Structure of trimeric HIV-1 envelope glycoproteins
Subramaniam, S. Structure of trimeric HIV-1 envelope glycoproteins. Proceedings of the National Academy of Sciences 110, E4172–E4174 (2013)
2013
-
[44]
K., Salavert-Torres, J., Kleywegt, G
Iudin, A., Korir, P. K., Salavert-Torres, J., Kleywegt, G. J. & Patward- han, A. EMPIAR: a public archive for raw electron microscopy image data. Nature Methods 13, 387–388 (2016)
2016
-
[45]
URL https://sites.google.com/site/ rubinsteingroup/home
Rubinstein Lab. URL https://sites.google.com/site/ rubinsteingroup/home
-
[46]
Yershova, A., Jain, S., LaValle, S. M. & Mitchell, J. C. Generating uniform incremental grids on SO(3) using the Hopf fibration. Int. J. Robot. Res. 29, 801–812 (2010)
2010
-
[47]
Cossio, P. et al. Bayesian inference of rotor ring stoichiometry from electron microscopy images of archaeal ATP synthase. Microscopy 67, 266–273 (2018)
2018
-
[48]
Information theory and statistics
Kullback, S. Information theory and statistics. (Dover Publications, 1968)
1968
-
[49]
Divergence measures based on the Shannon entropy
Lin, J. Divergence measures based on the Shannon entropy. IEEE Transactions on Information Theory 37, 145–151 (1991)
1991
-
[50]
Cover, T. M. & Thomas, J. A. Elements of information theory 2nd edition (2006). 20 Supplementary Information: Cross-validation tests for cryo-EM maps using an independent particle set Sebastian Ortiz1, Luka Stanisic2, Boris A Rodriguez 3, Markus Rampp2, Gerhard Hummer 4,5, and...
2006 arXiv
-
[51]
The following input file is for a subset of particles that have experimental defocus between 1.3 and 1.7µm
The best orientations for each particle are obtained using the final map from the refinement. The following input file is for a subset of particles that have experimental defocus between 1.3 and 1.7µm. The best 10 orientations for each particle are selected. PIXEL SIZE 1.22 NUMBE...
Reviewed August 14, 2026 · model on record in the stance chip above.
Discussion (0). Continue with ORCID to comment.