REVIEW 3 major objections 5 minor 1 cited by
Residual stress distributions in athermally deformed amorphous solids from atomistic simulations
T0 review · 3 major / 5 minor · reviewed 2026-08-14 · deepseek-v4-flash
Pith's one-line read This paper argues that under athermal shear the local residual-stress distribution of an amorphous solid develops a system-size-dependent plateau at small stresses, caused by the discreteness of mechanical noise, and that local yield…
desk verdict The plateau in P(x) under shear is likely real, but this paper's own evidence does not pin its origin on noise discreteness, and the internal scaling check points the other way. read the letter →
The pith
A machine-rendered reading of the paper's core claim, the machinery that carries it, and where it could break.
The reading
What carries the argument
The central tool is the frozen-matrix method: a circular region of radius roughly five particle diameters inside a two-dimensional glass is deformed under athermal quasistatic shear while a shell outside is held rigid, forcing any plastic event to occur inside the probe. Repeating this over many independent regions gives the local yield stress $\sigma_Y$ and the residual stress $x=\sigma_Y-\sigma_0$. The argument is carried by the distribution $P(x)$, written as $p_0+x^\theta$ once deformation starts, and by the companion distribution $P(\Delta x)$ of residual-stress differences between consecutive avalanches, whose lower cutoff $\Delta x_c$ supplies the characteristic discrete scale below which the plateau appears. Plastic events are detected with the energy-based criterion $\kappa=(U_{\rm aff}-U_0)/(N\,\delta\gamma^2)\ge 30$, and extreme-value statistics, through the relation $\langle x_{\min}\rangle\sim L^{-d/(1+\theta)}$, tie local measurements to global deformation.
What would settle it
Measure $P(x)$ and the noise cutoff $\Delta x_c(L)$ in fully unconstrained global athermal quasistatic shear simulations by tracking residual stresses in small interior subvolumes that never touch the boundary; if the plateau height $p_0$ or the cutoff exponent changes relative to the frozen-matrix values, the plateau is a boundary artefact. Alternatively, in a mesoscale model with controlled stress kicks, check whether the ratio $\Delta x_c(L)/\langle x_{\min}\rangle(L)$ grows with $L$: if it grows, the plateau dominates weak-site scaling and the $\theta$-to-avalanche relations change; if it shrinks, the pseudogap description survives.
Extended reading notes
Core claim
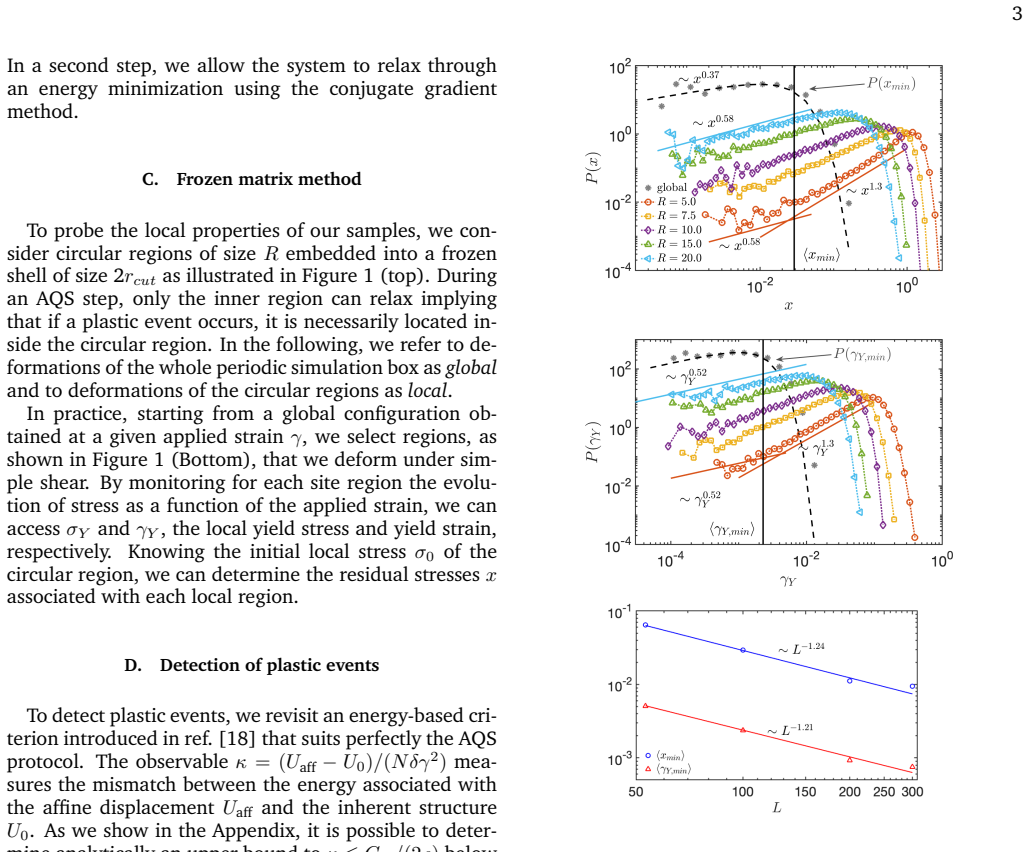
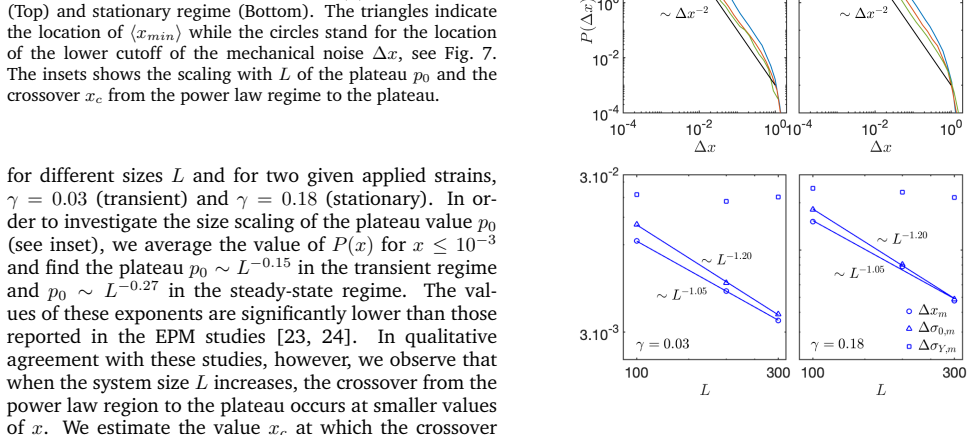
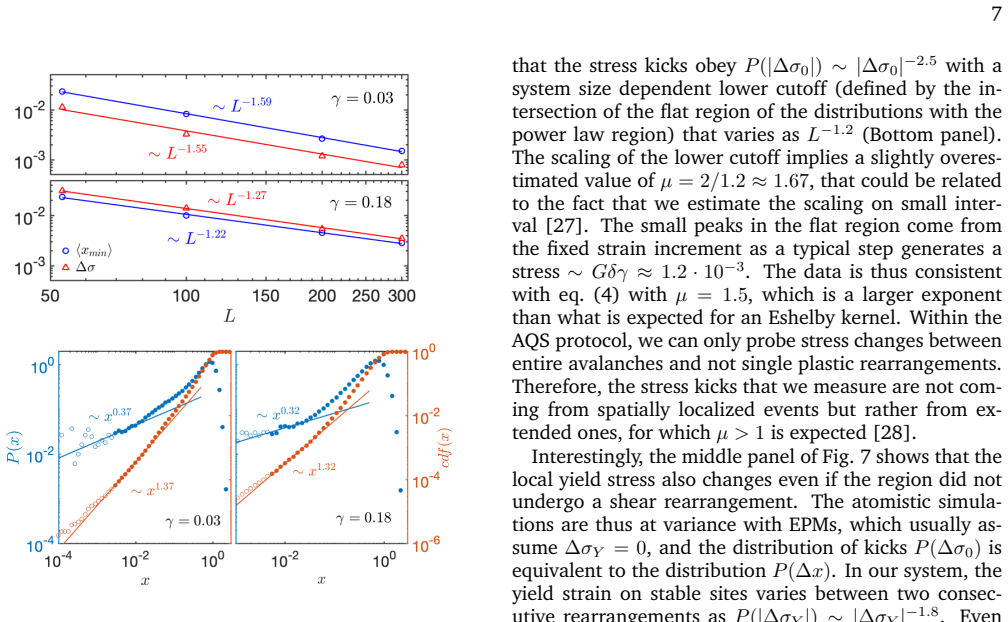
Using the frozen-matrix method on a two-dimensional model glass under athermal quasistatic shear, the paper establishes that the distribution $P(x)$ of residual stresses $x=\sigma_Y-\sigma_0$ changes qualitatively once deformation starts. In the quenched state $P(x)\sim x^{\theta_1}$ with $\theta_1\approx 0.58$ in the small-$x$ region, consistent with $\theta\approx 0.6$ obtained from system-size scaling of the weakest site. After a few percent strain, a plateau appears at small $x$: its height scales as $p_0\sim L^{-0.15}$ in the transient regime and $p_0\sim L^{-0.27}$ in steady state, with the crossover to the power-law region at $x_c\sim L^{-0.78}$. The plateau is attributed to the discreteness of the mechanical noise: the distribution of residual-stress differences between consecutive avalanches has a lower cutoff $\Delta x_c\sim L^{-1.05}$ that marks the entrance of the plateau. The paper also shows that the local yield stress changes on sites that do not rearrange, with $P(|\Delta\sigma_Y|)\sim|\Delta\sigma_Y|^{-1.8}$, and argues that reliable pseudogap exponents under deformation must be extracted for $x>\Delta x_c$.
Load-bearing premise
The frozen matrix leaves the weakest sites statistically untouched: truncating nonaffine displacements at the frozen shell must affect only large residual stresses, not the small-x pseudogap, the deformation-induced plateau, or the drift of local yield stress.
Editorial extensions
If this is right
- In freshly quenched glasses, the frozen-matrix method recovers the pseudogap exponent $\theta\approx 0.6$ matching global yielding statistics, so local weak-site measurements are trustworthy at least before deformation.
- Under shear, small-$x$ fits of $P(x)$ must stay above the noise cutoff $\Delta x_c(L)$; fits that include the plateau will contaminate or bias the extracted pseudogap exponent.
- If $\Delta x_c(L)$ decays more slowly than $\langle x_{\min}\rangle(L)$, the weakest-site scaling will eventually be governed by the plateau, and the standard relation between $\theta$ and avalanche exponents $\tau$ and $d_f$ would have to be modified.
- The plateau observed in elastoplastic models is not an artefact of coarse-graining; it also appears in atomistic simulations, suggesting a common origin in discrete stress redistribution.
- Local yield stress is not fixed during deformation: stable sites undergo power-law-distributed changes, so models that assume $\Delta\sigma_Y=0$ omit a physical source of noise.
Reading between the lines
- If the plateau is set by the noise cutoff, then protocols that change the stress-kick spectrum—different interactions, spatial dimension, or an imposed external noise—should move the plateau height and crossover in a predictable way; this is testable without invoking the frozen-matrix assumption.
- The measured drift of local yield stress on stable sites suggests that structural predictors of plasticity are tracking a moving target; part of the scatter in soft-spot correlations could be explained by this time-dependent threshold.
- The close numerical agreement between the measured cutoff exponent ($\approx 1.05$) and the crossover exponent ($\approx 0.78$) is suggestive but not derived; a simulation with controlled stress kicks could determine whether the plateau entrance coincides exactly with $\Delta x_c$ or only scales with it.
- A natural extension is to measure $P(\Delta\sigma_Y)$ in three dimensions: if the $\approx -1.8$ power law is universal, mesoscale descriptions should promote the local yield stress from a fixed quenched variable to an annealed, slowly fluctuating one.
Signed reviews
Editorial analysis
A structured set of objections, weighed in public.
Referee Report
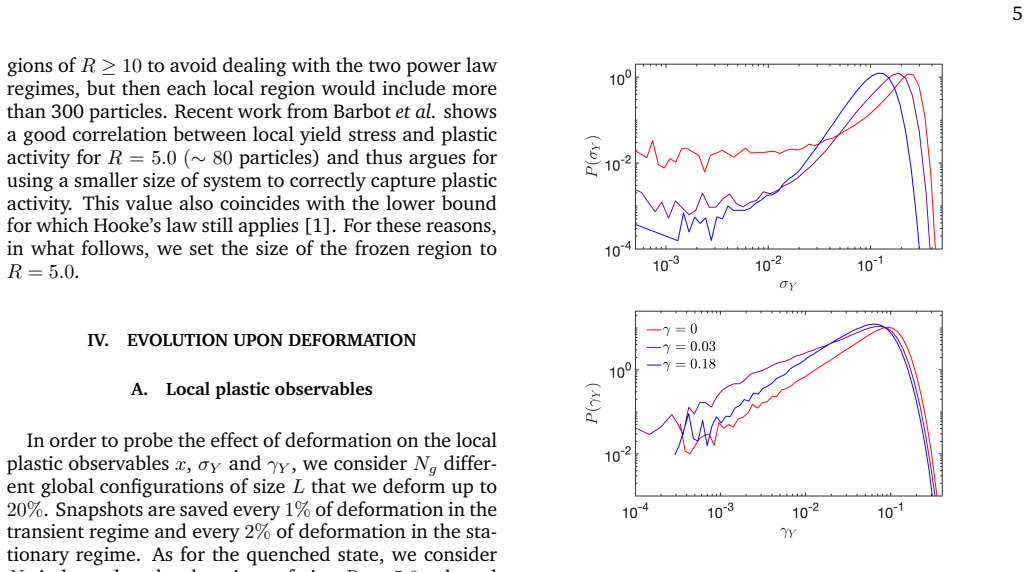
Summary. The manuscript uses the frozen-matrix (FM) method in a two-dimensional Lennard-Jones glass under athermal quasistatic shear to measure distributions of the local residual stress x = σY − σ0. In quenched states, P(x) shows a pseudogap form P(x) ~ x^θ with θ ≈ 0.6, consistent with extreme-value scaling of the weakest sites in unconstrained global simulations and with prior work. Under deformation, the authors report that P(x) becomes analytic at small x and develops a system-size-dependent plateau of height p0 ~ L^-p (p = 0.15 transient, p = 0.27 steady state) with a crossover xc ~ L^-0.78. They attribute this plateau to the discreteness of the mechanical noise, characterized by the lower cutoff Δxc ~ L^-1.05 of the distribution of residual-stress differences between consecutive avalanches. They also report that local yield stresses change even for regions that do not undergo plastic rearrangements, and they compare FM-derived scaling exponents with global AQS exponents, finding good agreement in the transient regime but overestimation in the steady state.
Significance. If the deformation-induced plateau is real, it would qualify or modify pseudogap-based scaling relations for the yielding transition, and the observation of changing local yield stress in non-yielding regions would challenge standard elastoplastic-model assumptions. The paper is commendable for cross-checking the quiescent pseudogap exponent by two independent routes (FM P(x) giving θ1 = 0.58, and global extreme-value scaling giving θ ≈ 0.61–0.65 in Fig. 2), and for using unconstrained global AQS exponents (αS, α⟨xmin⟩) as an independent falsification test of the FM-derived values. The explicit acknowledgment of FM artefacts and the discussion of conditions under which scaling relations survive (Section V) add value. However, the central plateau claim currently rests on a single protocol at R = 5.0, a region size for which the paper itself documents boundary-induced artefacts, and the reported scaling exponents are not internally consistent with the proposed noise-discreteness mechanism.
major comments (3)
- [IV.B and Fig. 6] The attribution of the plateau to the discreteness of mechanical noise is internally inconsistent with the reported scaling exponents. For the form P(x) = p0 + x^θ with p0 ~ L^-p, the crossover xc where the plateau and power law balance must scale as xc ~ p0^{1/θ} ~ L^{-p/θ}. Using the steady-state values p = 0.27 and xc ~ L^-0.78 gives θ ≈ 0.35. This does not match the pseudogap exponents θFM ≈ 0.5–0.6 used in Section IV.C, nor the quiescent value θ ≈ 0.6. Furthermore, if Δxc is the microscopic discretization scale that sets the plateau, one would expect xc ~ Δxc ~ L^-1.05, not the measured xc ~ L^-0.78; the discrepancy of a factor L^0.27 is not addressed. The text's statement that the scaling of Δxc is 'reasonably close' to that of xc is not supported by the quoted exponents, and the consistency relation p = qθ should be checked explicitly or the mechanism revised.
- [III and V] The plateau is established only for R = 5.0, the same region size for which Section III documents an FM-induced second power-law regime (θ2 ≈ 1.3) caused by the truncation of nonaffine displacements at the frozen boundary. Section V concedes that the contribution of ΔσY to Δx is 'somehow overestimated' in the FM calculation and that 'the plateau thus appears sooner than in the actually sampled residual stress distributions.' Because P(x), P(Δx), and Δxc are all measured in the same FM setup, the observed correlation between the plateau entrance and Δxc (Fig. 6) is not an independent test of the causal claim. No variable-R study of the plateau or alternative boundary treatment is reported. To support the central claim of Section IV.B, the authors need to show that the plateau persists for larger R or under a different boundary condition, and that its location is not set by the FM-induced overestimate of ΔσY.
- [IV.C and V] The paper's own global simulations provide a direct quantitative test of the plateau interpretation, and that test fails. Using αFM = d − p gives αFM = 1.85 (transient) and 1.73 (steady state), whereas the unconstrained global values are αS = 1.55 (transient) and 1.27 (steady state). The authors acknowledge this discrepancy in Section V, noting that the scaling of ⟨xmin⟩ is 'not consistent with that predicted from the plateau itself.' This admission undermines the relevance of the measured plateau for the scaling of the weakest sites, which is the quantity that the noise-discreteness mechanism is intended to explain. At minimum, the paper should reconcile the global ⟨xmin⟩ scaling with the plateau picture, or state more precisely in which observable the plateau is expected to be visible.
minor comments (5)
- [II.B] The reference for the AQS protocol is missing: 'AQS protocol []' appears without a citation. Please supply the appropriate reference or remove the empty brackets.
- [IV.B] The notation is inconsistent between P(Δx), P(|Δx|), and P(σ0) in Figure 7 and the text. Since the distributions are of absolute values, please define the symbol P(|·|) once and use it uniformly.
- [IV.B] There is a typo in the text: 'reasoably close' should be 'reasonably close.'
- [IV.B and Fig. 6] The reported exponents p = 0.15 and p = 0.27, as well as xc ~ L^-0.78 and Δxc ~ L^-1.05, are quoted without uncertainties or a description of the fitting procedure. Given that only four system sizes (L = 53, 100, 200, 300) are used, error bars or a sensitivity analysis would help assess the robustness of these values.
- [III] The text refers to 'Ng = 5·10^4 quenched global configurations' and 'Nℓ ≥ 2·10^5 independent local sites,' but the LaTeX macro for Nℓ appears broken in places (printed as 'N𝓁'). Please ensure the notation renders correctly.
Circularity Check
No significant circularity: the paper's plateau and mechanical-noise claims rest on separate observables and are checked against independent global AQS scaling.
full rationale
The derivation chain is self-contained and does not reduce to its inputs. The paper measures P(x) and P(Delta x) as distinct observables from the same FM simulations, but the plateau hypothesis is not obtained by renaming a fitted parameter: the plateau height p0 and crossover xc come from P(x), whereas the noise cutoff Delta xc comes from the separately measured distribution P(|Delta x|). The comparison between xc and Delta xc is used as a consistency test, and the paper explicitly reports that the two scalings are only 'reasonably close' (L^-0.78 vs L^-1.05), not identical. Moreover, the paper validates the FM-derived pseudogap exponent against independent global AQS quantities: the Weibull fits to P(xmin), the extreme-value relation theta=2/alpha-1 from <xmin> ~ L^-alpha, and the global stress-drop exponent alpha_S. These comparisons genuinely can fail, and the paper reports that alpha_FM overestimates the steady-state exponent, which is a falsifying outcome rather than a forced consistency. The FM boundary is a possible source of artefacts, and the paper itself flags in Section V that the Delta sigma_Y contribution to Delta x 'is somehow overestimated' and that 'the plateau thus appears sooner than in the actually sampled residual stress distributions.' That caveat is an acknowledged correctness risk about the frozen boundary, not a circular derivation. References to prior FM work (Patinet et al., Barbot et al.) are not self-citations of the present authors, and the choice R=5.0 is justified by external published correlations with plastic activity, not by a uniqueness theorem from the authors. No load-bearing step is defined in terms of the quantity it is supposed to explain.
Assumptions & free parameters
free parameters (5)
- Plastic event threshold κ =
30
- Local region radius R =
5.0
- AQS strain increment δγ =
5e-5
- Plateau averaging range =
x <= 1e-3
- CDF inversion constants c =
30 and 1000
assumptions (5)
- domain assumption Frozen matrix method reproduces unconstrained local yield properties for weak sites.
- domain assumption Local residual stresses x are independent and identically distributed across non-overlapping sites for extreme-value statistics.
- domain assumption Noise kicks follow a truncated Pareto distribution with lower cutoff scaling L^-2/µ.
- domain assumption A random walk with absorbing boundary and discrete noise explains the plateau from the noise cutoff.
- domain assumption The energy criterion κ≤GB/(2ρ) correctly separates elastic and plastic AQS steps.
Cite this review
Pith. "Pith review of Residual stress distributions in athermally deformed amorphous solids from atomistic simulations." pith.science (2026). https://pith.science/paper/VVXNWGV2
@misc{pith2026190801081,
  author       = {Pith},
  title        = {Pith review of: Residual stress distributions in athermally deformed amorphous solids from atomistic simulations},
  year         = {2026},
  howpublished = {\url{https://pith.science/paper/VVXNWGV2}},
  note         = {Machine review of arXiv:1908.01081}
}
read the original abstract
The distribution of local residual stresses (threshold to instability) that controls the statistical properties of plastic flow in athermal amorphous solids is examined with an atomistic simulation technique. For quiescent configurations, the distribution has a pseudogap (power-law) form with an exponent that agrees well with global yielding statistics. As soon as deformation sets in, the pseudogap region gives way to a system size dependent plateau at small residual stresses that can be understood from the statistics of local residual stress {\em differences} between plastic events. Results further suggest that the local yield stress in amorphous solids changes even if the given region does not participate in plastic activity.
Figures


Figures from the paper (8 more)




Forward citations
Cited by 1 Pith paper
-
Elastic avalanches reveal marginal behaviour in amorphous solids
Avalanches in the elastic regime of Lennard-Jones glasses are power-law distributed with exponent about 1 in both 2D and 3D, matching mean-field predictions for marginally stable amorphous solids.
Reference graph
Works this paper leans on
-
[1]
During the affine deformation the strain energy density evolves with respect to the starting config- uration as: ρUaff =ρUIS +σ0δγ + GB 2 (δγ)2 (7) 10 FIG. 10. Probability distribution function ofκ whereκ has been computed for each strain increment δγ. The vertical solid line represents the lower bound ofκ to detect plastic events. where σ0 and UIS are resp...
-
[2]
After the relaxation the strain energy density with respect to starting configuration is given by: ρU0 =ρUIS +σ0δγ + G 2 (δγ)2 (8) whereG is the shear modulus. Consequently the difference in strain energy density gives: ρ(Uaff−U0) = GB−G 2 (δγ)2 (9) Finally , we can estimate an upper bound for κ in the elastic regime: κ = GB−G 2ρ ≤ GB 2ρ (10) We determine ...
-
[3]
Jain, Kevin Van Workum, Paul F
Kenji Yoshimoto, Tushar S. Jain, Kevin Van Workum, Paul F. Nealey , and Juan J. de Pablo. Mechanical hetero- geneities in model polymer glasses at small length scales. Phys. Rev. Lett., 93:175501, Oct 2004
work page 2004
-
[4]
Local elasticity map and plasticity in a model lennard-jones glass
Michel Tsamados, Anne Tanguy , Chay Goldenberg, and Jean-Louis Barrat. Local elasticity map and plasticity in a model lennard-jones glass. Phys. Rev. E , 80:026112, Aug 2009
work page 2009
-
[5]
P Wittmer, A Tanguy , J.-L Barrat, and L Lewis
J. P Wittmer, A Tanguy , J.-L Barrat, and L Lewis. Vibra- tions of amorphous, nanometric structures: When does continuum theory apply? Europhysics Letters (EPL) , 57(3):423–429, feb 2002
work page 2002
-
[6]
Francesco Puosi, Julien Olivier, and Kirsten Martens. Probing relevant ingredients in mean-field approaches for the athermal rheology of yield stress materials. Soft Mat- ter, 11:7639–7647, 2015
work page 2015
-
[7]
P. Sollich. CECAM meeting, 2011
work page 2011
-
[8]
11 Measuring spatial distribution of the local elastic modulus in glasses
Hideyuki Mizuno, Stefano Mossa, and Jean-Louis Barrat. 11 Measuring spatial distribution of the local elastic modulus in glasses. Phys. Rev. E, 87:042306, Apr 2013
work page 2013
Show all 36 references
-
[9]
Falk, Damien Vandembroucq, and Sylvain Patinet
Armand Barbot, Matthias Lerbinger, Anier Hernandez- Garcia, Reinaldo Garc´ıa-Garc´ıa, Michael L. Falk, Damien Vandembroucq, and Sylvain Patinet. Local yield stress statistics in model amorphous solids. Phys. Rev. E , 97:033001, Mar 2018
2018
-
[10]
Role of thermal expansion heterogeneity in the cryogenic rejuvenation of metallic glasses
Baoshuang Shang, Pengfei Guan, and Jean-Louis Barrat. Role of thermal expansion heterogeneity in the cryogenic rejuvenation of metallic glasses. Journal of Physics: Mate- rials, 1(1):015001, sep 2018
2018
-
[11]
Sylvain Patinet, Damien Vandembroucq, and Michael L. Falk. Connecting local yield stresses with plastic activity in amorphous solids. Phys. Rev. Lett. , 117:045501, Jul 2016
2016
-
[12]
Soft modes and nonaffine rearrange- ments in the inherent structures of supercooled liquids
Majid Mosayebi, Patrick Ilg, Asaph Widmer-Cooper, and Emanuela Del Gado. Soft modes and nonaffine rearrange- ments in the inherent structures of supercooled liquids. Phys. Rev. Lett., 112:105503, Mar 2014
2014
-
[13]
Rejuvena- tion and shear banding in model amorphous solids
Armand Barbot, Matthias Lerbinger, Ana ¨el Lema ˆıtre, Damien Vandembroucq, and Sylvain Patinet. Rejuvena- tion and shear banding in model amorphous solids. Phys. Rev. E, 101:033001, Mar 2020
2020
-
[14]
M. L. Manning and A. J. Liu. Vibrational modes identify soft spots in a sheared disordered packing.Phys. Rev. Lett., 107:108302, Aug 2011
2011
-
[15]
Following refs
originally to investigate the properties of 2D qua- sicrystals. Following refs. [9, 16], the NL large and NS small particles interact through the potential: Uab(r) = 4εab [(σab r )12 − (σab r )6] +US, ∀ r≤rin 4∑ k=0 Ckrk ∀ ,rin <r ≤rcut 0, ∀ r>r cut (1) where{a...
-
[16]
Falk, Yongqiang Cheng, and Evan Ma
Jun Ding, Sylvain Patinet, Michael L. Falk, Yongqiang Cheng, and Evan Ma. Soft spots and their structural sig- nature in a metallic glass. Proceedings of the National Academy of Sciences , 111(39):14052–14056, 2014
2014
-
[17]
Patrick Royall and Stephen R
C. Patrick Royall and Stephen R. Williams. The role of local structure in dynamical arrest. Physics Reports, 560:1 – 75, 2015. The role of local structure in dynamical arrest
2015
-
[18]
Lanc ¸on and L
F. Lanc ¸on and L. Billard. Two-dimensional system with a quasi-crystalline ground state. J. Phys. France, 49(2):249– 256, 1988
1988
-
[19]
M. L. Falk and J. S. Langer. Dynamics of viscoplastic defor- mation in amorphous solids. Phys. Rev. E, 57:7192–7205, Jun 1998
1998
-
[20]
S. J. Plimpton. Fast parallel algorithms for short-range molecular dynamics. J Comp Phys , 117, 1995
1995
-
[21]
Locality and nonlocal- ity in elastoplastic responses of amorphous solids
Edan Lerner and Itamar Procaccia. Locality and nonlocal- ity in elastoplastic responses of amorphous solids. Phys. Rev. E, 79:066109, Jun 2009
2009
-
[22]
Statistical physics of the yielding transition in amorphous solids
Smarajit Karmakar, Edan Lerner, and Itamar Procaccia. Statistical physics of the yielding transition in amorphous solids. Phys. Rev. E, 82:055103, Nov 2010
2010
-
[23]
H. G. E. Hentschel, Prabhat K. Jaiswal, Itamar Procaccia, and Srikanth Sastry . Stochastic approach to plasticity and yield in amorphous solids. Phys. Rev. E , 92:062302, Dec 2015
2015
-
[24]
On the density of shear transforma- tions in amorphous solids
Jie Lin, Alaa Saade, Edan Lerner, Alberto Rosso, and Matthieu Wyart. On the density of shear transforma- tions in amorphous solids. EPL (Europhysics Letters) , 105(2):26003, jan 2014
2014
-
[25]
Mean-field description of plastic flow in amorphous solids
Jie Lin and Matthieu Wyart. Mean-field description of plastic flow in amorphous solids. Phys. Rev. X, 6:011005, Jan 2016
2016
-
[26]
Botond Tyukodi, Damien Vandembroucq, and Craig E. Maloney . Avalanches, thresholds, and diffusion in mesoscale amorphous plasticity . Phys. Rev. E , 100:043003, Oct 2019
2019
-
[27]
E. E. Ferrero and E. A. Jagla. Criticality in elastoplastic models of amorphous solids with stress-dependent yield- ing rates. Soft Matter, 15:9041–9055, 2019
2019
-
[28]
Majumdar
Andrea Zoia, Alberto Rosso, and Satya N. Majumdar. Asymptotic behavior of self-affine processes in semi- infinite domains. Phys. Rev. Lett., 102:120602, Mar 2009
2009
-
[29]
Albaret, A
T. Albaret, A. Tanguy , F. Boioli, and D. Rodney . Mapping between atomistic simulations and eshelby inclusions in the shear deformation of an amorphous silicon model. Phys. Rev. E, 93:053002, May 2016
2016
-
[30]
Indeed as reducing the size implies larger γY between events, we did not record enough stress drops on a strain interval of 2%
The statistics for the noise obtained for the smallest sys- temL = 53 is not good enough to extract any reliable in- formation. Indeed as reducing the size implies larger γY between events, we did not record enough stress drops on a strain interval of 2%
-
[31]
Fern ´andez Aguirre and E
I. Fern ´andez Aguirre and E. A. Jagla. Critical exponents of the yielding transition of amorphous solids. Phys. Rev. E, 98:013002, Jul 2018
2018
-
[32]
Michael Salerno and Mark O
K. Michael Salerno and Mark O. Robbins. Effect of in- ertia on sheared disordered solids: Critical scaling of avalanches in two and three dimensions. Phys. Rev. E , 88:062206, Dec 2013
2013
-
[33]
Ferrero, Francesco Puosi, Jean- Louis Barrat, and Kirsten Martens
Chen Liu, Ezequiel E. Ferrero, Francesco Puosi, Jean- Louis Barrat, and Kirsten Martens. Driving rate depen- dence of avalanche statistics and shapes at the yielding transition. Phys. Rev. Lett., 116:065501, Feb 2016
2016
-
[34]
Random critical point separates brittle and ductile yielding transitions in amorphous ma- terials
Misaki Ozawa, Ludovic Berthier, Giulio Biroli, Alberto Rosso, and Gilles Tarjus. Random critical point separates brittle and ductile yielding transitions in amorphous ma- terials. Proceedings of the National Academy of Sciences , 115(26):6656–6661, 2018
2018
-
[35]
Deformation and flow of amor- phous solids: Insights from elastoplastic models
Alexandre Nicolas, Ezequiel E Ferrero, Kirsten Martens, and Jean-Louis Barrat. Deformation and flow of amor- phous solids: Insights from elastoplastic models. Reviews of Modern Physics , 90(4):045006, 2018
2018
-
[36]
Scaling description of the yielding transition in soft amor- phous solids at zero temperature
Jie Lin, Edan Lerner, Alberto Rosso, and Matthieu Wyart. Scaling description of the yielding transition in soft amor- phous solids at zero temperature. Proceedings of the Na- tional Academy of Sciences , 111(40):14382–14387, 2014
2014
Reviewed August 14, 2026 · model on record in the stance chip above.
Discussion (0). Continue with ORCID to comment.