REVIEW 3 major objections 5 minor 36 references
Real-time Deep Learning at the Edge for Scalable Reliability Modeling of Si-MOSFET Power Electronics Converters
T0 review · 3 major / 5 minor · reviewed 2026-08-14 · deepseek-v4-flash
Pith's one-line read A stacked LSTM trained on four MOSFETs' resistance histories can predict a fifth device's degradation trajectory with about 9% error at the 0.05-ohm warning threshold, running in 26 ms on an embedded edge board.
desk verdict A useful edge-reliability application, but the headline accuracy is compromised by test-set-based model selection in Algorithm 1. read the letter →
The pith
A machine-rendered reading of the paper's core claim, the machinery that carries it, and where it could break.
The reading
What carries the argument
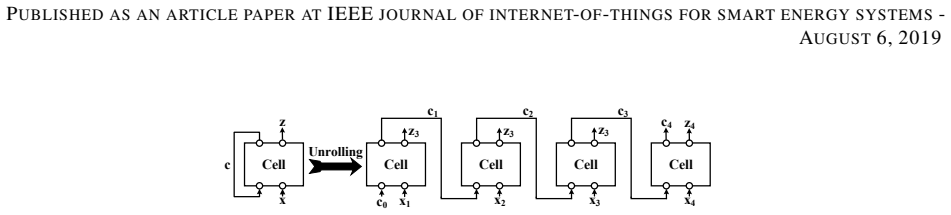
The load-bearing mechanism is a stacked LSTM: four LSTM layers with 64 hidden units each, followed by a dense layer that maps the normalized hidden state $h_t$ back to physical $\Delta R_{\mathrm{ds(on)}}$ values. Training batches are three-dimensional tensors built from randomly selected sequences of length $\tau + n = 21 + 104$ from each of $m$ devices, so every gradient update sees multiple devices' degradation patterns. The input size is $k=1$: only the resistance trajectory, not voltage, current, or temperature, is fed to the network. The same computation graph is trained on the cloud and then shipped to the edge node, where inference evaluates the LSTM equations on the embedded processor.
What would settle it
Run Deep RACE on resistance histories collected from MOSFETs in a high-frequency converter under varying load and temperature. If the average absolute error at the 0.05 ohm threshold exceeds 8.93%, or if feeding voltage, current, and temperature as additional inputs materially reduces the error, then the single-input collective-training claim is not general.
Extended reading notes
Core claim
The paper's central claim is that aggregating degradation knowledge across many devices of the same underlying physics, rather than fitting each device in isolation, is what makes accurate unseen-device prediction possible. For each test, the network is trained from scratch on four devices' $\Delta R_{\mathrm{ds(on)}}$ sequences and asked to forecast 104 future resistance samples of the fifth device from the last 21 observed samples. The resulting predictions track the measured trajectories, with the error-distribution plots showing average maximum error below 0.9% and the 0.05-$\Omega$ detection point showing $8.93\%$ absolute error. The paper also reports that increasing the number of devices in each training batch lowers prediction MSE at an exponential rate, and that the trained inference runs in real time on a low-power embedded processor.
Load-bearing premise
The claimed accuracy rests on the premise that the resistance trajectory alone encodes enough degradation information, and that the accelerated-aging trajectories used for training behave like real converter duty cycles; if either fails, the leave-one-device numbers will not transfer to the field.
Editorial extensions
If this is right
- A converter entering service can receive a reliability model trained on its predecessors before it accumulates any failure data of its own.
- As edge nodes are added and their resistance histories join the training pool, prediction error should keep falling, since the paper measures an exponential drop in MSE with more devices per batch.
- The 0.05 ohm detection point can be used as an early-warning threshold to trigger load sharing or maintenance before resistance wear becomes critical.
- The same cloud-training/edge-inference structure applies to other semiconductor families as long as a measurable degradation precursor time series exists.
Reading between the lines
- Beyond the paper: the evaluation uses only resistance sequences from an accelerated-aging campaign, so in the field, where load, thermal, and environmental histories vary, the single-input model may need voltage, current, or temperature channels to hold its 8.93% error; a direct field trial is the natural next test.
- If resistance history alone suffices, edge nodes could upload only $\Delta R_{\mathrm{ds(on)}}$ samples instead of raw multi-channel telemetry, sharply reducing cloud bandwidth.
- The exponential improvement with fleet size suggests a continual-learning loop: each edge device's later measurements could be recycled as training data to retrain the shared model, making the fleet collectively smarter over its lifetime.
- The same edge-cloud contract could be transferred to IGBT or GaN devices by swapping in their precursor signals, though the paper demonstrates only Si-MOSFETs.
Signed reviews
Editorial analysis
A structured set of objections, weighed in public.
Referee Report
Summary. The paper presents Deep RACE, a cloud-edge system for real-time reliability modeling of Si-MOSFET power converters. The algorithm side is a stacked LSTM trained in the cloud on aggregated delta-Rds(on) trajectories from multiple devices, with inference deployed on an NVIDIA TX2 edge node. The authors evaluate the approach on five NASA accelerated-aging MOSFET datasets in a leave-one-device-out protocol, reporting a miss-prediction error of 8.93% at the 0.05-ohm detection point, improvements of 1.98x and 1.77x over Kalman Filter and Particle Filter baselines, and measured edge inference cost of 26 ms and 1.87 W. The paper also describes scalability of the aggregated training and a prototype hardware setup.
Significance. If the reported accuracy holds under a clean evaluation protocol, the work would be a useful demonstration of collective deep-learning-based prognostics for power semiconductors, and the measured edge deployment figures (26 ms, 1.87 W) provide concrete evidence of feasibility. The open-source availability of the code is also a strength. However, the central quantitative claim is compromised by a test-set model-selection step in the training algorithm, so the significance of the result depends on whether the evaluation can be corrected and the conclusions re-established.
major comments (3)
- [Algorithm 1, Section 4.2.1] Algorithm 1, lines 12-18, uses the held-out device's Xtest and Ytest inside the training loop to select and save the network with the minimum test error. This is test-set-based model selection: the reported Tables 3 and 4 are produced from a checkpoint chosen using the labels of the supposedly unseen device. Because the Kalman Filter and Particle Filter baselines receive no such selection advantage, the claimed 1.98x and 1.77x improvements are not fairly established. The evaluation must be changed so that the test device contributes no information to training or model selection; for example, use a validation set drawn from the training devices for checkpoint selection, or use nested cross-validation.
- [Section 5.3, Table 4] Table 4 reports a single miss-prediction number per method, with no variance, error bars, or repeated-run statistics. Given the LSTM's random initialization (Algorithm 1, line 5) and the small five-device sample, a single run cannot support the claim of superiority. Report the mean and standard deviation over multiple random seeds and, ideally, a paired statistical comparison with the baselines.
- [Section 5.3, Fig. 10] The text describes the leave-one-device experiment as predicting a 'completely new and unknown device,' but the algorithm actually uses the test device's full trajectory for model selection at every iteration. This contradicts the generalization claim. The experimental protocol must be revised so that no information from the test device reaches the training or model-selection pipeline; otherwise the 8.93% figure is an optimistic in-sample selection result, not an unbiased forecast.
minor comments (5)
- [Abstract and Section 5.3] The abstract reports '8.9%' while Table 4 reports '8.93%'; unify the rounding for consistency.
- [Section 5.3, Eq. (15)] The notation in Eq. (15), especially the subscript/superscript 'mt5%', is not defined clearly; please define m, t5%, and the meaning of the superscript in the equation or its caption.
- [Section 3.1 and Section 4.1.2] There are several language errors, such as 'infertile' in Section 3.1 (should likely be 'ineffective') and 'patriarchy' in Section 4.1.2 (should be 'hierarchy'). A careful proofreading pass is needed.
- [Section 4.2.2 and Table 1] Section 4.2.2 states that the edge node continuously monitors voltage, current, and temperature, but the LSTM input size is k=1 (Table 1), so only delta Rds(on) is used. Clarify whether the other signals are used by the reliability model or only by the controller for other purposes.
- [Section 5.3, Fig. 12] The y-axis of Fig. 12 is labeled log(MSE) with negative values; clarify whether the plotted quantity is log10(MSE) and describe the Monte-Carlo averaging procedure more precisely.
Circularity Check
Algorithm 1 selects the saved checkpoint by minimizing loss on the held-out device, making the headline 8.93% error and 1.98x/1.77x gains test-selected rather than clean predictions.
-
fitted input called prediction
[Section 4.2.1 (Algorithm 1, lines 12-18); reported in Section 5.3, Table 4]
"In order to prevent the over-fitting problem, we have created a test batch (xtest,ytest) to predict ∆Rds(on) of the test device based on the updated network model. Next, the test batcherror will be compared against the previous error values and if it has the minimum value, the network model will be saved."
The saved model is the one whose loss on Xtest/Ytest is minimal during training, because Algorithm 1 feeds the held-out device's data into the checkpoint-selection loop (lines 12-18). Tables 3-4 then report errors from this test-selected model as predictions for a 'completely new and unknown device.' The held-out trajectory is therefore an input to the reported prediction: the 8.93% endpoint error is an in-sample minimum over checkpoints, not an unbiased leave-one-device generalization estimate, and the Kalman/Particle baselines are not shown to receive the same selection advantage.
full rationale
The paper's modeling chain is otherwise self-contained: the LSTM equations (7)-(12) are standard, the stacked architecture and dense de-normalization are clearly specified, and the NASA dataset is external. The only self-citation, [35], is used merely to note that design-space exploration is possible and is not load-bearing. The central circularity risk is the training protocol: Algorithm 1 evaluates the loss on Xtest,Ytest inside the training loop and saves the network whenever that test loss is a new minimum. Consequently, the weights that produce Tables 3-4 are a function of the held-out device's trajectory, so the reported 'unseen device' accuracy and the factor-of-1.98/1.77 improvements over Kalman/Particle filters are optimistic in-sample selection results rather than clean forecasts. Because this affects the paper's central quantitative claim, the score is 6. If this test-set model selection were replaced by a proper validation split, the remaining derivation would contain no significant circularity.
Assumptions & free parameters
free parameters (8)
- Number of hidden units =
64
- Number of stacked layers =
4
- Input sequence length tau =
21
- Output sequence length n =
104
- Maximum iterations =
1000
- Error threshold =
0.00005
- Adam learning rate =
not reported
- Number of devices per batch m =
4
assumptions (5)
- standard math LSTM equations and backpropagation through time are assumed correct and trainable.
- domain assumption Delta Rds(on) is a valid precursor for MOSFET degradation.
- domain assumption The NASA IRF520NPbf accelerated-aging dataset is representative of real converter degradation.
- domain assumption Five same-part devices share enough underlying physics for leave-one-device generalization.
- domain assumption Random window sampling and truncated normal initialization give unbiased training.
Cite this review
Pith. "Pith review of Real-time Deep Learning at the Edge for Scalable Reliability Modeling of Si-MOSFET Power Electronics Converters." pith.science (2026). https://pith.science/paper/VWHGQRNA
@misc{pith2026190801244,
  author       = {Pith},
  title        = {Pith review of: Real-time Deep Learning at the Edge for Scalable Reliability Modeling of Si-MOSFET Power Electronics Converters},
  year         = {2026},
  howpublished = {\url{https://pith.science/paper/VWHGQRNA}},
  note         = {Machine review of arXiv:1908.01244}
}
abstract
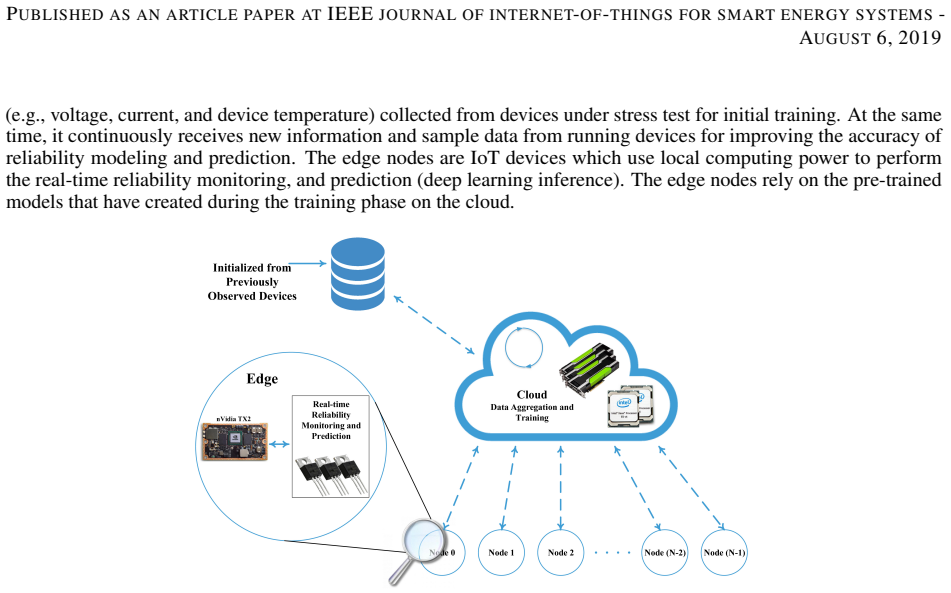
With the significant growth of advanced high-frequency power converters, on-line monitoring and active reliability assessment of power electronic devices are extremely crucial. This article presents a transformative approach, named Deep Learning Reliability Awareness of Converters at the Edge (Deep RACE), for real-time reliability modeling and prediction of high-frequency MOSFET power electronic converters. Deep RACE offers a holistic solution which comprises algorithm advances, and full system integration (from the cloud down to the edge node) to create a near real-time reliability awareness. On the algorithm side, this paper proposes a deep learning algorithmic solution based on stacked LSTM for collective reliability training and inference across collective MOSFET converters based on device resistance changes. Deep RACE also proposes an integrative edge-to-cloud solution to offer a scalable decentralized devices-specific reliability monitoring, awareness, and modeling. The MOSFET convertors are IoT devices which have been empowered with edge real-time deep learning processing capabilities. The proposed Deep RACE solution has been prototyped and implemented through learning from MOSFET data set provided by NASA. Our experimental results show an average miss prediction of $8.9\%$ over five different devices which is a much higher accuracy compared to well-known classical approaches (Kalman Filter, and Particle Filter). Deep RACE only requires $26ms$ processing time and $1.87W$ computing power on Edge IoT device.
Figures


Figures from the paper (9 more)




Reference graph
Works this paper leans on
-
[1]
Power electronics for distributed energy systems and transmission and distribution applications,
L. Tolbert, T. King, B. Ozpineci, J. Campbell, G. Muralidharan, D. Rizy, A. Sabau, H. Zhang, W. Zhang, Y . Xu et al., “Power electronics for distributed energy systems and transmission and distribution applications,” ORNL/TM-2005/230, UT-Battelle, LLC, Oak Ridge National Laboratory , vol. 8, 2005
work page 2005
-
[2]
Design for reliability of power electronic systems,
Y . Yang, H. Wang, A. Sangwongwanich, and F. Blaabjerg, “Design for reliability of power electronic systems,” in Power Electronics Handbook (F ourth Edition). Elsevier, 2018, pp. 1423–1440
work page 2018
-
[3]
K. Ma, H. Wang, and F. Blaabjerg, “New Approaches to Reliability Assessment: Using physics-of-failure for prediction and design in power electronics systems,” IEEE Power Electronics Magazine, vol. 3, no. 4, pp. 28–41, 2016
work page 2016
-
[4]
Metrics for evaluating performance of prognostic techniques,
A. Saxena, J. Celaya, E. Balaban, K. Goebel, B. Saha, S. Saha, and M. Schwabacher, “Metrics for evaluating performance of prognostic techniques,” inPrognostics and health management, 2008. PHM 2008. international conference on . IEEE, 2008, pp. 1–17
work page 2008
-
[5]
H. S.-h. Chung, H. Wang, F. Blaabjerg, and M. Pecht, Reliability of power electronic converter systems . Institution of Engineering and Technology, 2015
work page 2015
-
[6]
Review of Internet of Things (IoT) in Electric Power and Energy Systems,
G. Bedi, G. K. Venayagamoorthy, R. Singh, R. R. Brooks, and K.-C. Wang, “Review of Internet of Things (IoT) in Electric Power and Energy Systems,” IEEE Internet of Things Journal , vol. 5, no. 2, pp. 847–870, 2018
work page 2018
-
[7]
Predictive scheduling framework for electric vehicles with uncertainties of user behaviors,
B. Wang, Y . Wang, H. Nazaripouya, C. Qiu, C.-C. Chu, and R. Gadh, “Predictive scheduling framework for electric vehicles with uncertainties of user behaviors,” IEEE Internet of Things Journal , vol. 4, no. 1, pp. 52–63, 2017
work page 2017
-
[8]
Condition monitoring for device reliability in power electronic converters: A review,
S. Yang, D. Xiang, A. Bryant, P. Mawby, L. Ran, and P. Tavner, “Condition monitoring for device reliability in power electronic converters: A review,” IEEE Transactions on Power Electronics, vol. 25, no. 11, pp. 2734–2752, 2010
work page 2010
Show all 36 references
-
[9]
A Review of prognostics and health management for power semiconductor modules,
N. Degrenne, J. Ewanchuk, E. David, R. Boldyrjew, and S. Mollov, “A Review of prognostics and health management for power semiconductor modules,” 2014
2014
-
[10]
Prognostics approach for power MOSFET under thermal-stress aging,
J. R. Celaya, A. Saxena, C. S. Kulkarni, S. Saha, and K. Goebel, “Prognostics approach for power MOSFET under thermal-stress aging,” in Reliability and Maintainability Symposium (RAMS), 2012 Proceedings-Annual . IEEE, 2012, pp. 1–6
2012
-
[11]
Application of coupled electro-thermal and physics-of-failure-based analysis to the design of accelerated life tests for power modules,
M. Musallam, C. Yin, C. Bailey, and C. M. Johnson, “Application of coupled electro-thermal and physics-of-failure-based analysis to the design of accelerated life tests for power modules,”Microelectronics Reliability, vol. 54, no. 1, pp. 172–181, 2014
2014
-
[12]
Computationally efficient, real-time, and embeddable prognostic techniques for power electronics,
A. Alghassi, S. Perinpanayagam, M. Samie, and T. Sreenuch, “Computationally efficient, real-time, and embeddable prognostic techniques for power electronics,” IEEE Transactions on Power Electronics, vol. 30, no. 5, pp. 2623–2634, 2015
2015
-
[13]
Bayesian remaining useful lifetime prediction of thermally aged power MOSFETs,
M. Heydarzadeh, S. Dusmez, M. Nourani, and B. Akin, “Bayesian remaining useful lifetime prediction of thermally aged power MOSFETs,” in Applied Power Electronics Conference and Exposition (APEC), 2017 IEEE . IEEE, 2017, pp. 2718–2722
2017
-
[14]
Rainflow algorithm-based lifetime estimation of power semiconductors in utility applications,
L. R. GopiReddy, L. M. Tolbert, B. Ozpineci, and J. O. Pinto, “Rainflow algorithm-based lifetime estimation of power semiconductors in utility applications,” IEEE Transactions on Industry Applications , vol. 51, no. 4, pp. 3368–3375, 2015
2015
-
[15]
An accelerated thermal aging platform to monitor fault precursor on-state resistance,
S. Dusmez and B. Akin, “An accelerated thermal aging platform to monitor fault precursor on-state resistance,” in Electric Machines & Drives Conference (IEMDC), 2015 IEEE International . IEEE, 2015, pp. 1352–1358
2015
-
[16]
Uncertainty representation and interpretation in model-based prognostics algorithms based on Kalman Filter estimation,
J. R. Celaya, A. Saxena, and K. Goebel, “Uncertainty representation and interpretation in model-based prognostics algorithms based on Kalman Filter estimation,” National Aeronautics and Space Administration Moffett Field CA Ames Research Center, Tech. Rep., 2012
2012
-
[17]
An active life extension strategy for thermally aged power switches based on pulse-width adjustment method in interleaved converters,
S. Dusmez and B. Akin, “An active life extension strategy for thermally aged power switches based on pulse-width adjustment method in interleaved converters,” IEEE Trans. Power Electron., vol. 31, no. 7, pp. 5149–5160, 2016
2016
-
[18]
Deep learning for accelerated seismic reliability analysis of transportation networks,
M. A. Nabian and H. Meidani, “Deep learning for accelerated seismic reliability analysis of transportation networks,” Computer-Aided Civil and Infrastructure Engineering, vol. 33, no. 6, pp. 443–458. [Online]. Available: https://onlinelibrary.wiley.com/doi/abs/10.1111/mice.12359
-
[19]
Unsupervised deep learning for data-driven reliability and risk analysis of engineered systems,
P. Jiang, M. Maghrebi, A. Crosky, and S. Saydam, “Unsupervised deep learning for data-driven reliability and risk analysis of engineered systems,” in Handbook of Neural Computation. Elsevier, 2017, pp. 417–431
2017
-
[20]
Software reliability prediction using a deep learning model based on the rnn encoder–decoder,
J. Wang and C. Zhang, “Software reliability prediction using a deep learning model based on the rnn encoder–decoder,” Reliability Engineering & System Safety , vol. 170, pp. 73–82, 2018
2018
-
[21]
Examples for failures in power electronics systems,
E. Wolfgang, “Examples for failures in power electronics systems,” ECPE tutorial on reliability of power electronic systems, Nuremberg, Germany , pp. 19–20, 2007
2007
-
[22]
An industry-based survey of reliability in power electronic converters,
S. Yang, A. Bryant, P. Mawby, D. Xiang, L. Ran, and P. Tavner, “An industry-based survey of reliability in power electronic converters,” IEEE transactions on Industry Applications, vol. 47, no. 3, pp. 1441–1451, 2011
2011
-
[23]
New physical model for lifetime estimation of power modules,
I. Kovacevic, U. Drofenik, and J. W. Kolar, “New physical model for lifetime estimation of power modules,” in Power Electronics Conference (IPEC), 2010 International. IEEE, 2010, pp. 2106–2114
2010
-
[24]
On-line condition monitoring for MOSFET and IGBT switches in digitally controlled drives,
J. M. Anderson and R. W. Cox, “On-line condition monitoring for MOSFET and IGBT switches in digitally controlled drives,” in Energy Conversion Congress and Exposition (ECCE), 2011 IEEE . IEEE, 2011, pp. 3920–3927
2011
-
[25]
Stress Test Qualification for Automotive Grade Discrete Semiconductors,
Automotive Electronic Council, “Stress Test Qualification for Automotive Grade Discrete Semiconductors,” 2013. [Online]. Available: hhttp: //www.aecouncil.com/Documents/AEC_Q101_Rev_D1_Base_Document.pdf
2013
-
[26]
Prognostics and health management of electronics,
N. M. Vichare and M. G. Pecht, “Prognostics and health management of electronics,” IEEE transactions on components and packaging technologies, vol. 29, no. 1, pp. 222–229, 2006
2006
-
[27]
Failure mechanism analysis of a discrete 650V enhancement mode GaN-on-Si power device with reverse conduction accelerated power cycling test,
S. Song, S. Munk-Nielsen, C. Uhrenfeldt, and I. Trintis, “Failure mechanism analysis of a discrete 650V enhancement mode GaN-on-Si power device with reverse conduction accelerated power cycling test,” inApplied Power Electronics Conference and Exposition (APEC), 2017 IEEE . IE...
2017
-
[28]
Prognostics of power MOSFETs under thermal stress accelerated aging using data-driven and model-based methodologies,
J. Celaya, A. Saxena, S. Saha, and K. F. Goebel, “Prognostics of power MOSFETs under thermal stress accelerated aging using data-driven and model-based methodologies,” 2011
2011
-
[29]
Toward reliable power electronics: Challenges, design tools, and opportunities,
H. Wang, M. Liserre, and F. Blaabjerg, “Toward reliable power electronics: Challenges, design tools, and opportunities,” IEEE Industrial Electronics Magazine , vol. 7, no. 2, pp. 17–26, 2013. 15 PUBLISHED AS AN ARTICLE PAPER AT IEEE JOURNAL OF INTERNET -OF-THINGS FOR SMART ENE...
2013
-
[30]
Remaining useful lifetime estimation for thermally stressed power MOSFETs based on on-state resistance variation,
S. Dusmez, H. Duran, and B. Akin, “Remaining useful lifetime estimation for thermally stressed power MOSFETs based on on-state resistance variation,” IEEE Transactions on Industry Applications, vol. 52, no. 3, pp. 2554–2563, 2016
2016
-
[31]
Backpropagation through time: what it does and how to do it,
P. J. Werbos, “Backpropagation through time: what it does and how to do it,” Proceedings of the IEEE, vol. 78, no. 10, pp. 1550–1560, 1990
1990
-
[32]
Learning representations by back-propagating errors,
D. E. Rumelhart, G. E. Hinton, and R. J. Williams, “Learning representations by back-propagating errors,” nature, vol. 323, no. 6088, p. 533, 1986
1986
-
[33]
Gradient flow in recurrent nets: the difficulty of learning long-term dependencies,
S. Hochreiter, Y . Bengio, P. Frasconi, J. Schmidhuber et al., “Gradient flow in recurrent nets: the difficulty of learning long-term dependencies,” 2001
2001
-
[34]
Long short-term memory,
S. Hochreiter and J. Schmidhuber, “Long short-term memory,” Neural computation, vol. 9, no. 8, pp. 1735–1780, 1997
1997
-
[35]
High-level design space exploration of locally linear Neuro-fuzzy models for embedded systems,
M. Baharani, H. Noori, M. Aliasgari, and Z. Navabi, “High-level design space exploration of locally linear Neuro-fuzzy models for embedded systems,” Fuzzy Sets Syst., vol. 253, pp. 44–63, Oct. 2014. [Online]. Available: http://dx.doi.org/10.1016/j.fss.2013.12.006
2014 doi
-
[36]
An interleaving and load sharing method for multiphase LLC converters,
Z. Hu, Y . Qiu, Y .-F. Liu, and P. Sen, “An interleaving and load sharing method for multiphase LLC converters,” in Applied Power Electronics Conference and Exposition (APEC), 2013 Twenty-Eighth Annual IEEE . IEEE, 2013, pp. 1421–1428. 16
2013
Reviewed August 14, 2026 · model on record in the stance chip above.
Discussion (0). Continue with ORCID to comment.