REVIEW 4 major objections 6 minor 3 references
Effects of Rate, Size and Prior Deformation in Microcrystal Plasticity
T0 review · 4 major / 6 minor · reviewed 2026-08-14 · deepseek-v4-flash
Pith's one-line read A minimal two-dimensional discrete dislocation model ties rate, size, and prior-deformation effects in microcrystal plasticity into one picture, and strain correlations from a small probe load classify deformation history and predict…
desk verdict A useful review of the authors' own 2D DDD results, plus a supervised ML section whose 'prediction' claim is undercut by an in-sample evaluation protocol. read the letter →
The pith
A machine-rendered reading of the paper's core claim, the machinery that carries it, and where it could break.
The reading
What carries the argument
The carrying object is a minimal two-dimensional discrete dislocation dynamics (2D-DDD) model of uniaxial compression: edge dislocations glide on slip planes inclined at plus or minus 30 degrees, nucleate from randomly distributed sources when the resolved shear stress exceeds a Gaussian-distributed strength for a characteristic nucleation time, and become pinned at randomly placed obstacles, with finite-element image fields enforcing free boundaries. Its explanatory engine is the competition between the nucleation timescale ($\approx 10\,\mathrm{ns}$) and the dislocation-drag timescale ($\approx 10^{-6}\,\mathrm{ns}$), which produces the rate-dependent avalanche crossover and the loading-protocol differences. For the deformation-history results, the machinery is the strain-correlation matrix built from 0.1% probe-load strain fields, whose low-dimensional structure is classified by unsupervised and supervised machine-learning methods.
What would settle it
Run a reduced-three-dimensional (2.5D or full 3D) dislocation simulation with the same source, obstacle, and loading statistics and compare the avalanche size exponent, the width-scaling exponent, and the reload-response classifier; if any deviate beyond the model's reported scatter, the two-dimensional minimal model cannot carry the quantitative claims. Alternatively, apply the strain-correlation classifier to measured surface strain maps from real micropillars with known pre-strain and check whether classification accuracy survives outside the simulation.
Extended reading notes
Core claim
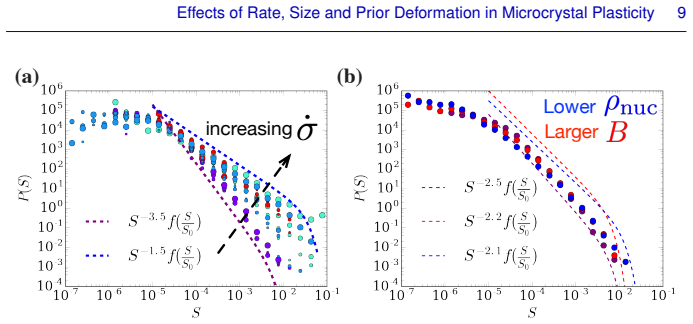
The load-bearing discovery presented is that a two-dimensional plane-strain picture of discrete edge dislocations, with slip planes, random nucleation sources and pinning obstacles, free side surfaces, and no three-dimensional dislocation mechanisms, captures the experimentally observed statistical complexity of small-volume crystal plasticity. Rate effects arise from competition between the nucleation timescale ($\delta t_{\mathrm{nuc}} \approx 10\,\mathrm{ns}$) and a much faster drag timescale (mobility over modulus, $B/E \approx 10^{-6}\,\mathrm{ns}$): near $10^3\,\mathrm{s}^{-1}$ loading rates the dynamics shift from nucleation-dominated to drag-dominated, the avalanche event-size exponent changes from roughly 3.5 toward 1.5 as the stress rate rises, and stress-controlled versus displacement-controlled protocols differ systematically. Size effects appear as $\sigma_Y \sim w^{-0.45}$ with avalanche cutoff $S_0 \sim w^{-1}$, and, for samples first strained to different levels, the resulting dislocation density changes the apparent size-effect exponent $a$, driving it toward zero and promoting a transition to classical dislocation-density-controlled work hardening; the chapter claims this is the first discrete dislocation demonstration of that transition. Finally, spatial strain correlations from a small reloading probe, processed by unsupervised or supervised machine learning, classify prior strain levels (0.1%, 1%, and 10%) with near-perfect accuracy for the larger simulated widths and support average predictions of subsequent mechanical response.
Load-bearing premise
The load-bearing premise is that a two-dimensional plane-strain model of straight edge dislocations, with randomly placed sources and obstacles on one or two slip systems and no cross-slip, junction formation, or climb, reproduces the statistically important behavior of real three-dimensional microcrystal plasticity; the paper notes that no comparisons to reduced-three-dimensional dislocation simulations have been performed.
Editorial extensions
If this is right
- Loading-rate effects in sub-micron crystals are not separate from size and history effects: all three emerge from the same two-dimensional model, with avalanche exponents that depend on rate and loading protocol rather than belonging to a single mean-field class.
- The micropillar size effect is reproduced with a concrete scaling ($\sigma_Y \sim w^{-0.45}$) plus an aspect-ratio dependence ($\sigma_Y \sim \alpha^{-0.36}$) for small widths, so specimen geometry should be reported alongside width in strength comparisons.
- Prior deformation changes later response in a quantifiable way: higher dislocation density from larger prior strain pushes the size-effect exponent toward zero and moves flow behavior toward conventional work hardening, so pre-strained samples should show progressively weaker width dependence.
- Event statistics differ between stress-controlled and displacement-controlled loading, with power-law exponents near 3.5 for displacement control and near 1.5 for high-rate stress control, making loading protocol a control parameter for avalanche statistics.
- Mechanical-state prediction is possible from a small non-invasive strain measurement: strain correlations at 0.1% reload classify prior strain levels with 100% test accuracy in the largest simulated widths and support average predictions of subsequent response.
Reading between the lines
- A testable extension would apply the same strain-correlation classifier to surface displacement fields measured by digital image correlation on real micropillars with known pre-strains; success would move the method from a simulated benchmark to non-destructive mechanical-state characterization.
- The rate-crossover picture implies that three-dimensional mechanisms such as cross-slip or junction formation may shift the crossover strain rate or broaden the transition rather than remove the rate effect; comparing reduced-three-dimensional simulations across rates would locate the boundary of the two-dimensional result.
- If the transition to conventional work hardening with increasing dislocation density is real, annealed pillars should show a clear width-dependent yield stress while heavily pre-strained pillars of the same widths should converge to nearly the same strength, an experiment within reach of current micropillar fabrication.
- The machine-learning classification may be carried partly by coarse features such as shear-band location rather than by the full dislocation state; testing samples with the same pre-strain but different boundary geometries would reveal whether the classifier learns deformation history or geometry.
Signed reviews
Editorial analysis
A structured set of objections, weighed in public.
Referee Report
Summary. This book chapter summarizes and extends a program of 2D discrete dislocation dynamics (DDD) simulations for sub-micron crystal plasticity. The model uses plane-strain edge dislocations on one or two slip systems, with randomly placed sources and obstacles, and is benchmarked against existing experiments. Sections 1.3 and 1.4 report previously published results on rate effects, avalanche statistics, and the size dependence of yield stress, including a claimed power law sigma_Y ~ w^-0.45. Sections 1.5 and 1.6 present machine-learning analyses of strain spatial correlations: an unsupervised classification of prior deformation history and a supervised method that is claimed to 'statistically predict mechanical responses for test data'. Section 1.7 states that the model demonstrates, for the first time in discrete dislocation modeling, a dislocation-density-dependent size effect that promotes a transition to Taylor work hardening.
Significance. If the central claims were fully supported, the significance would be high: a minimal 2D model unifying rate, size, and prior-deformation effects, with an accompanying machine-learning route from strain correlations to future mechanical response, would be a useful contribution to small-scale plasticity. The chapter has genuine strengths: the simulations in Sections 1.3 and 1.4 are statistically sampled over many realizations, have been benchmarked against experimental trends, and are drawn from prior peer-reviewed publications. The authors also explicitly list model limitations, including the absence of 2.5D DDD comparisons and of 3D mechanisms. However, the new predictive claim in Section 1.6 and the dislocation-density-dependent size effect in Figure 1.14 are built on an evaluation protocol that is not out-of-sample, so the chapter's headline claims are not established by the evidence presented. The inconsistency between Table 1.1 and the model description further weakens confidence in the quantitative results.
major comments (4)
- [Sec. 1.6, pp. 19-20 and footnote 1] The claimed 'prediction' of mechanical response is not an out-of-sample prediction. The text states, 'For samples in each class, we assume future deformation features (1% testing deformation) as known, since there is a one-to-one correspondence between testing deformation levels', and the footnote confirms that the same sample loaded to 0.1% testing strain is also loaded to 1% testing strain. The 1% reload responses of the test samples are therefore included in the class averages that are then presented as 'predicted' curves in Figures 1.13 and 1.14. This is class averaging over known outcomes, not prediction on unseen data, and no prediction error metric or held-out comparison is reported. This invalidates the Section 1.6 claim that 'we can statistically predict mechanical responses for test data' and the Section 1.7 claim of 'a precise machine-learning method for mechanical predictions of deformation characteristics'. A proper evaluation would classify the held-out 20%, then compare their actual 1% reload curves against the predicted class averages, reporting quantitative errors such as mean absolute error or R-squared.
- [Sec. 1.2 vs. Table 1.1] The model parameters are internally inconsistent. Section 1.2 specifies the obstacle density as rho_obs = 480 um^-2 and the mean obstacle strength as tau_obs = 300 MPa with 20% standard deviation, and the nucleation time as t_nuc = 10 ns. Table 1.1, however, lists the obstacle density as 'rho_obs = 480 MPa' (dimensionally a stress, not a density) and the average obstacle strength as 'tau_obs = 150 MPa' with 'delta tau_obs = 20 MPa'. Since the obstacle density and strength control the competition between source activation and pinning, these discrepancies make the quantitative results in Sections 1.3 and 1.4, including the reported exponents and size-effect fits, ambiguous. The table should be corrected to match the text, or the text should be corrected and the simulations rerun with the stated parameters.
- [Sec. 1.7 and Fig. 1.14] The headline claim of 'a dislocation-density dependent size-effect that promotes a transition to Taylor work hardening for the very first time in discrete dislocation modeling efforts' rests entirely on Figure 1.14, whose data are the circular class averages described in the first major comment. In addition, the caption of Figure 1.14 labels the ordinate 'maximum predicted stress', while the text on page 21 calls it 'sample yield stress'; these are not interchangeable quantities. Without a genuine out-of-sample evaluation and a consistent definition of the plotted stress, the claimed density-dependent exponent a and the associated Taylor-hardening transition are not established.
- [Sec. 1.2 and Sec. 1.7] The transferability of the 2D model's quantitative predictions to three-dimensional microcrystal plasticity is asserted rather than demonstrated. The manuscript concedes, 'No comparisons to 2.5 DDD simulations have been performed', and lists omitted mechanisms including 3D dislocation motion, cross-slip, boundary roughness effects, and thermal effects. Given these limitations, claims such as sigma_Y ~ w^-0.45, the rate-dependent avalanche-exponent crossover, and the density-dependent size-effect exponent a are presented as statements about experimental microcrystal behavior, but they are only properties of the minimal 2D model. A concrete test would be to compare at least one predicted observable, for example the yield-stress size exponent or the avalanche size distribution, against a 2.5D DDD simulation or against microcrystal experiments with controlled initial dislocation density.
minor comments (6)
- [Sec. 1.3 vs. Fig. 1.3(b)] The text defines the reported flow stress as the average stress 'at 0.2% engineering strain', while the caption of Figure 1.3(b) states 'Size effect of flow stress at 2% strain'. This discrepancy should be resolved.
- [Sec. 1.4] The notation 'P(S) ~ S^-tau P(S/S0)' appears to omit a cutoff function; it should read something like P(S) ~ S^-tau f(S/S0).
- [Sec. 1.2] There are several typographical errors, including 'dislocation singulatirites' and 'sufficiently'; the text would benefit from a careful proofreading pass.
- [Sec. 1.5] The sentence 'A correspondence between strain correlations and prior deformation history is found with 100% success for large systems, .' contains a stray comma and period and should be rewritten.
- [Sec. 1.6, Tables 1.3 and 1.4] With only 50 samples split into three classes and an 80/20 train/test split, the test sets contain roughly 10 samples, so reporting accuracies to 0.1 percentage points, such as 83.3%, is overprecise and may reflect very small test-set counts; this should be stated explicitly.
- [Sec. 1.3] The notation 'E* * 10^4/s' for stress rates is confusing; it should be written as dot_sigma = E* dot_epsilon consistently throughout the section.
Circularity Check
Sec. 1.6's 'predicted' 1% mechanical response is constructed from the known 1% reload responses themselves, so the prediction reduces to per-class averaging; Fig. 1.14's dislocation-density-dependent size effect inherits this in-sample construction.
-
fitted input called prediction
[Sec. 1.6, pp. 19-21, Figs. 1.11-1.13 and footnote 1]
"We show that we can statistically predict mechanical responses for test data (20% of the samples)... For samples in each class, we assume future deformation features (1% testing deformation) as known, since there is a one-to-one correspondence between testing deformation levels. ... the same sample that is loaded to 0.1% testing deformation to capture the strain correlation patterns is also loaded to 1% testing deformation... For each dataset, we collect the average reload response (1 % strain) per width."
The plotted 'predicted' reload curves are not out-of-sample forecasts: the 1% reload stress-strain responses, which are the quantities to be predicted, are explicitly taken as known inputs, and the average response is computed from those known 1% responses grouped by deformation class. The test-set classification by supervised ML is real, but it is not what generates the curves in Figs. 1.13 and 1.14; those curves are per-class averages of already-computed reload data. No held-out comparison between predicted and actual reload curves or prediction-error metric is reported. Thus the central predictive claim reduces, by construction, to averaging known target data.
-
fitted input called prediction
[Sec. 1.6, Fig. 1.14 caption; Sec. 1.7 summary claim]
"In Fig. 1.14, the sample yield stress is plotted against the thin film width for different dislocation density levels (acquired through prior deformation), which demonstrate an evolving size effect σ ≈ w^{-a}... It is worth noting that the discussed model in this work is the first discrete dislocation model demonstration of this well suggested transition (since Taylor) as a function of pre-existing dislocation density."
The size-effect exponent in Fig. 1.14 is extracted from the 'maximum predicted stress' of the reload curves constructed in the circular Sec. 1.6 procedure. The text calls the same plotted quantity both 'maximum predicted stress' (figure caption) and 'sample yield stress' (text), and it is obtained by averaging known 1% reload outcomes per prior-deformation class. Therefore the dislocation-density-dependent exponent a and the claimed first DDD demonstration of a Taylor-hardening transition are not independent predictions of the model; they are restatements of the in-sample average reload responses.
full rationale
Most of this chapter is a review of previously published, externally benchmarked 2D-DDD simulations, and normal self-citation to Papanikolaou, Song and Van der Giessen (2017), Song, Dimiduk and Papanikolaou (2019), and Papanikolaou et al. (2019) is not itself circular: it points to independent prior work containing the model, benchmark, and dataset. The genuine circularity is localized to Sec. 1.6 and its downstream Fig. 1.14. There, the chapter claims statistical prediction of future mechanical responses for test samples, but the construction assumes the 1% testing-deformation responses are known because each sample used for 0.1% strain correlations is also loaded to 1%. 'Prediction' is therefore equivalent to collecting the known reload curves and averaging them per prior-deformation class. Fig. 1.14's density-dependent size effect and the first-in-DDD Taylor-transition claim inherit this problem, because they are based on the 'maximum predicted stress' from those in-sample averages. The underlying 2D-DDD model, rate/size results in Secs. 1.3-1.4, and unsupervised classification in Sec. 1.5 retain independent content; the paper's own limitations (no 2.5D DDD comparison, no 3D mechanisms) are scope caveats, not circularity. Score reflects that the strongest new predictive claim reduces by construction, while a substantial portion of the chapter is independent.
Assumptions & free parameters
free parameters (7)
- Bulk source density rho_nuc =
60 um^-2
- Mean source strength tau_nuc =
50 MPa, 10% std
- Nucleation time t_nuc =
10 ns
- Obstacle density rho_obs =
480 um^-2 (text)
- Obstacle strength tau_obs =
300 MPa, 20% std (text); 150 MPa in Table 1.1
- Dislocation mobility B =
1e-4 Pa.s
- Annihilation distance =
6b
assumptions (5)
- domain assumption Two-dimensional plane-strain edge dislocation model represents 3D microcrystal plasticity statistics
- domain assumption Randomly distributed sources and obstacles with Gaussian strength distributions capture real dislocation source and forest statistics
- domain assumption Strain correlation features (PyMKS two-point statistics) contain sufficient information to infer prior deformation history
- standard math Finite element image-field solution is accurate for the plane-strain boundary value problem
- domain assumption Power-law fits of avalanche size distributions are valid within finite strain windows and limited realizations
Cite this review
Pith. "Pith review of Effects of Rate, Size and Prior Deformation in Microcrystal Plasticity." pith.science (2026). https://pith.science/paper/XJTTPUR4
@misc{pith2026190803175,
  author       = {Pith},
  title        = {Pith review of: Effects of Rate, Size and Prior Deformation in Microcrystal Plasticity},
  year         = {2026},
  howpublished = {\url{https://pith.science/paper/XJTTPUR4}},
  note         = {Machine review of arXiv:1908.03175}
}
read the original abstract
Crystal plasticity of sub-micron finite volumes is characterized by the flow of emergent dislocation defects, giving rise to size effects in mechanical properties and avalanche phenomena. In this chapter, we present a minimal model for discrete edge dislocations in a finite volume, that has been benchmarked against experimental data and displays known phenomenological trends. We discuss how this model can explain seemingly disconnected effects of rate, size and prior deformation on microcrystal plasticity. We demonstrate the statistical features of dislocation ensembles for both stress and displacement controlled loading conditions and explore in detail the connection between loading rate and displacement bursts. Finally, we present model studies of machine learning algorithms in microcrystal plasticity that both improve understanding and clarify the range of such methods' usefulness. In this way, we elucidate the role of prior deformation history on micro and nano-sized specimens and we use this understanding to predict the mechanical response of thin films through microstructural observations of pre-existing dislocation configurations.
Figures


Figures from the paper (14 more)




Reference graph
Works this paper leans on
-
[1]
Micro-plasticity and recent insights from intermittent and small-scale plasticity
the same sample that is loaded to 0.1% testing deformation to capture the strain correlation patterns is also loaded to 1% testing deformation see (Papanikolaou et al. 2019) Effects of Rate, Size and Prior Deformation in Microcrystal Plasticity 21 Figure 1.14: Size effects in thin films: The maximum predicted stress (see Fig. 1.13) is plotted against sampl...
work page Pith review arXiv 2015
-
[2015]
and infer deformation history (Papanikolaou et al . 2019). The usage of ML in mechanical deformation studies started from analyzing nanoindentation responses towards the prediction of material properties (Khosravani et al. 2017, Iskakov et al. 2018, Meng et al. 2015, 2017, Huhn et al. 2017). In a new direction on this topic, a recent work (Papanikolaou et...
work page 2019
-
[2017]
The onset of power-law behavior at decreasingw is seen in Fig
is shown through power law tails of the event probability distributionsP(S) ∼ S−τ P(S/slash.leftS0). The onset of power-law behavior at decreasingw is seen in Fig. 1.8 (a) with an exponentτ = 1.2± 0.2 whileS0 ∼w−1. The existence of power-law behavior in the asymptotically small width limit becomes apparent in samples with low aspect ratio, as shown in the...
work page 2017
Reviewed August 14, 2026 · model on record in the stance chip above.
Discussion (0). Continue with ORCID to comment.