REVIEW 4 major objections 5 minor 32 references
Transferring knowledge from monitored to unmonitored areas for forecasting parking spaces
T0 review · 4 major / 5 minor · reviewed 2026-08-14 · deepseek-v4-flash
Pith's one-line read Parking occupancy in unmonitored city areas can be estimated by transferring a prediction model from a monitored area, with the estimate widened into an interval whose size reflects how similar the two areas' amenity profiles are.
desk verdict Sensible idea, clearly presented, but the central claim about unmonitored areas is only validated through a monitored-cluster correlation proxy, so treat the headline result as promising rather than established. read the letter →
The pith
A machine-rendered reading of the paper's core claim, the machinery that carries it, and where it could break.
The reading
What carries the argument
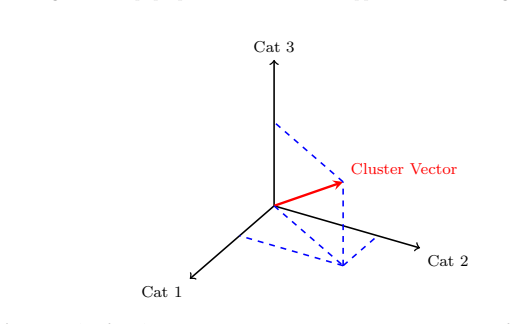
The load-bearing objects are cluster vectors and cluster Gaussians built from OpenStreetMap amenities and visit-duration information. A cluster vector counts how many amenities of each visit-duration category (under 30 minutes, 30 to 90 minutes, over 90 minutes) a spatial cluster contains; a cluster Gaussian is the summed kernel-density curve of all amenities' visit-duration distributions. Cosine similarity is computed on the vectors, and earth mover's distance (the Wasserstein metric) on the Gaussians, with values normalized to $[0,1]$. These similarities enter the transfer estimator: for cosine, the occupancy interval around the model output $M$ is $[M-(1-\mathrm{sim}), M+(1-\mathrm{sim})]$, and for earth mover's it is $[M-\mathrm{emd}, M+\mathrm{emd}]$. The interval widens exactly as the source and target areas become less similar, which is the mechanism by which a model trained on monitored data is adapted to unmonitored data.
What would settle it
In a city with full sensor coverage, designate a random subset of blocks as unmonitored, compute the interval estimates from the remaining blocks, and compare the intervals against the held-out occupancy readings; if the intervals are systematically wrong or the similarity-to-error correlation collapses on the held-out clusters, the transfer claim is refuted.
Extended reading notes
Core claim
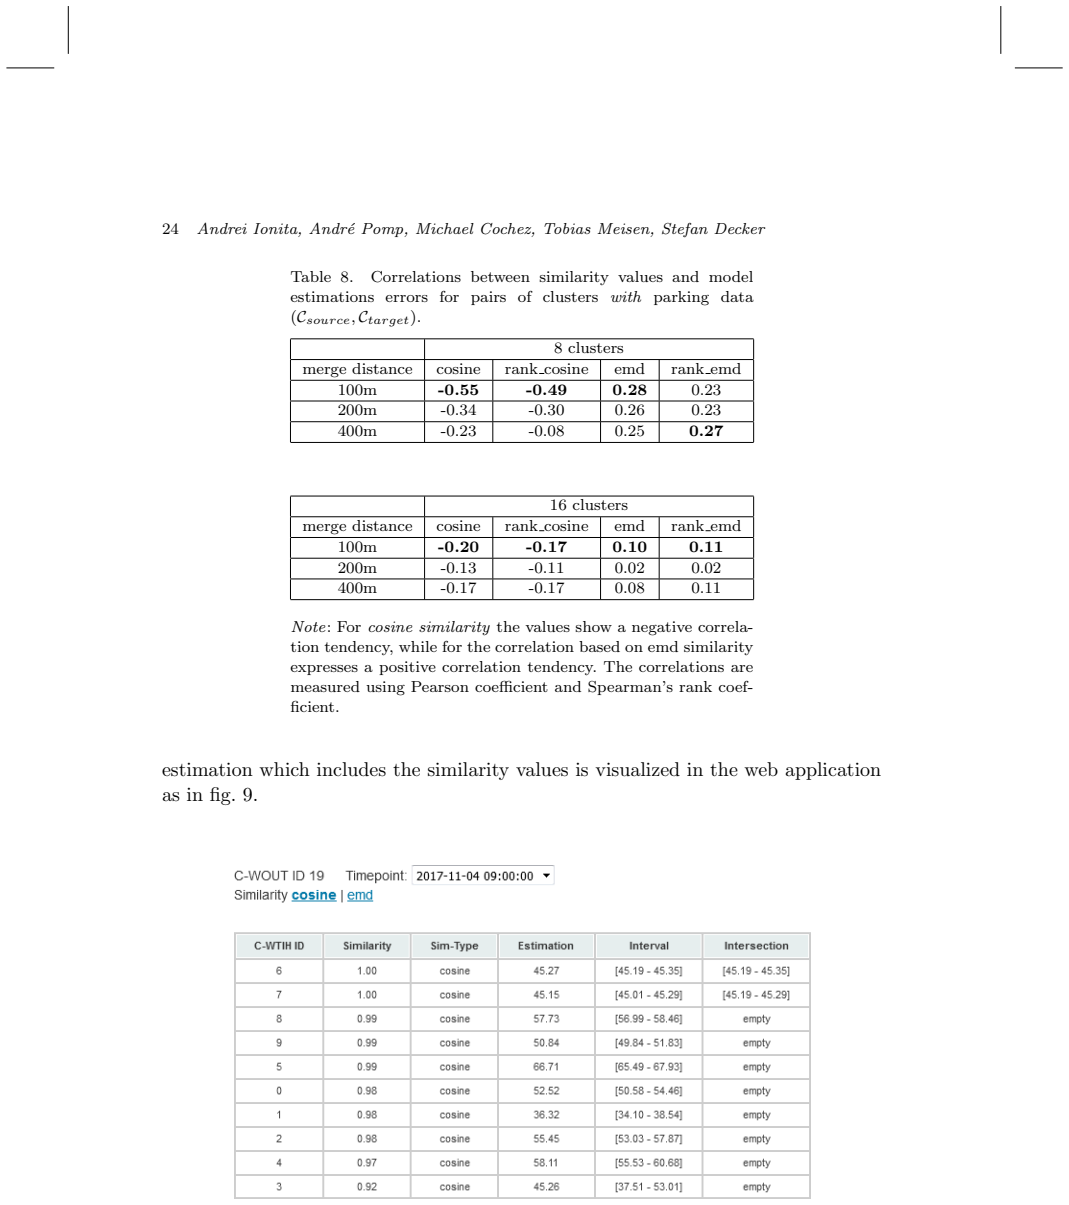
The paper's central claim is that parking occupancy in an unmonitored area can be estimated by transferring a model trained on a monitored area, stretching the punctual prediction into an interval whose length is governed by the similarity of the two areas' amenity profiles. Neighborhoods with similar amenity mixes and similar typical visit durations should have similar parking dynamics, so a similar source area needs only a small widening while a dissimilar source produces a wide interval. The supporting evidence is correlational: for each pair of monitored clusters, the source model is tested on the target cluster, and the test error is correlated with cosine or earth-mover similarity between the clusters. The strongest reported result, cosine similarity with eight clusters and a 100-meter merge distance, yields an average Pearson correlation of -0.55 between similarity and transfer error, meaning more similar clusters tend to have smaller transfer errors. The paper also reports that gradient-boosted trees beat decision trees, support vector machines, and multilayer perceptrons in most cluster pairs, and that adding similarity-derived features directly to the regression model does not consistently improve predictions.
Load-bearing premise
Everything rests on the assumption that similarity between two monitored clusters predicts transfer error just as well when the target cluster is unmonitored, because occupancy in unmonitored areas is never measured.
Editorial extensions
If this is right
- A city with sensors on only a subset of its blocks can generate occupancy intervals for the rest of the city from OpenStreetMap and visit-duration data alone, with no new hardware.
- The interval width itself acts as the uncertainty estimate: the less similar the source and target areas, the wider the predicted occupancy range.
- Using 16 clusters instead of 8, or merge distances of 200m or 400m instead of 100m, weakens the similarity-to-error correlation, so finer spatial splits do not automatically help.
- Adding cosine and earth-mover features directly to the regression model does not consistently beat the separate similarity-widening step, so the two-stage transfer is not trivially replaceable.
- Because the best correlation is moderate (-0.55), the resulting intervals should be treated as rough guidance rather than precise occupancy values.
Reading between the lines
- If the similarity-to-error relationship holds on truly unmonitored clusters, the interval width becomes a calibrated uncertainty estimate that a city could present to drivers as '60-80% occupied' with comparable reliability across areas.
- The same amenity-profile similarity could be tested for other urban transfer tasks, such as estimating foot traffic, noise complaints, or ride-hailing demand in unmonitored areas, since those are also shaped by the local mix of amenities.
- The paper's intersection intervals quickly become empty after intersecting a few source clusters, which suggests a practical system should select one or a small number of the most similar source clusters rather than combine all of them.
- A direct validation in a fully sensed city that artificially hides a subset of clusters would settle whether the monitored-only correlations transfer to unmonitored areas; the authors did not run this experiment.
Signed reviews
Editorial analysis
A structured set of objections, weighed in public.
Referee Report
Summary. The paper proposes a method to estimate parking occupancy in city areas without sensor coverage by transferring occupancy models from monitored areas. It uses SFpark data, OpenStreetMap amenities, and Google Places visit durations. City blocks are split into clusters via K-means; per-cluster machine learning models (decision trees, SVM, MLP, XGBoost) are trained; cluster similarity is computed via cosine similarity on time-spent category vectors and via earth mover's distance on Gaussian mixtures; predictions for unmonitored clusters are intervals centered at the source model output with width derived from similarity (Eqs. 4 and 5). The evaluation in Section 6.2 correlates similarity values with transfer errors among monitored cluster pairs; the best reported result is Pearson -0.55 for cosine similarity at 8 clusters and 100m merge distance. Section 6.3 illustrates intervals for unmonitored clusters but provides no ground-truth comparison.
Significance. If the transfer mechanism worked as claimed, the method would offer a low-cost way to extend partial parking sensor coverage using open GIS data, and it usefully combines several practical components: open data, spatial clustering, multiple machine learning baselines, and two similarity functions. The paper is also transparent about data limitations and explores alternative similarity bases and model extensions. However, the central claim is not directly supported by the evaluation, which never tests predictions against actual occupancy in unmonitored areas. The contribution is therefore best viewed as a promising framework with an indirect proxy validation, not as a demonstrated solution.
major comments (4)
- [Section 6.2, Table 8; Section 6.3, Fig. 9] The central claim that occupancy can be forecast in unmonitored areas is not directly validated. All correlations between similarity and transfer error are computed on pairs of clusters that both have parking data. The actual target of the method, clusters without parking data, appears only in illustrative outputs (Section 6.3), with no occupancy ground truth. The assumption that the monitored-pair similarity-error relationship generalizes to unmonitored targets is load-bearing and untested. Please add a direct hold-out experiment in which each monitored cluster is treated as unmonitored and the interval predictions from Eqs. (4)-(5) are checked against actual occupancy, reporting coverage and interval width for all configurations rather than only the best one.
- [Section 5.8, Eqs. (4)-(5)] The interval widths are not calibrated. Eq. (4) sets the width to (1-sim) and Eq. (5) to the EMD value, but no derivation or calibration ties these widths to a target coverage probability. A Pearson correlation of -0.55 between similarity and transfer RMSE does not imply that an interval of width (1-sim) contains the true occupancy with any stated frequency. In addition, Eq. (5) asserts emd in [0,1] without justification; the Wasserstein distance is computed on a minute-valued x-axis and can exceed 1 after normalization. The authors should calibrate interval widths on held-out monitored clusters or report empirical coverage and calibration.
- [Section 6.2, Table 8] The reported best result is selected post hoc among 12 configurations (two cluster counts, three merge distances, two similarity measures). The cosine correlation drops from -0.55 at 8 clusters and 100m merge distance to -0.20 at 16 clusters and 100m, and the best EMD correlation is only 0.28. Without a predefined selection rule or an independent validation split, the headline value is likely an overestimate of the true similarity-error relationship. Please report all configurations with confidence intervals, and either treat the configuration choice as exploratory or validate it on a separate split.
- [Section 6.3, Table 9] The input features used to generate forecasts for unmonitored clusters are city-wide averages (price 1.0, total spots 20) and an arbitrary future date; they are not derived from the target cluster's own characteristics. If monitored and unmonitored areas differ systematically in parking price or capacity, the point prediction is biased before the similarity interval is applied. The authors should state what target-specific information is assumed to be available and perform a sensitivity analysis over plausible price and capacity values.
minor comments (5)
- [Eq. (2)] The sentence 'where Ai and Bi are the components of vector A and respectively' is missing a reference to vector B; it should read 'of vector A and vector B, respectively.'
- [Throughout] There are several typographical errors, for example 'senors' in Section 2.1, 'in practive' in Section 5.7, 'reges-sion' in Table 6, and 'crowsourcing' in Section 5.3; these should be corrected.
- [Section 6.5, Table 12] The area values in Table 12 are reduced by a factor of 20 to make the EMD computation feasible, but the paper does not discuss how this scaling affects the resulting similarity values or whether the same scaling is applied consistently in the cosine vectors.
- [Section 5.6, Table 3] The category boundaries are stated as '< 30 min, 30 to 90 minutes, > 90 minutes' in the text, while Table 3 uses numeric labels 1, 2, 3; aligning these notations would improve readability.
- [Section 6.3, Fig. 9] The caption of Fig. 9 states that the estimation intersection interval becomes empty after the first two values; the paper does not explain how an empty intersection is handled in practice, so this behavior should be clarified.
Circularity Check
No significant circularity: the similarity values are externally measured from OSM and Google Places data, and the interval formulas are not fitted to the occupancy data.
full rationale
The paper's input features (OSM amenity types and Google Places visit durations) are independent of the parking occupancy target, and the similarity values are computed directly from these external data rather than from model errors. The central evaluation correlates these externally computed similarity values against transfer RMSE on monitored cluster pairs; this is an empirical test of a hypothesized relationship, not a quantity defined in terms of the prediction. The interval formulas in Eqs. (4) and (5) set the interval width to (1 - similarity) or emd by construction, but this width is an ad hoc design choice, not a fitted parameter and not derived from the data used in the correlation. The paper does not fit its similarity measure to the machine-learning errors and then report those errors as predictions; instead, it reports correlations that are moderate and then applies the same externally defined similarity to unmonitored clusters. The cited prior works by the same authors are described as the basis of the extended approach, but the paper does not rely on any unverified theorem from those works as evidence; the evaluation presented here is self-contained against SFpark data. The absence of direct validation on unmonitored areas is a genuine correctness and generalization risk, but it is not circularity: no equation or fitted parameter reduces the unmonitored-area prediction to the very data it is supposed to predict.
Assumptions & free parameters
free parameters (4)
- K: number of clusters (monitored) =
8 and 16
- Merge distance for POI-parking association =
100m (200m and 400m also tested)
- Time-spent category thresholds =
30 and 90 minutes
- Amenity area scaling factor =
1/20
assumptions (4)
- domain assumption Parking occupancy is determined by the types of amenities and the time people spend in them.
- domain assumption Similarity of amenity profiles between areas implies transferability of parking occupancy models.
- domain assumption The correlation between similarity and transfer error on monitored clusters generalizes to unmonitored clusters.
- domain assumption OSM amenity annotations and Google Places time-spent values are sufficiently accurate and representative.
Cite this review
Pith. "Pith review of Transferring knowledge from monitored to unmonitored areas for forecasting parking spaces." pith.science (2026). https://pith.science/paper/NXEKP7T4
@misc{pith2026190803629,
  author       = {Pith},
  title        = {Pith review of: Transferring knowledge from monitored to unmonitored areas for forecasting parking spaces},
  year         = {2026},
  howpublished = {\url{https://pith.science/paper/NXEKP7T4}},
  note         = {Machine review of arXiv:1908.03629}
}
read the original abstract
Smart cities around the world have begun monitoring parking areas in order to estimate available parking spots and help drivers looking for parking. The current results are promising, indeed. However, existing approaches are limited by the high cost of sensors that need to be installed throughout the city in order to achieve an accurate estimation. This work investigates the extension of estimating parking information from areas equipped with sensors to areas where they are missing. To this end, the similarity between city neighborhoods is determined based on background data, i.e., from geographic information systems. Using the derived similarity values, we analyze the adaptation of occupancy rates from monitored- to unmonitored parking areas.
Figures


Figures from the paper (7 more)




Reference graph
Works this paper leans on
-
[1]
M. N. Smith, The number of cars worldwide is set to double by 2040 (2016), https://www.weforum.org/agenda/2016/04/the- number-of-cars-worldwide-is-set-to-double-by-2040
work page 2016
-
[2]
D. Shoup, Free parking or free markets (2001), https://www.accessmagazine.org/ spring-2011/free-parking-free-markets/
work page 2001
- [3]
-
[4]
INRIX, Searching for parking costs americans 73 billion us dollars a year (2017), http://inrix.com/press-releases/parking-pain-us/
work page 2017
-
[5]
A. Ionita, A. Pomp, M. Cochez, T. Meisen and S. Decker, Where to park?: Predicting free parking spots in unmonitored city areas, in Proceedings of the 8th International Conference on Web Intelligence, Mining and Semantics WIMS ’18 , (ACM, New York, NY, USA, 2018), pp. 22:1–22:12
work page 2018
-
[6]
A. Ionita, Extending estimation of parking occupancy to untracked city areas using city background information, master’s thesis (December 2017)
work page 2017
-
[7]
T. Lin, H. Rivano and F. Le Mou¨ el, A survey of smart parking solutions,IEEE Trans- actions on Intelligent Transportation Systems 18 (Dec 2017) 3229–3253
work page 2017
-
[8]
T. S. Lin, Smart Parking: Network, Infrastructure and Urban Service , theses, INSA Lyon, (INSA Lyon, December 2015)
work page 2015
Show all 32 references
-
[9]
B. Xu, O. Wolfson, J. Yang, L. Stenneth, S. Y. Philip and P. C. Nelson, Real-time street parking availability estimation, in 2013 IEEE 14th International Conference on Mobile Data Management 1, IEEE, (IEEE, June 2013), pp. 16–25
2013
-
[10]
Z. Chen, J. C. Xia and B. Irawan, Development of fuzzy logic forecast models for location-based parking finding services, Mathematical Problems in Engineering 2013 (2013)
2013
-
[11]
Nandugudi, T
A. Nandugudi, T. Ki, C. Nuessle and G. Challen, PocketParker: Pocketsourcing park- ing lot availability, in Proceedings of the 2014 ACM International Joint Conference on Pervasive and Ubiquitous Computing UbiComp ’14 , (ACM, New York, NY, USA, 2014), pp. 963–973
2014
-
[12]
Koster, A
A. Koster, A. Oliveira, O. Volpato, V. Delvequio and F. Koch, Recognition and rec- ommendation of parking places, in Advances in Artificial Intelligence – IBERAMIA 2014, eds. A. L. Bazzan and K. Pichara Springer, (Springer International Publishing, Cham, 2014), pp. 675–685
2014
-
[13]
Rajabioun, B
T. Rajabioun, B. Foster and P. Ioannou, Intelligent parking assist, in 21st Mediter- ranean Conference on Control and Automation IEEE, (IEEE, June 2013), pp. 1156– 1161
2013
-
[14]
Rajabioun and P
T. Rajabioun and P. A. Ioannou, On-street and off-street parking availability pre- diction using multivariate spatiotemporal models, IEEE Transactions on Intelligent Transportation Systems 16(5) (2015) 2913–2924
2015
-
[15]
Tiedemann, T
T. Tiedemann, T. Voegele, M. Krell, J. Metzen and F. Kirchner, Concept of a data Transferring knowledge from monitored to unmonitored areas for forecasting parking spaces 33 thread based parking space occupancy prediction in a Berlin pilot region 29, (AAAI, 2015)
2015
-
[16]
Richter, S
F. Richter, S. Di Martino and D. C. Mattfeld, Temporal and spatial clustering for a parking prediction service, in 2014 IEEE 26th International Conference on Tools with Artificial Intelligence (IEEE, Nov 2014), pp. 278–282
2014
-
[17]
San Francisco Municipal Transportation Agency, SFpark - open data (2011–2013), http://sfpark.org/how-it-works/open-data-page/
2011
-
[18]
A. O. Kotb, Y.-C. Shen, X. Zhu and Y. Huang, iParker – a new smart car-parking system based on dynamic resource allocation and pricing, IEEE Transactions on In- telligent Transportation Systems 17(9) (2016) 2637–2647
2016
-
[19]
Shin and H.-B
J.-H. Shin and H.-B. Jun, A study on smart parking guidance algorithm, Transporta- tion Research Part C: Emerging Technologies 44 (2014) 299–317
2014
-
[20]
Mathur, T
S. Mathur, T. Jin, N. Kasturirangan, J. Chandrasekaran, W. Xue, M. Gruteser and W. Trappe, ParkNet: Drive-by sensing of road-side parking statistics, in Proceedings of the 8th International Conference on Mobile Systems, Applications, and Services MobiSys ’10, (ACM, New York, N...
2010
-
[21]
Caliskan, A
M. Caliskan, A. Barthels, B. Scheuermann and M. Mauve, Predicting parking lot occupancy in vehicular Ad Hoc networks, in 2007 IEEE 65th Vehicular Technology Conference - VTC2007-Spring IEEE, (IEEE, April 2007), pp. 277–281
2007
-
[22]
Klappenecker, H
A. Klappenecker, H. Lee and J. L. Welch, Finding available parking spaces made easy, Ad Hoc Networks 12 (2014) 243–249
2014
-
[23]
Szczurek, B
P. Szczurek, B. Xu, O. Wolfson, J. Lin and N. Rishe, Learning the relevance of parking information in vanets, in Proceedings of the Seventh ACM International Workshop on VehiculAr InterNETworking VANET ’10 , (ACM, New York, NY, USA, 2010), pp. 81–82
2010
-
[24]
San Francisco Municipal Transportation Agency, SFpark (2011–2013), http:// sfpark.org
2011
-
[25]
San Francisco Municipal Transportation Agency, SFpark – pilot project evaluation summary (2011–2013), http://sfpark.org/wp-content/uploads/2014/06/SFpark_ Eval_Summary_2014.pdf
2011
-
[26]
Ionita, Parking prediction web application (2017), https://datalab.rwth- aachen.de/parking-prediction/
A. Ionita, Parking prediction web application (2017), https://datalab.rwth- aachen.de/parking-prediction/
2017
-
[27]
Google, Google my business (2017), https://www.google.com/business/
2017
-
[28]
Community, OpenStreetMap (2004), https://www.openstreetmap.org/
O. Community, OpenStreetMap (2004), https://www.openstreetmap.org/
2004
-
[29]
Stadt K¨ oln and DKAN, ¨Offene Daten K¨ oln (2015), https://www.offenedaten- koeln.de/dataset/taxonomy/term/52/field_tags/Transport%20und%20Verkehr- 52?query=park&sorting=changed%7CDESC
2015
-
[30]
Stadt Z¨ urich, Stadt Z¨ urich - open data (2015), https://data.stadt-zuerich.ch/ dataset/parkleitsystem
2015
-
[31]
City of Santa Monica, Santa Monica – open data (2014), https://data.smgov.net/ Transportation/Parking-Lot-Counts/ng8m-khuz
2014
-
[32]
DB BahnPark GmbH, DB - Parkpl¨ atze API (2016),http://data.deutschebahn.com/ dataset/api-parkplatz
2016
Reviewed August 14, 2026 · model on record in the stance chip above.
Discussion (0). Continue with ORCID to comment.