REVIEW 2 major objections 6 minor 46 references
Why Does a Visual Question Have Different Answers?
T0 review · 2 major / 6 minor · reviewed 2026-08-14 · deepseek-v4-flash
Pith's one-line read The paper claims that the reasons people give different answers to the same visual question can be captured by a nine-category taxonomy and predicted ahead of time from the image and the question.
desk verdict A first useful taxonomy and dataset for why VQA answers differ; the model evaluation is honest but needs more statistical rigor. read the letter →
The pith
A machine-rendered reading of the paper's core claim, the machinery that carries it, and where it could break.
The reading
What carries the argument
The load-bearing machinery is the taxonomy plus a two-module model. The taxonomy is a fixed set of ten labels (nine reasons plus “other”) into which every disagreement is classified. The model's “Answer Prediction” module is a pretrained VQA network that produces a soft probability distribution over candidate answers; this distribution is concatenated with image features from a Faster R-CNN and question features from a GRU, and an “Answer Difference” module maps them through a fully connected layer to per-label sigmoid probabilities. The predicted-answer signal does the crucial work of letting the model exploit answer-level causes (synonyms, granularity, spam) without knowing the true answers at test time.
What would settle it
Re-label a random sample of the same 44,955 questions with a fresh crowd using the identical interface; if the new workers' labels agree with the published majority labels no better than chance, or if raising the agreement threshold to four or five workers erases most positives, the taxonomy and its labels are too noisy to support the claimed predictions.
Extended reading notes
Core claim
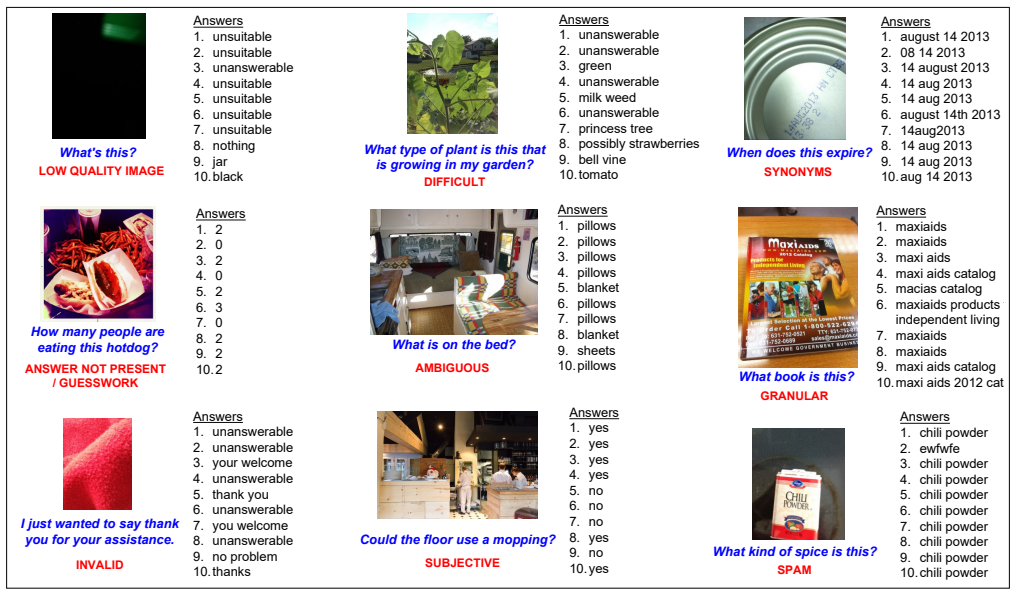
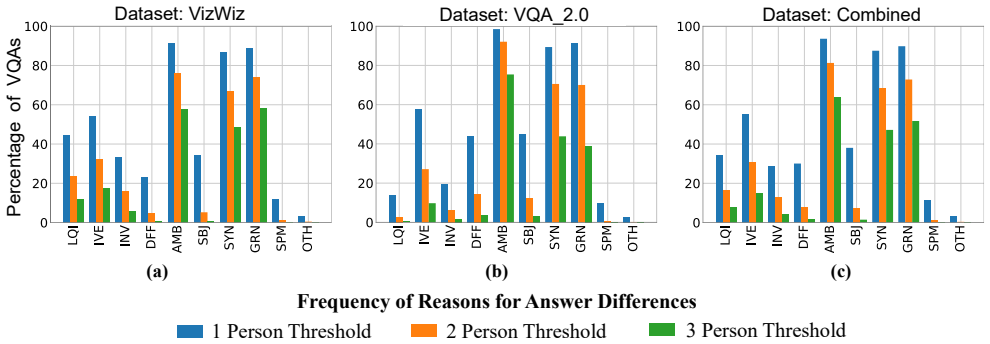
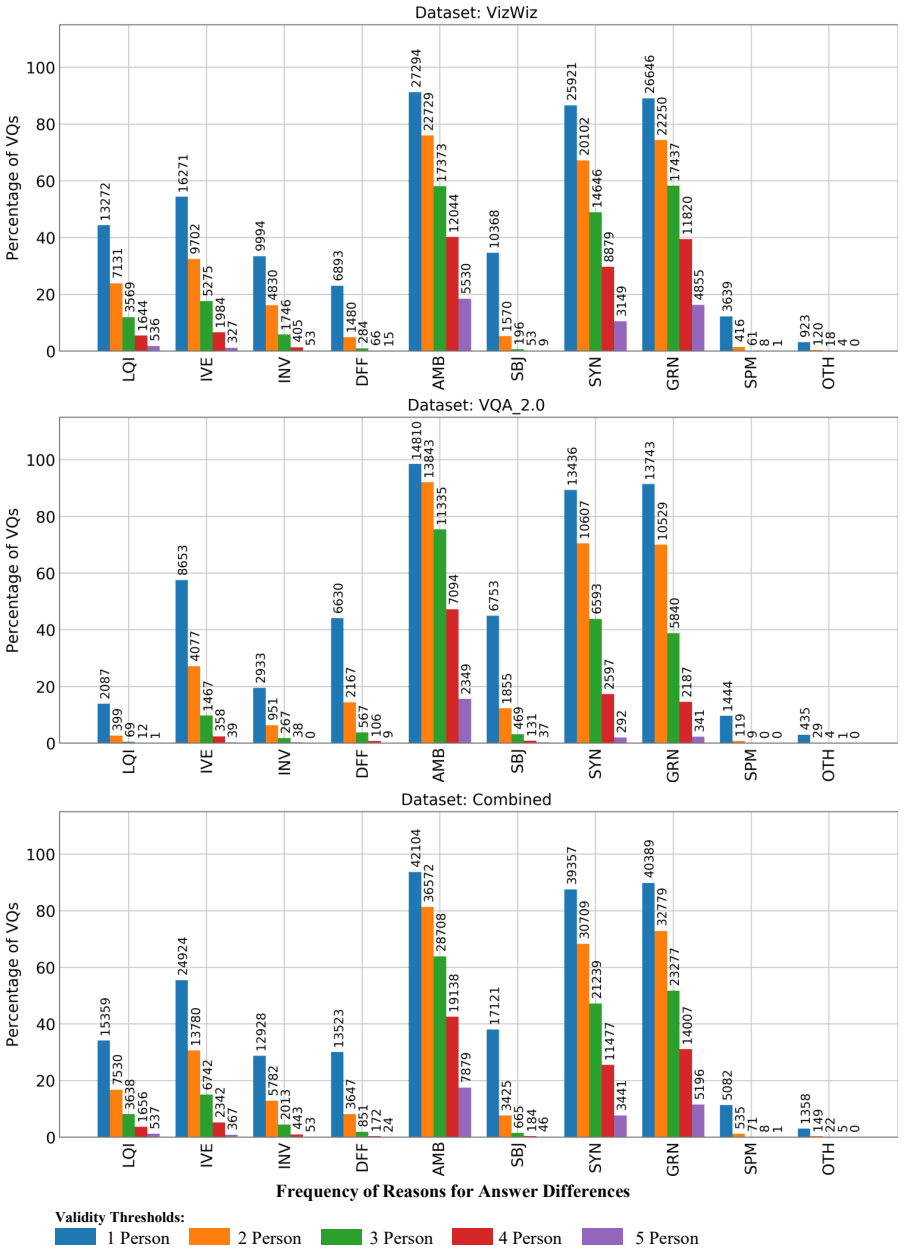
The authors propose that every observed disagreement over a visual question can be assigned to one or more of nine reasons: low-quality image, answer not present, invalid question, difficult question, ambiguous question, subjective question, synonymous answers, granularity differences, and spam. They label 44,955 questions from two existing VQA datasets with these reasons and show that most questions receive several reasons, with ambiguity, synonyms, and granularity the most common. They then pose the new task of predicting the reasons from the visual question alone, and introduce a model that adds a pretrained answer-prediction module so that predicted answers, not just image and question, serve as cues. On both datasets the model improves mean average precision over random, relevance, and answerability baselines, with predicted answers contributing a consistent gain over image-plus-question alone.
Load-bearing premise
The load-bearing premise is that the nine-reason taxonomy is complete enough and crowd workers apply the labels consistently enough that the ground-truth labels reflect real causes rather than arbitrary annotator choices.
Editorial extensions
If this is right
- VQA services can decide before answering whether a user should rephrase the question, retake the image, or expect conflicting answers.
- The dominant role of ambiguity, synonyms, and granularity means most disagreements could be headed off by disambiguating questions and aligning answer detail level.
- Directly predicting the reason labels outperforms adapting existing relevance or answerability models, so the new task needs its own modeling.
- Feeding a VQA model's predicted answer distribution into the predictor improves accuracy beyond image-plus-question, especially for low-quality images and missing evidence.
Reading between the lines
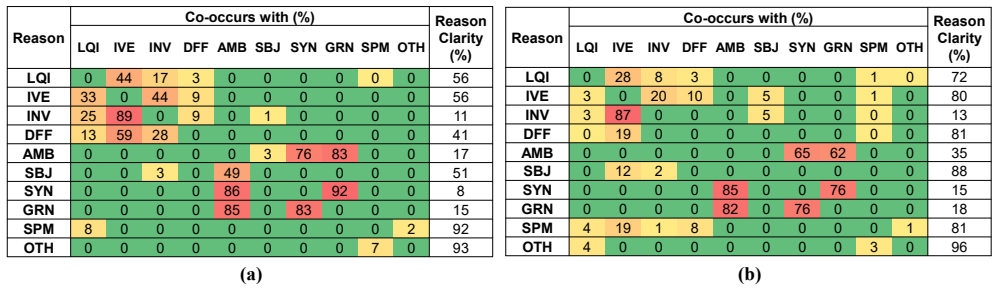
- A likely refinement the paper leaves implicit: because ambiguity, synonyms, and granularity co-occur so strongly, a structured model that treats them as a shared “imprecision” factor would probably be more robust than ten independent binary labels.
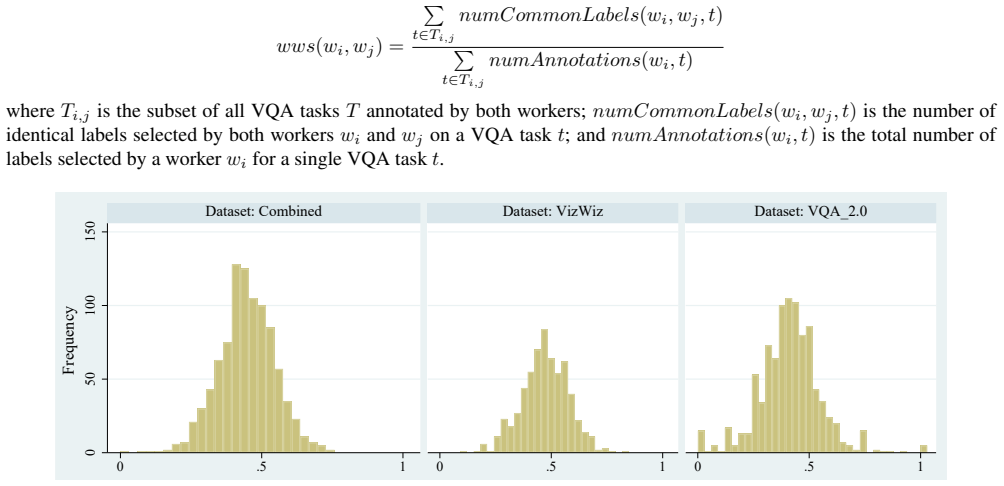
- The reported worker-agreement distributions peaking near 0.5 suggest the ground-truth labels contain substantial noise; an evaluation using only 4- or 5-worker consensus labels would show how much of the predictive gain survives stricter supervision.
- The same taxonomy and prediction strategy could transfer to other tasks where annotators disagree, such as image captioning and visual dialog, turning disagreement from a nuisance into a prediction target.
- A natural follow-up is to use the predicted reasons to weight or reconcile answers during aggregation, not just to warn users.
Signed reviews
Editorial analysis
A structured set of objections, weighed in public.
Referee Report
Summary. The paper introduces the task of explaining why different people provide different answers to the same visual question. It proposes a nine-category taxonomy (plus an 'Other' category), releases two annotated datasets of about 45,000 visual questions with five crowd-sourced reason labels each, and trains a multi-label classifier that predicts the reasons from the image, question, and predicted answers. The main empirical claims are that answer differences most often arise from ambiguity, synonyms, and granularity, and that the proposed Q+I+A model outperforms three related baselines on VizWiz and VQA 2.0.
Significance. If the annotation ground truth is trustworthy, the paper makes a useful contribution: it is the first large-scale attempt to characterize and predict the causes of answer disagreement in VQA, it ships public datasets and code, and its model design avoids label leakage by pretraining the answer-prediction module on a different dataset. The descriptive findings (AMB/SYN/GRN prevalence and co-occurrence structure) could inform answer aggregation and question-rewriting systems. The evaluation, however, rests on subjective labels whose reliability is not demonstrated, and the reported baselines are too weak to establish the model's advantage.
major comments (2)
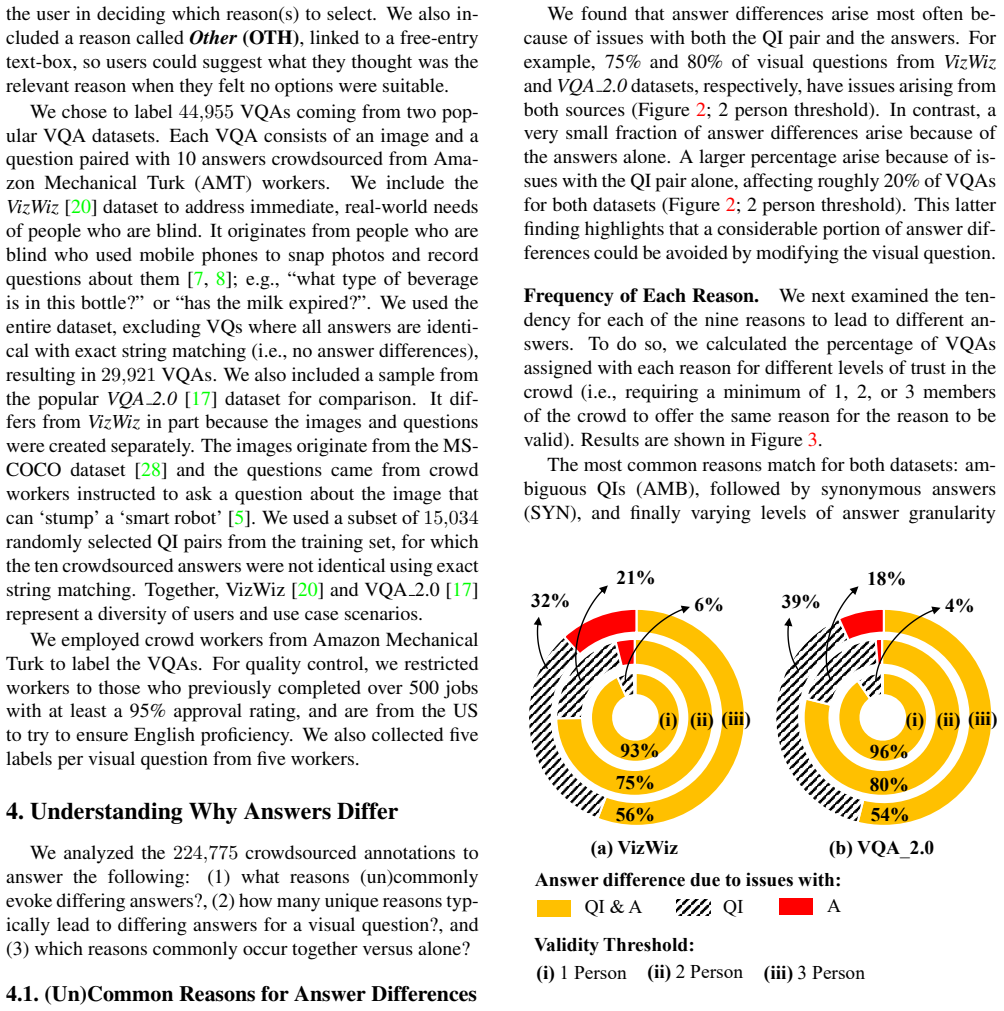
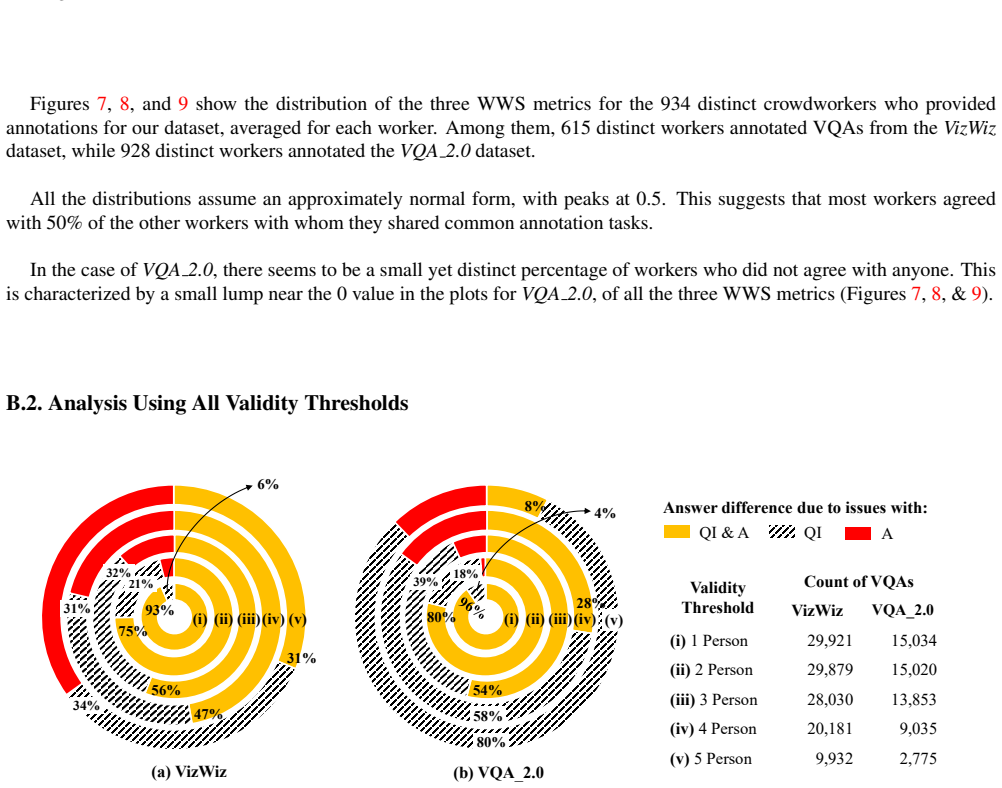
- [Appendix B.1 and Section 3] The ground-truth labels are the load-bearing component of both the descriptive analysis and the model evaluation, but the reported inter-annotator agreement does not establish reliability. The WWS distributions in Figures 7-9 peak at 0.5 on all three metrics, and the paper reports no chance-corrected per-label agreement (e.g., Cohen's kappa per reason or Krippendorff's alpha). Since Section 5.1 binarizes each label with a 2-of-5 threshold, a typical worker agreeing with only half of co-workers means many labels are determined by near-tie votes. The threshold sensitivity is visible in Appendix Figure 10: the proportion of VizWiz VQAs attributed to 'QI & A' drops from 93% (1-person) to 31% (5-person), and the analogous proportion for VQA 2.0 drops from 80% to 8%. The paper should report per-reason chance-corrected agreement, the distribution of vote counts, and a sensitivity analysis showing whether the conclusions in Section 4 and the relative gains in Section 5.2 survive alternative validity thresholds (e.g., 3-of-5).
- [Section 5.2, Table 2] The claim that the proposed model outperforms baselines is not yet fully supported because the baselines are weak and no uncertainty is reported. QI-Relevance and Unanswerable predict only three of the ten labels (LQI, IVE, AMB) and set the remaining seven labels randomly, so the comparison measures little more than whether the model can predict those three labels plus chance. In addition, the table reports a single average-precision number per label with no error bars, significance tests, or multiple seeds, although some differences between model variants are below one point (e.g., VizWiz overall 50.02 vs. 50.01 for Q+I+A vs. Q+I+A FT). The authors should add (i) stronger baselines trained on the same task with the same input modalities (e.g., a multi-label classifier on Q+I, or predicted answers without the answer-difference head), (ii) repeated-run means with standard deviations, and (iii) a statement of how many random-restart seeds were used.
minor comments (6)
- [Section 4.1] The sentence about difficult questions reverses the dataset order: it says the percentage is four times higher in VQA 2.0 than VizWiz, then gives '~3% versus ~12%', which should be 'VizWiz ~3% versus VQA 2.0 ~12%'.
- [Table 3] The abbreviation for the 'Difficult' reason is 'DFF' in Table 2 but 'DEF' in Table 3; please use a consistent abbreviation.
- [Figures 3 and 11] The histograms have axis labels and percentage values that are too small to read; consider adding a numeric table or using larger fonts and clearer legends.
- [References] References [39] and [40] are duplicate entries for the same Teney et al. CVPR 2018 paper; one should be removed and the citations merged.
- [Section 5.2] The 'Random' baseline should specify whether it samples uniformly from the ten labels or uses the training-label prior; the very high AP for AMB (95.19 on VQA 2.0) suggests the latter, and this should be stated explicitly.
- [Section 3, Table 1] The 'Other (OTH)' category is described in the labeling interface and is predicted as a tenth label in Section 5, but it is missing from Table 1; include it in the taxonomy table for consistency.
Circularity Check
No significant circularity: the paper's predictions are trained on independently collected crowd labels, with the answer-cue module pretrained off-dataset.
full rationale
The paper's central claim is an empirical supervised-learning result, not a first-principles derivation. Ground-truth reason labels (Sec. 5.1) are obtained from five independent AMT workers per VQA using a 2-of-5 aggregation rule; these labels are external to the proposed model, so the model is not defined in terms of its target. The 'Answer Prediction' module is explicitly pretrained on a different VQA dataset to avoid test-time leakage (footnote 2), and the proposed Q+I+A model is evaluated on held-out splits against random and re-purposed baselines, so no fitted constant is later relabeled as a prediction. The Q+I+A GT ablation, which feeds ground-truth answers to the reason classifier, is a diagnostic variant, not the deployable predictor, and the paper's headline comparison is Q+I+A versus baselines. Self-citations to VizWiz [20] and CrowdVerge [18] point to public datasets and prior published results that are externally checkable and are not used to define the reason labels; they are therefore real evidence rather than circular support. Appendix B.1's inter-annotator agreement distributions peaking near 0.5 raise a legitimate reliability or validity concern about the ground-truth labels, but that is a measurement-quality issue, not a circularity of the derivation chain.
Assumptions & free parameters
free parameters (2)
- validity threshold =
2 of 5 crowd workers
- answer candidate frequency threshold =
>8 occurrences in training set
assumptions (3)
- domain assumption The nine-reason taxonomy is exhaustive and mutually understandable to crowd workers.
- domain assumption VQA models trained to optimize for multiple correct answers embed uncertainty that is predictive of why answers differ.
- domain assumption Visual questions can legitimately have multiple valid answers.
Cite this review
Pith. "Pith review of Why Does a Visual Question Have Different Answers?." pith.science (2026). https://pith.science/paper/GTFR226C
@misc{pith2026190804342,
  author       = {Pith},
  title        = {Pith review of: Why Does a Visual Question Have Different Answers?},
  year         = {2026},
  howpublished = {\url{https://pith.science/paper/GTFR226C}},
  note         = {Machine review of arXiv:1908.04342}
}
read the original abstract
Visual question answering is the task of returning the answer to a question about an image. A challenge is that different people often provide different answers to the same visual question. To our knowledge, this is the first work that aims to understand why. We propose a taxonomy of nine plausible reasons, and create two labelled datasets consisting of ~45,000 visual questions indicating which reasons led to answer differences. We then propose a novel problem of predicting directly from a visual question which reasons will cause answer differences as well as a novel algorithm for this purpose. Experiments demonstrate the advantage of our approach over several related baselines on two diverse datasets. We publicly share the datasets and code at https://vizwiz.org.
Figures
Figures from the paper (9 more)





Reference graph
Works this paper leans on
- [1]
-
[2]
Multiview triplet embed- ding: Learning attributes in multiple maps
Ehsan Amid and Antti Ukkonen. Multiview triplet embed- ding: Learning attributes in multiple maps. In International Conference on Machine Learning, pages 1472–1480, 2015. 1, 2
work page 2015
-
[3]
Agree- ment/disagreement based crowd labeling
Hossein Amirkhani and Mohammad Rahmati. Agree- ment/disagreement based crowd labeling. Applied intelli- gence, 41(1):212–222, 2014. 2
work page 2014
-
[4]
Bottom-up and top-down attention for image captioning and visual question answering
Peter Anderson, Xiaodong He, Chris Buehler, Damien Teney, Mark Johnson, Stephen Gould, and Lei Zhang. Bottom-up and top-down attention for image captioning and visual question answering. In CVPR, 2018. 7
work page 2018
-
[5]
VQA: Visual question answering
Stanislaw Antol, Aishwarya Agrawal, Jiasen Lu, Margaret Mitchell, Dhruv Batra, C Lawrence Zitnick, and Devi Parikh. VQA: Visual question answering. In Proceedings of the IEEE International Conference on Computer Vision , pages 2425–2433, 2015. 1, 2, 4, 5
work page 2015
-
[6]
Crowd Truth: Harnessing dis- agreement in crowdsourcing a relation extraction gold stan- dard
Lora Aroyo and Chris Welty. Crowd Truth: Harnessing dis- agreement in crowdsourcing a relation extraction gold stan- dard. WebSci2013. ACM, 2013, 2013. 2
work page 2013
-
[7]
VizWiz: Nearly real-time answers to visual questions
Jeffrey P Bigham, Chandrika Jayant, Hanjie Ji, Greg Lit- tle, Andrew Miller, Robert C Miller, Robin Miller, Aubrey Tatarowicz, Brandyn White, Samual White, and others. VizWiz: Nearly real-time answers to visual questions. In Proceedings of the 23nd Annual ACM Symposium on User Interface Software and Technology , pages 333–342. ACM,
-
[8]
Erin Brady, Meredith Ringel Morris, Yu Zhong, Samuel White, and Jeffrey P. Bigham. Visual challenges in the ev- eryday lives of blind people. In Proceedings of the SIGCHI Conference on Human Factors in Computing Systems , CHI ’13, pages 2117–2126, New York, NY , USA, 2013. ACM. 4
work page 2013
Show all 46 references
-
[9]
Crowdsourcing subjec- tive fashion advice using vizwiz: challenges and opportuni- ties
Michele A Burton, Erin Brady, Robin Brewer, Callie Neylan, Jeffrey P Bigham, and Amy Hurst. Crowdsourcing subjec- tive fashion advice using vizwiz: challenges and opportuni- ties. In Proceedings of the 14th international ACM SIGAC- CESS conference on Computers and accessibilit...
2012
-
[10]
Vijayakumar, Stanislaw Antol, Mohit Bansal, Dhruv Batra, C
Arjun Chandrasekaran, Ashwin K. Vijayakumar, Stanislaw Antol, Mohit Bansal, Dhruv Batra, C. Lawrence Zitnick, and Devi Parikh. We are humor beings: Understanding and pre- dicting visual humor. InProceedings of the IEEE Conference on Computer Vision and Pattern Recognition , pa...
2016
-
[11]
From covariation to causation: a causal power theory
Patricia W Cheng. From covariation to causation: a causal power theory. Psychological review, 104(2):367, 1997. 6
1997
-
[12]
A coefficient of agreement for nominal scales
Jacob Cohen. A coefficient of agreement for nominal scales. Educational and psychological measurement , 20(1):37–46,
-
[13]
Crowd- sourcing ground truth for medical relation extraction
Anca Dumitrache, Lora Aroyo, and Chris Welty. Crowd- sourcing ground truth for medical relation extraction. arXiv preprint arXiv:1701.02185, 2017. 2
2017 arXiv
-
[14]
Increasing cheat robustness of crowdsourcing tasks
Carsten Eickhoff and Arjen P de Vries. Increasing cheat robustness of crowdsourcing tasks. Information retrieval, 16(2):121–137, 2013. 2, 3, 5
2013
-
[15]
Understanding malicious behavior in crowd- sourcing platforms: The case of online surveys
Ujwal Gadiraju, Ricardo Kawase, Stefan Dietze, and Gian- luca Demartini. Understanding malicious behavior in crowd- sourcing platforms: The case of online surveys. In Proceed- ings of the 33rd Annual ACM Conference on Human Factors in Computing Systems, pages 1631–1640. ACM, 2...
2015
-
[16]
Clarity is a worthwhile quality: On the role of task clarity in microtask crowdsourcing
Ujwal Gadiraju, Jie Yang, and Alessandro Bozzon. Clarity is a worthwhile quality: On the role of task clarity in microtask crowdsourcing. In Proceedings of the 28th ACM Conference on Hypertext and Social Media, pages 5–14. ACM, 2017. 5
2017
-
[17]
Making the V in VQA matter: Ele- vating the role of image understanding in Visual Question Answering
Yash Goyal, Tejas Khot, Douglas Summers-Stay, Dhruv Ba- tra, and Devi Parikh. Making the V in VQA matter: Ele- vating the role of image understanding in Visual Question Answering. In CVPR, volume 1, page 9, 2017. 2, 4, 7
2017
-
[18]
CrowdVerge: Predict- ing If People Will Agree on the Answer to a Visual Question
Danna Gurari and Kristen Grauman. CrowdVerge: Predict- ing If People Will Agree on the Answer to a Visual Question. In Proceedings of the 2017 CHI Conference on Human Fac- tors in Computing Systems , pages 3511–3522. ACM, 2017. 1, 2, 3
2017
-
[19]
Predicting Foreground Object Ambiguity and Efficiently Crowdsourcing the Segmentation (s)
Danna Gurari, Kun He, Bo Xiong, Jianming Zhang, Mehrnoosh Sameki, Suyog Dutt Jain, Stan Sclaroff, Margrit Betke, and Kristen Grauman. Predicting Foreground Object Ambiguity and Efficiently Crowdsourcing the Segmentation (s). International Journal of Computer Vision, 126(7):714–...
2018
-
[20]
Stangl, Anhong Guo, Chi Lin, Kristen Grauman, Jiebo Luo, and Jeffrey P
Danna Gurari, Qing Li, Abigale J. Stangl, Anhong Guo, Chi Lin, Kristen Grauman, Jiebo Luo, and Jeffrey P. Bigham. VizWiz Grand Challenge: Answering Visual Questions from Blind People. In Proceedings of the IEEE Conference on Computer Vision and Pattern Recognition , pages 3608...
2018
-
[21]
Domain-independent quality measures for crowd truth dis- agreement
Oana Inel, Lora Aroyo, Chris Welty, and Robert-Jan Sips. Domain-independent quality measures for crowd truth dis- agreement. Detection, Representation, and Exploitation of Events in the Semantic Web, page 2, 2013. 2
2013
-
[22]
Crowdtruth: Machine- human computation framework for harnessing disagreement in gathering annotated data
Oana Inel, Khalid Khamkham, Tatiana Cristea, Anca Dumi- trache, Arne Rutjes, Jelle van der Ploeg, Lukasz Romaszko, Lora Aroyo, and Robert-Jan Sips. Crowdtruth: Machine- human computation framework for harnessing disagreement in gathering annotated data. In International Semant...
2014
-
[23]
What makes an image memorable? In CVPR 2011, pages 145–152
Phillip Isola, Jianxiong Xiao, Antonio Torralba, and Aude Oliva. What makes an image memorable? In CVPR 2011, pages 145–152. IEEE, 2011. 3
2011
-
[24]
Image specificity
Mainak Jas and Devi Parikh. Image specificity. In Proceed- ings of the IEEE Conference on Computer Vision and Pattern Recognition, pages 2727–2736, 2015. 1, 2, 3
2015
-
[25]
An analysis of visual question answering algorithms
Kushal Kafle and Christopher Kanan. An analysis of visual question answering algorithms. In 2017 IEEE International Conference on Computer Vision (ICCV), pages 1983–1991. IEEE, 2017. 1, 2
2017
-
[26]
Discovering at- tribute shades of meaning with the crowd
Adriana Kovashka and Kristen Grauman. Discovering at- tribute shades of meaning with the crowd. International Journal of Computer Vision, 114(1):56–73, 2015. 1, 2, 3
2015
-
[27]
Learning to Disambiguate by Asking Discrim- inative Questions
Yining Li, Chen Huang, Xiaoou Tang, and Chen Change Loy. Learning to Disambiguate by Asking Discrim- inative Questions. In 2017 IEEE International Conference on Computer Vision (ICCV) , pages 3439–3448, Oct. 2017. ISSN:. 5
2017
-
[28]
Microsoft COCO: Common objects in context
Tsung-Yi Lin, Michael Maire, Serge Belongie, James Hays, Pietro Perona, Deva Ramanan, Piotr Doll´ar, and C Lawrence Zitnick. Microsoft COCO: Common objects in context. In European Conference on Computer Vision, pages 740–755. Springer, 2014. 4
2014
-
[29]
The mean- ing and computation of causal power: Comment on cheng (1997) and novick and cheng (2004)
Christian C Luhmann and Woo-kyoung Ahn. The mean- ing and computation of causal power: Comment on cheng (1997) and novick and cheng (2004). 2005. 6
1997
-
[30]
The promise of premise: Harnessing question premises in visual question answering
Aroma Mahendru, Viraj Prabhu, Akrit Mohapatra, Dhruv Batra, and Stefan Lee. The promise of premise: Harnessing question premises in visual question answering. EMNLP,
-
[31]
Ask Your Neurons: A Neural-Based Approach to Answering Questions about Images
Mateusz Malinowski, Marcus Rohrbach, and Mario Fritz. Ask Your Neurons: A Neural-Based Approach to Answering Questions about Images. In 2015 IEEE International Con- ference on Computer Vision (ICCV), pages 1–9, Dec. 2015. ISSN:. 1, 2
2015
-
[32]
Crowdsourcing question-answer meaning representations
Julian Michael, Gabriel Stanovsky, Luheng He, Ido Da- gan, and Luke Zettlemoyer. Crowdsourcing question-answer meaning representations. arXiv preprint arXiv:1711.05885,
-
[33]
Probabilistic modeling for crowdsourcing partially-subjective ratings
An Thanh Nguyen, Matthew Halpern, Byron C Wallace, and Matthew Lease. Probabilistic modeling for crowdsourcing partially-subjective ratings. In Fourth AAAI Conference on Human Computation and Crowdsourcing, 2016. 3
2016
-
[34]
Glove: Global vectors for word representation
Jeffrey Pennington, Richard Socher, and Christopher Man- ning. Glove: Global vectors for word representation. In Proceedings of the 2014 conference on empirical methods in natural language processing (EMNLP) , pages 1532–1543,
2014
-
[35]
Faster r-cnn: Towards real-time object detection with region proposal networks
Shaoqing Ren, Kaiming He, Ross Girshick, and Jian Sun. Faster r-cnn: Towards real-time object detection with region proposal networks. In Advances in neural information pro- cessing systems, pages 91–99, 2015. 7
2015
-
[36]
Ambi- guity Helps: Classification with Disagreements in Crowd- sourced Annotations
Viktoriia Sharmanska, Daniel Hern ´andez-Lobato, Jose Miguel Hernandez-Lobato, and Novi Quadrianto. Ambi- guity Helps: Classification with Disagreements in Crowd- sourced Annotations. In 2016 IEEE Conference on Com- puter Vision and Pattern Recognition (CVPR), pages 2194– 2202,...
2016
-
[37]
Square: A bench- mark for research on computing crowd consensus
Aashish Sheshadri and Matthew Lease. Square: A bench- mark for research on computing crowd consensus. In First AAAI Conference on Human Computation and Crowdsourc- ing, 2013. 2, 8
2013
-
[38]
Measuring crowd truth: Dis- agreement metrics combined with worker behavior filters
Guillermo Sober ´on, Lora Aroyo, Chris Welty, Oana Inel, Hui Lin, and Manfred Overmeen. Measuring crowd truth: Dis- agreement metrics combined with worker behavior filters. In CrowdSem 2013 Workshop, 2013. 2
2013
-
[39]
Tips and tricks for visual question an- swering: Learnings from the 2017 challenge
Damien Teney, Peter Anderson, Xiaodong He, and Anton van den Hengel. Tips and tricks for visual question an- swering: Learnings from the 2017 challenge. In Proceed- ings of the IEEE Conference on Computer Vision and Pattern Recognition, pages 4223–4232, 2018. 1, 2, 3
2017
-
[40]
Tips and tricks for visual question answer- ing: Learnings from the 2017 challenge
Damien Teney, Peter Anderson, Xiaodong He, and Anton van den Hengel. Tips and tricks for visual question answer- ing: Learnings from the 2017 challenge. CVPR, pages 4223– 4232, 2018. 7, 8
2017
-
[41]
How much spam can you take? an analysis of crowdsourcing results to increase accuracy
Jeroen Vuurens, Arjen P de Vries, and Carsten Eickhoff. How much spam can you take? an analysis of crowdsourcing results to increase accuracy. In Proc. ACM SIGIR Workshop on Crowdsourcing for Information Retrieval (CIR’11), pages 21–26, 2011. 3
2011
-
[42]
Obtaining high- quality relevance judgments using crowdsourcing
Jeroen BP Vuurens and Arjen P De Vries. Obtaining high- quality relevance judgments using crowdsourcing. IEEE In- ternet Computing, 16(5):20–27, 2012. 2, 3, 5
2012
-
[43]
Modeling Ambiguity, Subjectivity, and Diverging Viewpoints in Opinion Question Answering Systems
Mengting Wan and Julian McAuley. Modeling Ambiguity, Subjectivity, and Diverging Viewpoints in Opinion Question Answering Systems. In 2016 IEEE 16th International Con- ference on Data Mining (ICDM), pages 489–498, Dec. 2016. ISSN:. 1, 2, 3, 5
2016
-
[44]
The multidimensional wisdom of crowds
Peter Welinder, Steve Branson, Pietro Perona, and Serge J Belongie. The multidimensional wisdom of crowds. In Advances in Neural Information Processing Systems , pages 2424–2432, 2010. 2, 3
2010
-
[45]
Visual Question Answer Diversity
Chun-Ju Yang, Kristen Grauman, and Danna Gurari. Visual Question Answer Diversity. In HCOMP, pages 184–192,
-
[2018]
3 Appendix This document supplements our methods and results provided in the main paper. A. Crowdsourcing Task (supplements section 3 of the main paper) A.1. User Interface The crowdsourcing user interface is shown in Figure 6. (a) (b) Figure 6: (a) Task instructions to train ...
Reviewed August 14, 2026 · model on record in the stance chip above.
Discussion (0). Continue with ORCID to comment.