REVIEW 4 major objections 6 minor 15 references
Local Score Dependent Model Explanation for Time Dependent Covariates
T0 review · 4 major / 6 minor · reviewed 2026-08-14 · deepseek-v4-flash
Pith's one-line read This paper argues that a binary classifier's score and the true response form a Markov process, so survival analysis can explain time series black boxes.
desk verdict Score-as-time survival analysis is a genuinely different idea for explaining time series classifiers, but the paper's proof claim is really an assumption and the validation is missing. read the letter →
The pith
A machine-rendered reading of the paper's core claim, the machinery that carries it, and where it could break.
The reading
What carries the argument
The load-bearing mechanism is the score-as-time survival model: the model's score $S$ is declared analogous to time, and the inclusion function $I(s)=P(S>s)$ is rebuilt as a product-integral $I(s)=\prod_{u\le s}(1-dA(u))$, estimated by the product-limit estimator. On top of that sit the Cox proportional hazards model, which expresses the hazard of a positive response as a baseline hazard times multiplicative feature effects $e^{\beta Z}$, and a generalized additive model that lets the $\beta$'s themselves depend on score. Together they convert a black box's ranking of observations into a probabilistic account of which covariates push an observation toward the modeled class, and at what score regions that push is strongest.
What would settle it
Take a trained binary classifier and a scored dataset. Split the observations by a feature measured at low scores (e.g., the value of SMART 242 in the first look-back day). Estimate the transition probability $P(\text{response at score } s_2 \mid \text{score } s_1)$ separately within each low-score group, with $s_1 < s_2$. If the estimated transition probabilities differ materially across groups after conditioning on the score at $s_1$, the Markov property fails, and the product-limit estimator and Cox hazard model are not valid descriptions of the score process.
Extended reading notes
Core claim
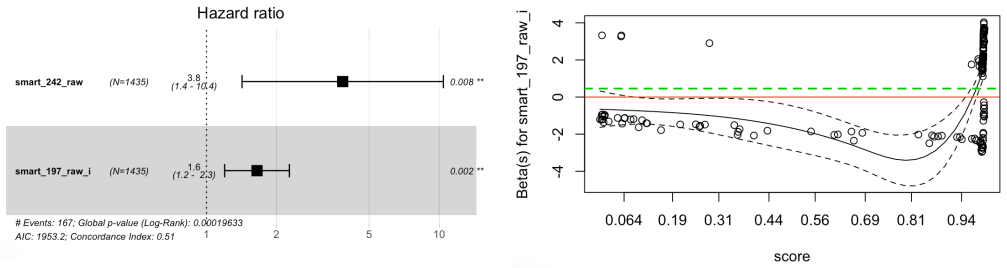
On its own terms, the paper's central discovery is a translation: the ordered output scores of a binary classifier are reinterpreted as a time index, and the event 'the observation is a true positive' is treated as a transition in a two-state Markov process with an absorbing responder state. Under the Markov assumption, the cumulative probability of a response by score $s$ is $I(s)=\prod_{u\le s}(1-dA(u))=\exp(-\int_0^s \alpha(u)\,du)$, and this survival curve is estimated nonparametrically with the product-limit estimator, commonly called the Kaplan-Meier estimator. A Cox proportional hazards model then explains the hazard $\alpha(s|Z)=\alpha_0(s)\exp(\beta Z)$ in terms of the original input features, and a generalized additive extension allows the coefficients $\beta(s)$ to vary with score, producing local explanations. In the hard-drive experiment, the global explanation finds that the indicator for SMART 197 and the normalized SMART 242 count raise failure risk by factors of 1.6484 and 3.8486, while the score-dependent explanation shows SMART 197's risk contribution is only positive in high-score regions and negative at low scores.
Load-bearing premise
The load-bearing premise is that the score-to-response process is memoryless: once an observation's current score is known, its lower-score feature values add no information about whether it will respond at higher scores.
Editorial extensions
If this is right
- Any binary classifier that emits a usable score, not just neural networks, can in principle be explained by fitting this survival model over its scores.
- Time-dependent covariates enter the explanation naturally: values in a look-back window are treated as censored observations, so the temporal structure of time series is part of the explanation rather than discarded.
- Score-dependent coefficients turn global feature importance into a local statement, e.g., a feature can be protective at low scores and harmful at high scores.
- The product-limit estimator over scores gives a survival-theoretic definition of the recall curve: the cumulative probability that a true positive has appeared by a score segment.
- The method's output is directly usable by domain experts as hazard ratios: a feature with coefficient $\beta$ multiplies the baseline failure probability by $e^\beta$.
Reading between the lines
- If the score-as-time Markov assumption holds only approximately, the hazard ratios are still descriptive summaries of the score-response association, but their causal reading weakens; a natural next step is a diagnostic test of the Markov assumption on held-out scores.
- The same setup could be applied to multiclass classifiers by treating each class as a competing risk, or to regression models by defining 'response' as a large residual.
- Score-dependent explanations suggest a practical auditing tool: comparing the hazard curves of protected subgroups could reveal score regions where a model's reliance on a feature differs across groups.
- Because the method needs more true positives than covariates, regularized or penalized survival models are a natural extension for rare-event datasets where the current estimator would be unstable.
Signed reviews
Editorial analysis
A structured set of objections, weighed in public.
Referee Report
Summary. The paper proposes a post-hoc explanation method for binary classifiers on time-series data. It treats the classifier's score as an index analogous to time, models the transition of an observation from a non-responder to a responder as a Markov process, and then uses survival-analysis machinery — the product-limit estimator, Cox proportional hazards regression, and an additive Cox/GAM extension — to associate feature covariates with the hazard of a positive response. The method is demonstrated on an LSTM trained on Backblaze SMART hard-drive data, with SMART 242 and the SMART 197 indicator reported as the significant explanatory variables. The paper claims, in Section 1, that this is the first proof that the model score and response form a Markov process state space model, and that the resulting explanations incorporate time-dependent data.
Significance. The idea of using the score axis as a time axis is potentially interesting and connects model explanation to a mature statistical toolbox. The paper correctly reproduces standard product-limit and martingale equations and the CPH setup, and it explicitly attempts to provide global and local explanations rather than only feature-attribution heatmaps. However, the central theoretical claim is not established: the Markov property is asserted as an assumption, not proven, and the paper's own wording in Sections 3 and 4 admits this. The interpretation of the continuous-covariate hazard ratio is incorrect, the local score-dependent GAM curves are presented without uncertainty estimates, and no fidelity check ties the fitted survival models to the LSTM's actual score-generating process. The experimental evaluation therefore does not support the stated novelty, and the proposed explanations cannot be considered faithful to the black-box model without substantial additional validation. No code or data are provided, which further limits reproducibility.
major comments (4)
- [Section 1 and Section 4] The claim that 'the model score and response has been proven to be a Markov process state space model' is not supported by the manuscript. In Section 4 the authors define X(s) and then state 'The assumption holds as long as the value of X at lower scores is uninformative when predicting outcomes of X at higher scores, or lower scores and higher scores are independent given the scores.' This is a substantive conditional-independence assumption, not a derived theorem. Section 3 even says the method is 'derived using the assumption of an underlying Markov process,' which contradicts the 'proven' claim in Section 1. The distinction is load-bearing because the LSTM in Section 6.2 uses a 5-day lookback and a hidden state; nothing in the paper rules out that lower-score information (e.g., earlier SMART statistics or the hidden state) is informative about failure at higher scores beyond the current score. A test of the Markov property — for example, comparing product-limit transition estimates conditioned on lower-score histories — is required before the hazard estimates in Table 1 and the curves in Figures 3-4 can be interpreted as explanations of the black box. As written, the central derivation treats a premise as a theorem.
- [Section 4.4, Section 6.4, Table 1] The interpretation of the continuous covariate SMART 242 is incorrect. The text says a hard drive is '3.8486 times the normalized SMART 242 statistic times more likely than the baseline hazard rate.' For a continuous covariate Z, exp(beta) is the hazard ratio for a one-unit increase in Z. Since SMART 242 is normalized to [0,1], a one-unit increase spans the entire observed range of that covariate, so the statement is not a general claim about the presence of the feature. The sentence should be rewritten as 'a one-unit increase in normalized SMART 242 multiplies the hazard by 3.85,' or the hazard ratio for a practically meaningful increment should be reported. This is not a purely cosmetic issue because the explanatory conclusion in Section 6.4 depends on the magnitude and meaning of the reported hazard ratio.
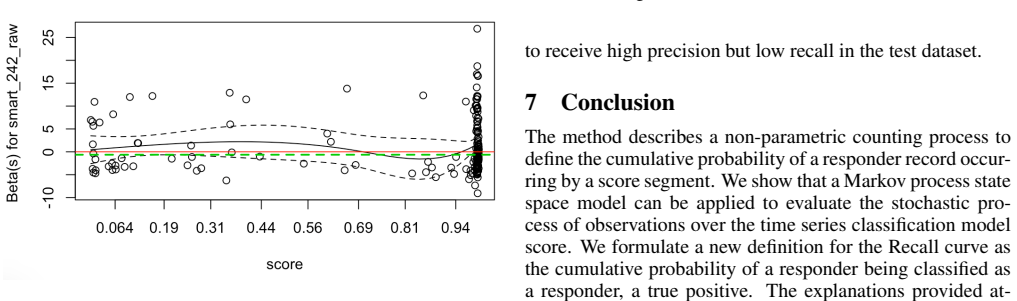
- [Figures 3 and 4, Section 5.3] The score-dependent coefficient curves are the only evidence for the local explanations, but they are plotted without confidence intervals or standard-error bands. The estimation procedure for the additive Cox model is described only at a high level: the text does not specify the smoothing parameter selection, basis dimension, penalization, or how significance of the smooth terms was assessed. Without uncertainty quantification, the claim in Section 6.4 that 'SMART 197 leads to a greater probability of failure only for higher score regions while in lower score regions indicates a lower probability of failure than the baseline hazard rate' is unsupported. The apparent reversal in Figure 4 could be noise, and the reader has no way to assess this from the manuscript.
- [Section 6.4 and Table 1] The 'MSE Ratio' column in Table 1 is never defined or discussed in the text. If it is intended as a fidelity measure of the explanation, it needs a clear definition and an indication of what level of fidelity is acceptable; if it is not, it should be removed. More generally, the paper does not check whether the fitted proportional-hazards or additive models reproduce the LSTM's score-to-response mapping. Without such a check, the reported coefficients describe associations between covariates and model scores in the training data, and calling them 'explanations' of the black box requires an independent fidelity test that is missing. This is the circularity concern: the survival models are fitted to score-response pairs generated by the LSTM and then used to explain the LSTM, with no validation that the surrogate captures the model's actual decision logic.
minor comments (6)
- [Section 6.2] The text says 'Relu activation functions'; this should be 'ReLU activation functions.'
- [Section 6.4 and Figure 4] The caption and text contain a stray 'i' in 'SMART 197 i in Figure 4'; the notation should be cleaned up.
- [Section 6.1] The company name is misspelled as 'Blackblaze'; it should be 'Backblaze.'
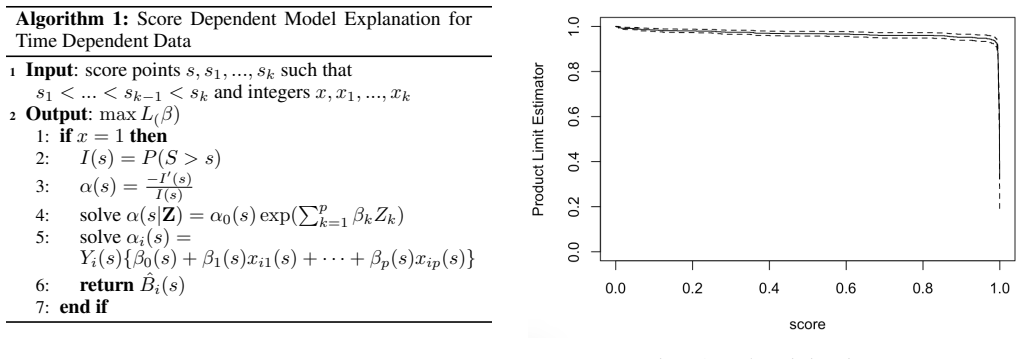
- [Figure 1] The product-limit estimator is plotted without confidence bands, even though Section 4.3 provides a variance formula; adding confidence bands would help readers assess the uncertainty in the inclusion curve.
- [Abstract and Section 5.3] The abstract uses 'Generalized Additive Model' but the body mostly says 'Additive Cox Proportional Hazards Model'; the terminology should be consistent throughout.
- [Algorithm 1] Algorithm 1 is under-specified: it returns 'maxL(β)' but the text describes returning cumulative regression functions B_i(s); the algorithm and the surrounding text should be aligned.
Circularity Check
No fitted-input circularity in the explanation pipeline; the only circular step is the 'proof' of the Markov property, which is stated as an assumption.
-
self definitional
[Section 1 (Introduction) and Section 4 (Theoretical Analysis)]
"To our knowledge, our work provides the first time that the model score and response has been proven to be a Markov process state space model and the explanation incorporates time dependent data for global explanations and score dependent explanations. ... The random process of responder observations over the model score can be modeled as a Markov process. ... The assumption holds as long as the value of X at lower scores is uninformative when predicting outcomes of X at higher scores, or lower scores and higher scores are independent given the scores."
Section 1 claims a proof that the score-to-response process is Markov, but Section 4 does not derive this from the LSTM or from data. It opens with 'can be modeled as a Markov process' and then states 'The assumption holds as long as ...'. The conditional-independence condition is exactly the Markov definition, so the claimed 'proof' is the assumption restated. This is load-bearing because the product-limit estimator, CPH, and GAM are all interpreted as score-to-response hazards: if the Markov premise fails, the fitted coefficients lose the stated probabilistic meaning. The 'proven' novelty claim therefore reduces to the modeler's assumption by construction.
full rationale
The explanation pipeline itself is otherwise self-contained: the product-limit estimator, Cox proportional hazards, and additive hazard regressions follow standard survival-analysis equations, and the CPH/GAM coefficients are outputs of those fits rather than renamed predictions of held-out behavior. There are no load-bearing self-citations; the cited sources are external textbook and method references. The unsupported Markov assumption is a real correctness and testability risk, but it is explicitly flagged in the text and does not make the survival analysis calculations themselves circular. The score of 4 reflects one definitional overclaim in the central novelty statement while the remaining derivation is independent.
Assumptions & free parameters
free parameters (3)
- Cox coefficient beta for SMART 197 indicator =
0.4998 (exp = 1.6484)
- Cox coefficient beta for SMART 242 normalized =
1.3477 (exp = 3.8486)
- Score-dependent GAM coefficient curves =
beta_197(s) and beta_242(s) curves in Figures 3 and 4
assumptions (5)
- domain assumption The score-to-response process X(s) is Markov: lower scores are uninformative for higher-score outcome given the current score.
- domain assumption Non-responders are absorbing and can be truncated from the analysis.
- domain assumption Censored observations are non-informative for the product-limit estimator.
- domain assumption Proportional hazards holds for the CPH explanation (constant covariate effects across score).
- domain assumption Input features have a causal relationship to the classification label.
Cite this review
Pith. "Pith review of Local Score Dependent Model Explanation for Time Dependent Covariates." pith.science (2026). https://pith.science/paper/K54H6MKN
@misc{pith2026190804839,
  author       = {Pith},
  title        = {Pith review of: Local Score Dependent Model Explanation for Time Dependent Covariates},
  year         = {2026},
  howpublished = {\url{https://pith.science/paper/K54H6MKN}},
  note         = {Machine review of arXiv:1908.04839}
}
read the original abstract
The use of deep neural networks to make high risk decisions creates a need for global and local explanations so that users and experts have confidence in the modeling algorithms. We introduce a novel technique to find global and local explanations for time series data used in binary classification machine learning systems. We identify the most salient of the original features used by a black box model to distinguish between classes. The explanation can be made on categorical, continuous, and time series data and can be generalized to any binary classification model. The analysis is conducted on time series data to train a long short-term memory deep neural network and uses the time dependent structure of the underlying features in the explanation. The proposed technique attributes weights to features to explain an observations risk of belonging to a class as a multiplicative factor of a base hazard rate. We use a variation of the Cox Proportional Hazards regression, a Generalized Additive Model, to explain the effect of variables upon the probability of an in-class response for a score output from the black box model. The covariates incorporate time dependence structure in the features so the explanation is inclusive of the underlying time series data structure.
Figures
Reference graph
Works this paper leans on
-
[1]
Survival and event history analysis: a process point of view
[Aalen et al., 2008] Odd Aalen, Ornulf Borgan, and Hakon Gjessing. Survival and event history analysis: a process point of view. Springer Science & Business Media,
work page 2008
-
[6]
Long short-term memory
[Hochreiter and Schmidhuber, 1997] Sepp Hochreiter and J¨urgen Schmidhuber. Long short-term memory. Neural computation, 9(8):1735–1780,
1997
-
[10]
[Paul and Baschnagel, 2013] Wolfgang Paul and J ¨org Baschnagel. Stochastic processes , volume
work page 2013
-
[15]
The challenge of crafting intelligible intelligence
[Weld and Bansal, 2018] Daniel S Weld and Gagan Bansal. The challenge of crafting intelligible intelligence. arXiv preprint arXiv:1803.04263, 2018
arXiv 2018
-
[1994]
Explaining deep classi- fication of time-series data with learned prototypes
[Gee et al., 2019] Alan H Gee, Diego Garcia-Olano, Joy- deep Ghosh, and David Paydarfar. Explaining deep classi- fication of time-series data with learned prototypes. arXiv preprint arXiv:1904.08935,
arXiv 2019
-
[1997]
Principles of explanatory debugging to personalize interactive machine learning
[Kulesza et al., 2015] Todd Kulesza, Margaret Burnett, Weng-Keen Wong, and Simone Stumpf. Principles of explanatory debugging to personalize interactive machine learning. In Proceedings of the 20th international confer- ence on intelligent user interfaces , pages 126–137. ACM,
work page 2015
-
[2008]
[Bagnall et al., 2017] Anthony Bagnall, Jason Lines, Aaron Bostrom, James Large, and Eamonn Keogh. The great time series classification bake off: a review and experi- mental evaluation of recent algorithmic advances. Data Mining and Knowledge Discovery , 31(3):606–660,
work page 2017
-
[2012]
[Wachter et al., 2017] Sandra Wachter, Brent Mittelstadt, and Luciano Floridi. Why a right to explanation of auto- mated decision-making does not exist in the general data protection regulation. International Data Privacy Law , 7(2):76–99,
work page 2017
Show all 15 references
-
[2013]
Introduction to probability models
[Ross, 2014] Sheldon M Ross. Introduction to probability models. Academic press,
2014
-
[2014]
S eq 2s eq-v is: A visual debugging tool for sequence-to-sequence models
[Strobelt et al., 2018] Hendrik Strobelt, Sebastian Gehrmann, Michael Behrisch, Adam Perer, Hanspeter Pfister, and Alexander M Rush. S eq 2s eq-v is: A visual debugging tool for sequence-to-sequence models. IEEE transactions on visualization and computer graphics , 25(1):353–363,
2018
-
[2015]
The mythos of model in- terpretability
[Lipton, 2016] Zachary C Lipton. The mythos of model in- terpretability. arXiv preprint arXiv:1606.03490,
2016 arXiv
-
[2016]
Explaining nonlinear classification deci- sions with deep taylor decomposition
[Montavon et al., 2017] Gr´egoire Montavon, Sebastian La- puschkin, Alexander Binder, Wojciech Samek, and Klaus- Robert M ¨uller. Explaining nonlinear classification deci- sions with deep taylor decomposition. Pattern Recogni- tion, 65:211–222,
2017
-
[2017]
Learning long-term dependencies with gra- dient descent is difficult
[Bengio et al., 1994] Yoshua Bengio, Patrice Simard, Paolo Frasconi, et al. Learning long-term dependencies with gra- dient descent is difficult. IEEE transactions on neural net- works, 5(2):157–166,
1994
-
[2018]
Two-stage support vector classifier and recurrent neural network predictor for pavement per- formance modeling
[Tabatabaee et al., 2012] Nader Tabatabaee, Mojtaba Ziyadi, and Yousef Shafahi. Two-stage support vector classifier and recurrent neural network predictor for pavement per- formance modeling. Journal of Infrastructure Systems , 19(3):266–274,
2012
-
[2019]
European union regulations on algorithmic decision-making and a right to explanation
Covariate Coeff exp(Coeff) se(Coeff) z P value MSE Ratio SMART 197 i 0.4998 1.6484 0.1634 3.059 0.00222 +8.1% SMART 242 1.3477 3.8486 0.5083 2.652 0.00801 +3.9% Table 1: CPH Explanation with Time Dependent Data [Goodman and Flaxman, 2017] Bryce Goodman and Seth Flaxman. Europe...
2017
Reviewed August 14, 2026 · model on record in the stance chip above.
Discussion (0). Continue with ORCID to comment.