REVIEW 4 major objections 5 minor 51 references
A Tour of Convolutional Networks Guided by Linear Interpreters
T0 review · 4 major / 5 minor · reviewed 2026-08-14 · deepseek-v4-flash
Pith's one-line read A CNN can be replayed as an input-dependent linear map, and probing that map reveals bias-dominated classifier scores, wavelet-like bases in super-resolution, and copy-move tricks in CycleGAN.
desk verdict A real, efficient interpretability tool (LinearScope) that deserves referee time, but its headline claims about wavelet-like bases and pixel votes are qualitative and need quantitative backing. read the letter →
The pith
A machine-rendered reading of the paper's core claim, the machinery that carries it, and where it could break.
The reading
What carries the argument
The machinery is the LinearScope hook combined with the freezing interpretation of non-linearities. For a unit $y_0=h(x_0)$ the hook emits $[h(x_0), A(x_0)x_1+c(x_0)]$; for ReLU and Sigmoid $A$ is a mask, for max-pooling a selection matrix, and for instance normalization a fixed mean and scale, all chosen from the first batch and applied to the second. Because every non-linearity becomes linear once its decision is fixed, composing the hooks yields the whole-network interpreter $y_1=F(x_0)x_1+r(x_0)$. The remaining machinery is probing: the residual is $y_1(0)$, a column is $y_1(\delta_k)-r$, the transposed map is obtained from the automatic-differentiation identity $F^T y_2 = \nabla_{x_1}y_1 \cdot y_2$, and an accelerated power method with deflation computes SVD eigen-inputs and eigen-outputs without materializing $F$. A theorem for sequential networks decomposes the residual into forward-projected masked biases, which is what makes layer-wise contribution histograms and pixel votes possible.
What would settle it
Compare the SVD eigen-modes of EDSR against those of a bicubic upscaler and a random linear map with identical input and output dimensions, measuring spatial localization, orientation selectivity, and spectral bandwidth with numerical indices rather than visual inspection; if the CNN modes are statistically indistinguishable from the generic linear baselines, the wavelet-basis claim would be refuted, and if they separate cleanly, it would be supported.
Extended reading notes
Core claim
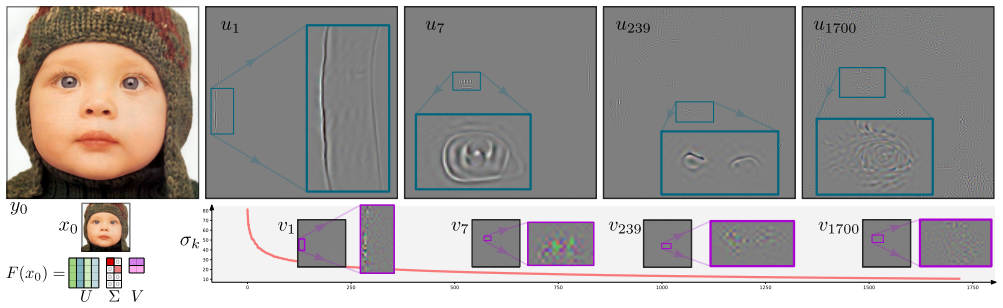
The paper's central claim is that a convolutional network run on one input can be replayed, for that same input, as a single affine map $y = F(x_0)x + r(x_0)$, provided each non-linear unit's action is frozen according to the decisions it made on $x_0$: ReLU becomes a binary mask, max-pooling becomes a selection, and instance normalization becomes a fixed mean and scale. A hooking layer, LinearScope, returns $[h(x_0), A(x_0)x_1+c(x_0)]$ for a second batch, so the interpreter runs in parallel without storing activations. Using probe inputs $x_1=0$ and $x_1=\delta_k$, the gradient identity $F^T y_2 = \nabla_{x_1}y_1 \cdot y_2$, and a deflated power method, the paper obtains residuals, rows, columns, transposed maps, and SVD modes of $F(x_0)$ without ever forming the matrix. On this basis it reports that ImageNet classifiers derive more than 80% of their scores from the bias residual, that back-projected pixel contributions behave like independent per-pixel votes that focus on objects, that SR and I2I networks have SVD bases that are spatially localized, oriented, and bandpass like wavelets, and that CycleGAN uses off-diagonal filter entries to copy textures from fixed regions and to create output templates such as window boxes.
Load-bearing premise
The claim that SR and I2I networks use a wavelet-type basis rests on visual similarity between SVD eigen-images and Gabor patches, with no quantitative orientation or bandwidth measurement and no comparison against generic linear upsamplers, so the human-visual-system conclusion is an interpretation of figures rather than a measured property.
Editorial extensions
If this is right
- LinearScope extends the earlier freezing approach to networks too large to store activations for, making row, column, transpose, and SVD probes feasible on models like EDSR and CycleGAN.
- For classifiers, the decomposition into $F(x_0)x_0$ plus forward-projected masked biases locates where scores are built; batch normalization shifts these contributions deeper, and adversarial attacks spread pixel votes across all classes.
- For super-resolution, SVD modes show that better models such as EDSR concentrate high-singular-value responses on recognizable high-level parts of the image, while a simpler PixelShuffle model does not.
- For CycleGAN, off-diagonal rows and columns directly document a copy-move mechanism for textures and a template-creation mechanism for facades, explaining how new objects and textures are generated.
- Residuals are small in SR but larger in I2I, so the interpreter can distinguish which part of an output is a fixed shift versus input-driven filtering.
Reading between the lines
- A quantitative Gabor-fit extension could settle the wavelet claim: fit orientation, spatial frequency, and bandwidth to each eigen-mode and compare distributions across learned CNNs, bicubic upscaling, and random linear maps.
- Because the interpreter is differentiable in $x_0$, one could add a loss term that shapes $F(x_0)$ or $r(x_0)$ toward a desired structure, making interpretability an optimization target rather than a post-hoc analysis.
- The CycleGAN off-diagonal patterns could be used as an audit tool: by inspecting columns, practitioners can detect when a generative model copies textures from a few fixed source regions, which may indicate dataset shortcuts rather than true style transfer.
- The residual-dominance result suggests that explanations limited to input-gradient heatmaps systematically miss the main driving term in classifier scores, since the bias contribution typically exceeds 80%.
Signed reviews
Editorial analysis
A structured set of objections, weighed in public.
Referee Report
Summary. The paper introduces LinearScope, a hooking layer that runs a network in two batches: one batch executes the original nonlinear network, and the second batch executes a linear interpreter of the form y1 = F(x0)x1 + r(x0) obtained by freezing the decisions of all nonlinear units for the input x0. The authors show how to compute the residual, columns, rows, transposed system, and SVD of F(x0) without materializing the matrix or storing activations, using an accelerated power method with deflation. They then apply this tool to classification networks (reporting residual-dominated scores and a 'pixel-wise vote' interpretation), to super-resolution models (reporting wavelet-type bases similar to the human visual system), and to CycleGAN image-to-image translation (reporting copy-move and template-creation strategies). The paper is explicitly exploratory and positions the LinearScope as a general instrument for such studies.
Significance. If the interpretive claims hold, the paper makes a useful methodological contribution: LinearScope is a simple, efficient extension of Deep Filter Visualization, the linear algebra for probing F(x0) is sound, and Theorem 1 is clear and independently published. The paper also ships concrete demonstrations and gives reproducible definitions for the residual and filter computations. However, the significance of the headline interpretive claims is currently limited by the lack of quantitative validation: the wavelet-type basis claim is supported only by visual similarity of selected SVD modes, the residual-dominance claim relies on an undefined contribution statistic, and the pixel-vote claim is anecdotal. These are not merely presentation issues; they are load-bearing for the paper's stated future-impact claims.
major comments (4)
- [§4 Case 2, §8.C (Figs. 5, 12, 14)] The claim that SR and I2I networks use 'wavelet-type basis similar to the human visual system' is not supported by the evidence presented. The paper never defines spatial localization, orientation selectivity, or bandpass behavior quantitatively, computes no null comparison (e.g., SVD modes of bicubic interpolation, random linear maps, or randomly initialized networks), and does not study stability of the modes across inputs x0. Because F(x0) is an input-dependent frozen linear system and Algorithm 1 with deflation can return arbitrary mixtures in the presence of near-degenerate singular values, the Gabor-like appearance in selected figures is a visual interpretation rather than a measured network property; this is load-bearing for the paper's central future-impact claims. The authors' candid statement in Section 5 that the effect of visualizations on human understanding is 'not direct' does not address this.
- [§4 Case 1, Table 3] The central classification claim that residuals contribute 'typically more than 80%' is not evaluable because the manuscript never defines the reported contribution statistic. If the quantity is r/(Fx+r) for each score, the percentage can exceed 100% or be negative due to cancellations; if it is an average over images or classes of some normalized quantity, the normalization must be specified. Equation (8) gives a decomposition of r but not a definition of 'contribution'; without this, the claimed dominance of residuals and the bias-dependence conclusion cannot be tested. Please add the exact formula and report individual-image distributions, not only means.
- [§3, Algorithm 1] Algorithm 1 is presented as the method for extracting the SVD basis, but no convergence analysis, stopping criterion, or chosen values for momentum m and step count S are given, and the algorithm is not validated against a directly materialized SVD even for a small model. The update vprev ← vcurr/||vnext|| also appears to be a typo, since vprev should be a normalized version of vcurr or some consistent momentum state. Given that the wavelet-type basis conclusion rests on these modes and that deflation is sensitive to clustered singular values, the paper should verify the computed singular values and vectors, report numerical error, and state the parameter settings.
- [§4 Case 1, Fig. 3] The 'pixel-wise vote' interpretation is based on qualitative inspection of selected images. The paper does not provide a quantitative measure of agreement among pixel votes, a comparison to chance-level voting, or a count of how often the top-1 label receives the most votes; without such evidence the statement that pixels 'clearly focus on objects' is an anecdotal observation rather than a demonstrated network strategy. Since this is one of the paper's headline discoveries, it needs an evaluable metric.
minor comments (5)
- [§1, bullet list] The abbreviation 'HSV' is used for the Human Visual System; this is incorrect and confusing because HSV commonly denotes hue-saturation-value. Please use 'HVS' throughout.
- [§4 Case 2, Figs. 5 and 12 captions] The captions assert that the basis is 'spatially localized, oriented and bandpass, comparable to wavelet basis'; this is the conclusion being argued, not a measured property. Please make the captions descriptive rather than interpretive, or add the quantitative evidence.
- [§2] In the related-work paragraph, the citation list '[12, 35, 40, 27, 3, 11, 15, 12, 35, 40, 27, 3, 11, 15, 37]' contains duplicated entries; prune the repeated references.
- [§3, Eq. (2)] The linear interpreter for Sigmoid is described only as a 'continuous mask' in Figure 2; the precise choice of A(x0) and c(x0) for sigmoid (and for other non-ReLU units) should be stated explicitly in the text.
- [§4, Fig. 8] The normalized layer-wise contributions shown in the histograms exceed 100% and can be negative; adding a sentence explaining that this is expected because contributions have opposite signs would help readers interpret the plots.
Circularity Check
No significant circularity: LinearScope is a measurement procedure; the reported strategies are empirical observations on pretrained networks, not fitted predictions or self-imported uniqueness results.
full rationale
The paper's central derivation is Eqs. (2)-(5), which define the LinearScope and the linear interpreter y1 = F(x0)x1 + r(x0). This is a definition of a measurement instrument, not a prediction fitted to data: residual, columns, rows, transpose, and SVD are computed by probing the frozen network with specific inputs (Eq. 6 and Algorithm 1). The classification decomposition in Theorem 1 is cited from the authors' own [28], but the theorem is elementary, its assumptions (sequential network with masks) are stated, and the appendix unfolds the proof (Eqs. 9-16); it does not assume the bias-dominance or pixel-vote conclusions. The 'pixel-wise vote', residual-contribution, copy-move, and template findings are measurements of pretrained models and are not forced by the definitions. The wavelet-type-basis statement is an interpretation of SVD modes based on visual similarity to Gabor patches; this is a correctness/evidence concern, not circularity, because the SVD is computed rather than chosen to match wavelets. Section 5's admission that the effect on human understanding is 'not direct' is a limitation, not a circular step. Thus no load-bearing step reduces by construction to its own inputs.
Assumptions & free parameters
free parameters (1)
- SVD iteration hyperparameters (momentum m, step count S) =
not reported
assumptions (4)
- domain assumption Freezing the decisions of non-linear units at input x0 yields an exact linear replay for any probe x1 (Eq. 3).
- standard math The gradient of y1 with respect to x1 equals F^T(x0), so automatic differentiation can compute transpose applications (Eq. 6).
- standard math The accelerated power method with deflation converges to the dominant singular triplets of F(x0).
- domain assumption Pre-trained models and the chosen ImageNet, SR, and CycleGAN test images are representative enough to support the qualitative conclusions.
Cite this review
Pith. "Pith review of A Tour of Convolutional Networks Guided by Linear Interpreters." pith.science (2026). https://pith.science/paper/GJRK5IDN
@misc{pith2026190805168,
  author       = {Pith},
  title        = {Pith review of: A Tour of Convolutional Networks Guided by Linear Interpreters},
  year         = {2026},
  howpublished = {\url{https://pith.science/paper/GJRK5IDN}},
  note         = {Machine review of arXiv:1908.05168}
}
read the original abstract
Convolutional networks are large linear systems divided into layers and connected by non-linear units. These units are the "articulations" that allow the network to adapt to the input. To understand how a network manages to solve a problem we must look at the articulated decisions in entirety. If we could capture the actions of non-linear units for a particular input, we would be able to replay the whole system back and forth as if it was always linear. It would also reveal the actions of non-linearities because the resulting linear system, a Linear Interpreter, depends on the input image. We introduce a hooking layer, called a LinearScope, which allows us to run the network and the linear interpreter in parallel. Its implementation is simple, flexible and efficient. From here we can make many curious inquiries: how do these linear systems look like? When the rows and columns of the transformation matrix are images, how do they look like? What type of basis do these linear transformations rely on? The answers depend on the problems presented, through which we take a tour to some popular architectures used for classification, super-resolution (SR) and image-to-image translation (I2I). For classification we observe that popular networks use a pixel-wise vote per class strategy and heavily rely on bias parameters. For SR and I2I we find that CNNs use wavelet-type basis similar to the human visual system. For I2I we reveal copy-move and template-creation strategies to generate outputs.
Figures


Figures from the paper (12 more)



Reference graph
Works this paper leans on
-
[1]
Sanity checks for saliency maps
Julius Adebayo, Justin Gilmer, Michael Muelly, Ian Good- fellow, Moritz Hardt, and Been Kim. Sanity checks for saliency maps. In Advances in Neural Information Process- ing Systems, pages 9505–9515. 2018. 3
work page 2018
-
[2]
Sebastian Bach, Alexander Binder, Gr ´egoire Montavon, Frederick Klauschen, Klaus-Robert M ¨uller, and Wojciech Samek. On pixel-wise explanations for non-linear classi- fier decisions by layer-wise relevance propagation.PloS one, 10(7):e0130140, 2015. 3, 6, 8, 10
work page 2015
-
[3]
A Forward-Backward Approach for Visualizing Information Flow in Deep Networks
Aditya Balu, Thanh V Nguyen, Apurva Kokate, Chinmay Hegde, and Soumik Sarkar. A forward-backward approach for visualizing information flow in deep networks. arXiv preprint arXiv:1711.06221, 2017. 3
work page Pith review arXiv 2017
-
[4]
Network dissection: Quantifying inter- pretability of deep visual representations
David Bau, Bolei Zhou, Aditya Khosla, Aude Oliva, and Antonio Torralba. Network dissection: Quantifying inter- pretability of deep visual representations. In Computer Vi- sion and Pattern Recognition, 2017. 3
work page 2017
-
[5]
David Bau, Jun-Yan Zhu, Hendrik Strobelt, Zhou Bolei, Joshua B. Tenenbaum, William T. Freeman, and Antonio Torralba. GAN dissection: Visualizing and understanding generative adversarial networks. In Proceedings of the In- ternational Conference on Learning Representations (ICLR),
-
[6]
Layer-wise relevance propagation for neural networks with local renormalization layers
Alexander Binder, Gr ´egoire Montavon, Sebastian La- puschkin, Klaus-Robert M ¨uller, and Wojciech Samek. Layer-wise relevance propagation for neural networks with local renormalization layers. In International Conference on Artificial Neural Networks, pages 63–71. Springer, 2016. 3, 6, 8
work page 2016
-
[7]
Foun- dations of data science.Vorabversion eines Lehrbuchs, 2016
Avrim Blum, John Hopcroft, and Ravindran Kannan. Foun- dations of data science.Vorabversion eines Lehrbuchs, 2016. 5
work page 2016
-
[8]
Template matching techniques in computer vision: theory and practice
Roberto Brunelli. Template matching techniques in computer vision: theory and practice. John Wiley & Sons, 2009. 5
work page 2009
Show all 51 references
-
[9]
Numerical analysis
Richard L Burden and J Douglas Faires. Numerical analysis. Cengage Learning, 9, 2010. 5
2010
-
[10]
Diverse feature visualizations reveal invariances in early layers of deep neu- ral networks
Santiago A Cadena, Marissa A Weis, Leon A Gatys, Matthias Bethge, and Alexander S Ecker. Diverse feature visualizations reveal invariances in early layers of deep neu- ral networks. arXiv preprint arXiv:1807.10589, 2018. 3
2018 arXiv
-
[11]
Understanding deep architectures by interpretable visual summaries
Marco Carletti, Marco Godi, Maedeh Aghaei, and Marco Cristani. Understanding deep architectures by interpretable visual summaries. arXiv preprint arXiv:1801.09103, 2018. 3
2018 arXiv
-
[12]
Explanations based on the missing: Towards con- trastive explanations with pertinent negatives.arXiv preprint arXiv:1802.07623, 2018
Amit Dhurandhar, Pin-Yu Chen, Ronny Luss, Chun-Chen Tu, Paishun Ting, Karthikeyan Shanmugam, and Payel Das. Explanations based on the missing: Towards con- trastive explanations with pertinent negatives.arXiv preprint arXiv:1802.07623, 2018. 3
2018 arXiv
-
[13]
Tip: Typifying the interpretability of procedures
Amit Dhurandhar, Vijay Iyengar, Ronny Luss, and Karthikeyan Shanmugam. Tip: Typifying the interpretability of procedures. arXiv preprint arXiv:1706.02952, 2017. 3
2017 arXiv
-
[14]
A roadmap for a rigorous science of interpretability
Finale Doshi-Velez and Been Kim. A roadmap for a rigorous science of interpretability. arXiv preprint arXiv:1702.08608, 150, 2017. 8
2017 arXiv
-
[15]
Towards explanation of DNN–based prediction with guided feature inversion
Mengnan Du, Ninghao Liu, Qingquan Song, and Xia Hu. Towards explanation of DNN–based prediction with guided feature inversion. arXiv preprint arXiv:1804.00506, 2018. 3
2018 arXiv
-
[16]
Net2vec: Quantifying and explaining how concepts are encoded by filters in deep neural networks
Ruth Fong and Andrea Vedaldi. Net2vec: Quantifying and explaining how concepts are encoded by filters in deep neural networks. arXiv preprint arXiv:1801.03454, 2018. 3
2018 arXiv
-
[17]
Imagenet-trained CNNs are biased towards texture; in- creasing shape bias improves accuracy and robustness.arXiv preprint arXiv:1811.12231, 2018
Robert Geirhos, Patricia Rubisch, Claudio Michaelis, Matthias Bethge, Felix A Wichmann, and Wieland Bren- del. Imagenet-trained CNNs are biased towards texture; in- creasing shape bias improves accuracy and robustness.arXiv preprint arXiv:1811.12231, 2018. 2
2018 arXiv
-
[18]
In- terpretation of neural networks is fragile
Amirata Ghorbani, Abubakar Abid, and James Zou. In- terpretation of neural networks is fragile. arXiv preprint arXiv:1710.10547, 2017. 3
2017 arXiv
-
[19]
Explaining and harnessing adversarial examples
Ian Goodfellow, Jonathon Shlens, and Christian Szegedy. Explaining and harnessing adversarial examples. In Inter- national Conference on Learning Representations, 2015. 6, 11, 13
2015
-
[20]
Patchshuffle regularization
Guoliang Kang, Xuanyi Dong, Liang Zheng, and Yi Yang. Patchshuffle regularization. arXiv preprint arXiv:1707.07103, 2017. 2
2017 arXiv
-
[21]
On the decision boundary of deep neural networks
Yu Li, Peter Richtarik, Lizhong Ding, and Xin Gao. On the decision boundary of deep neural networks. arXiv preprint arXiv:1808.05385, 2018. 3
2018 arXiv
-
[22]
Enhanced deep residual networks for single image super–resolution
Bee Lim, Sanghyun Son, Heewon Kim, Seungjun Nah, and Kyoung Mu Lee. Enhanced deep residual networks for single image super–resolution. In The IEEE Conference on Com- puter Vision and Pattern Recognition (CVPR) Workshops , July 2017. 4, 7, 13, 14
2017
-
[23]
Zachary C. Lipton. The mythos of model interpretability. Queue, 16(3):30:31–30:57, June 2018. 1, 3
2018
-
[24]
A Wavelet Tour of Signal Processing
St ´ephane Mallat. A Wavelet Tour of Signal Processing. Aca- demic Press, 1998. 2, 4, 7, 16
1998
-
[25]
Ex- plaining nonlinear classification decisions with deep taylor decomposition
Gr ´egoire Montavon, Sebastian Lapuschkin, Alexander Binder, Wojciech Samek, and Klaus-Robert M ¨uller. Ex- plaining nonlinear classification decisions with deep taylor decomposition. Pattern Recognition, 65:211–222, 2017. 2, 3, 8
2017
-
[26]
On the number of linear regions of deep neural networks
Guido F Montufar, Razvan Pascanu, Kyunghyun Cho, and Yoshua Bengio. On the number of linear regions of deep neural networks. In Advances in neural information process- ing systems, pages 2924–2932, 2014. 6
2014
-
[27]
CNN fixations: An unraveling approach to visualize the dis- criminative image regions
Konda Reddy Mopuri, Utsav Garg, and R Venkatesh Babu. CNN fixations: An unraveling approach to visualize the dis- criminative image regions. 2017. 3
2017
-
[28]
Multigrid backprojection super–resolution and deep filter vi- sualization
Pablo Navarrete Michelini, Hanwen Liu, and Dan Zhu. Multigrid backprojection super–resolution and deep filter vi- sualization. In Proceedings of the Thirty–Third AAAI Con- ference on Artificial Intelligence (AAAI 2019). AAAI, 2019, arXiv preprint arXiv:1809.09326. 2, 3, 4, 5, 7
2019 arXiv
-
[29]
Feature visualization
Chris Olah, Alexander Mordvintsev, and Ludwig Schubert. Feature visualization. Distill, 2017. https://distill.pub/2017/feature-visualization. 3
2017
-
[30]
The building blocks of interpretability
Chris Olah, Arvind Satyanarayan, Ian Johnson, Shan Carter, Ludwig Schubert, Katherine Ye, and Alexander Mordvint- sev. The building blocks of interpretability. Distill, 2018. https://distill.pub/2018/building-blocks. 3
2018
-
[31]
Emergence of simple–cell receptive field properties by learning a sparse code for natural images
Bruno A Olshausen and David J Field. Emergence of simple–cell receptive field properties by learning a sparse code for natural images. Nature, 381(6583):607–609, 1996. 3, 7, 14, 16
1996
-
[32]
The matrix calculus you need for deep learning
Terence Parr and Jeremy Howard. The matrix calculus you need for deep learning. arXiv preprint arXiv:1802.01528 ,
-
[33]
Proakis and Dimitris K
John G. Proakis and Dimitris K. Manolakis. Digital Sig- nal Processing. Prentice Hall international editions. Pearson Prentice Hall, 2007. 2, 4, 7
2007
-
[34]
How convolutional neural network see the world-a survey of convolutional neural network visualization methods
Zhuwei Qin, Funxun Yu, Chenchen Liu, and Xiang Chen. How convolutional neural network see the world-a survey of convolutional neural network visualization methods. arXiv preprint arXiv:1804.11191, 2018. 3
2018 arXiv
-
[35]
Ribeiro, Sameer Singh, and Carlos Guestrin
Marco T. Ribeiro, Sameer Singh, and Carlos Guestrin. Why should i trust you?: Explaining the predictions of any classi- fier. In Proceedings of the 22nd ACM SIGKDD international conference on knowledge discovery and data mining , pages 1135–1144. ACM, 2016. 3
2016
-
[36]
The perceptron: a probabilistic model for information storage and organization in the brain
Frank Rosenblatt. The perceptron: a probabilistic model for information storage and organization in the brain. Psycho- logical review, 65(6):386, 1958. 1, 3
1958
-
[37]
Predic- tion error meta classification in semantic segmentation: De- tection via aggregated dispersion measures of softmax prob- abilities
Matthias Rottmann, Pascal Colling, Thomas-Paul Hack, Fabian H¨uger, Peter Schlicht, and Hanno Gottschalk. Predic- tion error meta classification in semantic segmentation: De- tection via aggregated dispersion measures of softmax prob- abilities. arXiv preprint arXiv:1811.00648, 2018. 3
2018 arXiv
-
[38]
Berg, and Li Fei-Fei
Olga Russakovsky, Jia Deng, Hao Su, Jonathan Krause, San- jeev Satheesh, Sean Ma, Zhiheng Huang, Andrej Karpathy, Aditya Khosla, Michael Bernstein, Alexander C. Berg, and Li Fei-Fei. ImageNet Large Scale Visual Recognition Chal- lenge. International Journal of Computer Vision ...
2015
-
[39]
Numerical methods for large eigenvalue prob- lems: revised edition, volume 66
Yousef Saad. Numerical methods for large eigenvalue prob- lems: revised edition, volume 66. Siam, 2011. 5
2011
-
[40]
Learning important features through propagating activation differences
Avanti Shrikumar, Peyton Greenside, and Anshul Kundaje. Learning important features through propagating activation differences. In Proceedings of the 34th International Confer- ence on Machine Learning, ICML 2017, Sydney, NSW, Aus- tralia, 6-11 August 2017, pages 3145–3153, 2017. 3
2017
-
[41]
Very deep convo- lutional networks for large-scale image recognition
Karen Simonyan and Andrew Zisserman. Very deep convo- lutional networks for large-scale image recognition. CoRR, abs/1409.1556, 2014. 4, 5, 6
2014 arXiv
-
[42]
Low-dimensional procedure for the characterization of human faces
Lawrence Sirovich and Michael Kirby. Low-dimensional procedure for the characterization of human faces. J. Opt. Soc. Am. A, 4(3):519–524, Mar 1987. 7
1987
-
[43]
Introduction to linear algebra , volume 3
Gilbert Strang. Introduction to linear algebra , volume 3. Wellesley-Cambridge Press Wellesley, MA, 1993. 2
1993
-
[44]
The discrete cosine transform
Gilbert Strang. The discrete cosine transform. SIAM review, 41(1):135–147, 1999. 2
1999
-
[45]
An introduction to matched filters
George Turin. An introduction to matched filters. IRE trans- actions on Information theory, 6(3):311–329, 1960. 5
1960
-
[46]
Spa- tial sine-wave responses of the human visual system
Aet Watanabe, T Mori, S Nagata, and K Hiwatashi. Spa- tial sine-wave responses of the human visual system. Vision Research, 8(9):1245–1263, 1968. 7
1968
-
[47]
Accelerated stochastic power iteration
Peng Xu, Bryan He, Christopher De Sa, Ioannis Mitliagkas, and Chris Re. Accelerated stochastic power iteration. In In- ternational Conference on Artificial Intelligence and Statis- tics, pages 58–67, 2018. 5
2018
-
[48]
Zeiler and Rob Fergus
Matthew D. Zeiler and Rob Fergus. Visualizing and un- derstanding convolutional networks. In Computer Vision - ECCV 2014 - 13th European Conference, Zurich, Switzer- land, September 6-12, 2014, Proceedings, Part I, pages 818– 833, 2014. 4, 5
2014
-
[49]
Visual interpretability for deep learning: a survey
Quan-shi Zhang and Song-Chun Zhu. Visual interpretability for deep learning: a survey. Frontiers of Information Tech- nology & Electronic Engineering, 19(1):27–39, 2018. 3
2018
-
[50]
Interpretable basis decomposition for visual explanation
Bolei Zhou, Yiyou Sun, David Bau, and Antonio Torralba. Interpretable basis decomposition for visual explanation. In Proceedings of the European Conference on Computer Vi- sion (ECCV), pages 119–134, 2018. 3
2018
-
[51]
Unpaired image–to–image translation using cycle-consistent adversarial networks
Jun-Yan Zhu, Taesung Park, Phillip Isola, and Alexei A Efros. Unpaired image–to–image translation using cycle-consistent adversarial networks. arXiv preprint arXiv:1703.10593, 2017. 4, 8, 15, 16
2017 arXiv
Reviewed August 14, 2026 · model on record in the stance chip above.
Discussion (0). Continue with ORCID to comment.