REVIEW 3 major objections 5 minor 45 references
Stimulated X-ray Raman and Absorption Spectroscopy of Iron-Sulfur Dimers
T0 review · 3 major / 5 minor · reviewed 2026-08-14 · deepseek-v4-flash
Pith's one-line read Two X-ray spectroscopies complementarily expose the dipole-forbidden d-d states of [2Fe-2S] dimers, with the Raman channel revealing states hidden from absorption.
desk verdict The DMRG excited-state calculations are solid and worth having, but the SXRS signal derivation in Eq. (9) is wrong, so the central absorption/Raman contrast and selective-excitation claim do not stand as written. read the letter →
The pith
A machine-rendered reading of the paper's core claim, the machinery that carries it, and where it could break.
The reading
What carries the argument
The central object is the transition charge density (TCD) $\sigma_{eg}(\mathbf{r}) = \langle e | \hat{\sigma}(\mathbf{r}) | g \rangle$, the matrix element of the charge density operator between ground and excited states, computed here from DMRG wavefunctions. For off-resonant SXRS the authors use the minimal-coupling Hamiltonian and a long-wavelength approximation to obtain an effective TCD $\alpha_{eg} = \frac{e}{2m\hbar c^2 \omega_{s_i}\omega_{p_i}} \int (\boldsymbol{\epsilon}_{s_i}\cdot\mathbf{r})(\boldsymbol{\epsilon}_{p_i}\cdot\mathbf{r})\,\sigma_{eg}(\mathbf{r})\,d\mathbf{r}$, which enters the signal as products $\alpha_{ge}\alpha_{eg}$. The absorption signal instead uses the transition dipole $\mu_{eg}$. The mechanism that carries the argument is the contrast between which states have large $\mu_{eg}$ versus large $\alpha_{eg}$; the TCD therefore determines both the complementarity of the two spectroscopies and the predicted selective-excitation window.
What would settle it
Measure the Y-polarized SXRS and absorption spectra of an oriented synthetic [2Fe-2S] model complex across the predicted window: for the ferric-ferric dimer the absorption-active band should peak near 2.2–2.4 eV and the Raman-active band near 2.9–3.1 eV, and in the mixed-valence dimer states 2 and 4 should appear only in absorption while states 5, 7, and 8 appear only in Raman. Alternatively, a DMRG calculation at D=3000 or with dynamic correlation that shifts the 10th–19th excited states by more than the predicted energy gap between the two bands would overturn the selective-excitation proposal.
Extended reading notes
Core claim
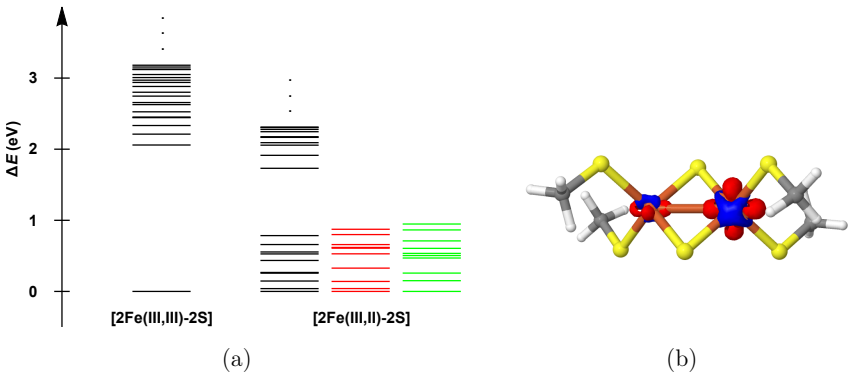
The paper establishes that for an oriented [2Fe-2S] dimer, the off-resonant stimulated X-ray Raman signal and the linear absorption signal are almost identical for X and Z polarizations but diverge sharply for Y polarization. In the ferric-ferric dimer, absorption is concentrated in states at 2.2–2.4 eV while the Raman response is dominated by states at 2.9–3.1 eV, with the 6th, 7th, 13th, 15th, and 16th excited states strongly enhanced in SXRS relative to absorption. In the mixed-valence ferric-ferrous dimer, the 2nd and 4th excited states are almost exclusively absorption-active, and the 5th, 7th, and 8th states are Raman-active in Y polarization. The authors attribute the contrast to the different molecular properties probed: absorption depends on the transition dipole moment $\mu_{eg}$, while SXRS depends on products of effective transition charge densities $\alpha_{ge}\alpha_{eg}$ that weight different regions of the transition density. They conclude that this intensity difference provides a means to access previously dark states and to selectively excite states by tuning the excitation bandwidth, enabling studies of the ensuing electronic dynamics.
Load-bearing premise
The load-bearing premise is that state-averaged DMRG at bond dimension D=2000 with the CAS(38e,36o) and CAS(39e,36o) active spaces fixes which states are absorption-bright versus Raman-bright, although the paper's own D=3000 check shifts the higher states by -0.28 eV and -0.23 eV and the active-space model is described as qualitative.
Editorial extensions
If this is right
- A pump tuned to the Raman-active band (~2.9–3.1 eV in the ferric-ferric dimer) could selectively populate states that are dark in absorption, allowing time-resolved observation of their dynamics.
- In the mixed-valence dimer, combining absorption and SXRS gives a more complete picture of the d-d manifold than either technique alone, since some states are visible to only one.
- The computed spectra carry assignment information: the first band of the ferric-ferrous dimer is dominated by local ferrous d-d excitations (0.04 eV splitting consistent with Mössbauer estimates), while the second band is dominated by inter-center charge-transfer d-d excitations.
- Because the absorption/Raman contrast appears only for Y polarization, the technique can also serve as a probe of molecular orientation in aligned samples.
Reading between the lines
- The same transition-charge-density contrast likely applies to other multinuclear transition-metal clusters with dense dipole-forbidden manifolds, such as [4Fe-4S] clusters or the manganese-calcium cluster of photosystem II, making the proposed SXRS scheme a general probe of catalytically relevant dark states (editorial inference).
- The long-wavelength approximation drops the linear momentum-transfer term in the TCD expansion; at hard-X-ray photon energies with larger momentum transfer, this term could alter the predicted Y-polarization contrast, and a full multipolar calculation would test whether the complementarity persists (editorial inference).
- The single-molecule orientation assumed here would be degraded by rotational averaging in solution; simulating the rotationally averaged signals would show how much of the absorption/Raman separation survives in isotropic samples (editorial inference).
Signed reviews
Editorial analysis
A structured set of objections, weighed in public.
Referee Report
Summary. The paper computes stimulated X-ray Raman spectroscopy (SXRS) and X-ray absorption signals for a ferric-ferric and a ferric-ferrous [2Fe-2S] dimer, using electronic states obtained from state-averaged DMRG calculations with active spaces CAS(38e,36o) and CAS(39e,36o). The central claim is that, along one incidence axis, absorption and SXRS select different subsets of the dense low-lying d-d manifold, so that the two spectroscopies complement each other and may allow selective excitation of previously dark states. The SXRS signal is derived from a minimal-coupling Hamiltonian in terms of transition charge densities, and the spectra are presented for X, Y, and Z polarized incidence directions.
Significance. If the computed spectra are correct, the paper offers a concrete, falsifiable proposal: direction-dependent SXRS can reveal dark d-d states in iron-sulfur clusters, with predicted energy windows (for example, absorption-active around 2.2-2.4 eV versus Raman-active around 2.9-3.1 eV for the ferric-ferric dimer). The work combines state-of-the-art DMRG with explicit transition charge densities and natural transition orbital analysis, which is a strength: the state assignments are grounded in well-defined ab initio quantities rather than in the spectral features being predicted. The central prediction is specific enough to be tested by future experiments, and the computed state manifold itself is a useful benchmark for the electronic structure of these clusters.
major comments (3)
- [Eq. (9)-(10), 'Simulation of stimulated X-ray Raman (SXRS) signals'] The derivation of the effective transition charge density α_eg is internally inconsistent. The exact spatial phase in the σ(r)A^2 interaction is e^{i q·r} with q = k_s - k_p; a consistent second-order expansion is e^{i q·r} ≈ 1 + i q·r - (q·r)^2/2. Equation (9) instead expands each plane-wave factor separately, obtaining 1 + i q·r + (k_s·r)(k_p·r), and then keeps only the cross term while dropping the two diagonal terms -(k_s·r)^2/2 and -(k_p·r)^2/2. Those diagonal terms are of the same order as the kept term; for collinear, equal-magnitude wavevectors they cancel it identically (since then q = 0 and the exact phase is 1). Thus Eq. (10) is not the long-wavelength limit of the minimal-coupling A^2 interaction, and the SXRS intensities in Eq. (11) — including the predicted separation into absorption-active and Raman-active states — are built on an incorrect expression. The authors should re-derive the signal using the full q-dependent phase or a consistent multipole expansion, and recompute the spectra.
- [Table 1, Fig. 3, and 'Computational methods'] The DMRG convergence check is not sufficient to support the quantitative energy separation that underlies the selective-excitation claim. The paper reports that for states 10-19 the average excitation-energy shift between D=2000 and D=3000 (the latter with only 2 sweeps) is -0.28 eV for the ferric-ferric dimer and -0.23 eV for the ferric-ferrous dimer. The ferric-ferric Raman-active band at 2.9-3.1 eV is separated from the absorption-active band at 2.2-2.4 eV by roughly 0.5 eV, so a 0.28 eV uncertainty could reorder the relevant states; moreover, the intensities entering the direction-dependent spectra are transition-charge-density matrix elements whose D=2000 convergence is not separately assessed. Since the central proposal depends on which specific states are absorption-bright versus Raman-bright, the authors should provide convergence evidence for the transition densities and for the relative intensities, or temper the selective-excitation conclusion accordingly.
- [Eq. (8)-(10), notation] The notation for the field vectors in Eqs. (8)-(10) is confusing and likely dimensionally inconsistent. In Eq. (9) the expansion is in the wavevectors k_si and k_pi, so the second-order term involves (k_si·r)(k_pi·r); in Eq. (10) the same term is written with (ϵ_si·r)(ϵ_pi·r), where ϵ_si and ϵ_pi are described as 'direction of propagation' but earlier in the text ϵ denotes polarization. If ϵ are unit vectors along k, the prefactor must contain the corresponding |k_s||k_p| = ω_s ω_p/c^2 factors; the current prefactor in Eq. (10) does not make this explicit. This should be clarified, since the numerical spectra depend on the definition of α_eg.
minor comments (5)
- [Eq. (9)] The sentence 'The first term vanishes by the definition of the transition charge density' would benefit from an explicit justification: ∫ σ_eg(r) dr = ⟨e|g⟩ = 0 for e ≠ g, and the text should state this rather than relying on an implicit definition.
- [Abstract and Conclusions] The phrase 'theoretically predicted dense low-lying excited states' is used without a citation to the earlier prediction; adding a reference (e.g., Ref. 18) at that point would help the reader connect the claim to the literature.
- [Acknowledgment] There is a typo in the acknowledgment: 'gratefully acknowledges the the support' should read 'gratefully acknowledges the support'.
- [Page 7, 'Computational methods'] The acronym 'MCLT' appears where 'MLCT' (metal-to-ligand charge transfer) is presumably intended; this should be corrected.
- [Fig. 3 caption] The caption states that signals are normalized, so SXRS and absorption strengths cannot be directly compared; however, the text in the results section talks about 'signal enhancements' in SXRS relative to absorption. It would be helpful to state explicitly whether the claimed enhancements are relative intensities within the normalized spectra or absolute cross-section statements.
Circularity Check
No significant circularity: the SXRS and absorption signals are computed from ab initio DMRG states and transition charge densities, and the dark/bright-state distinction is an emergent spectral feature rather than an input or fitted target.
full rationale
The paper's central claim is that stimulated X-ray Raman and absorption signals differ for specific low-lying states of [2Fe-2S] dimers, enabling access to states that are dark in absorption. The inputs to the signal calculation are the DMRG ground and excited states, transition charge densities, transition dipoles, vertical excitation energies, and a uniform dephasing width Gamma_eg = 0.014 eV. None of these are fitted to the experimental or target intensity ordering; the absorption-active versus Raman-active distinction emerges from the computed matrix elements. The paper does not tune any parameter to reproduce a desired Raman/absorption pattern, and it does not define the excited states in terms of the spectral features it claims to predict. The citation of previous work (Ref. 18) for the existence of a dense d-d manifold is not load-bearing in a circular way here: the present paper recomputes the states with an enlarged active space using state-averaged DMRG and explicitly notes agreement with the earlier results. This is independent computational evidence, not an unverified self-citation chain. The simulated spectra being generated from the same states used to interpret them is a modeling consistency, not a circular dependence. Two genuine limitations are stated in the paper itself: the DMRG convergence check at D=3000 with only two sweeps gives shifts of -0.28 eV and -0.23 eV for states 10-19, and the active-space description is described as qualitative. These are numerical accuracy concerns that could affect the predicted intensities or energy separations, but they do not make the derivation circular: the target result is still a function of the ab initio input states, not an input itself. Similarly, the expansion leading to Eq. (10) involves an approximation that a skeptical reader may challenge on mathematical grounds, but an algebraic inconsistency or an unjustified term-neglect is a correctness or validity issue, not a circularity in the sense of the result reducing by construction to its own inputs. No circular step of any of the enumerated kinds can be exhibited with a quote and a specific reduction, so the appropriate score is 0.
Assumptions & free parameters
free parameters (1)
- Dephasing rate Γ_eg =
0.014 eV
assumptions (3)
- domain assumption The SXRS signal expression (Eq. 11) derived from the minimal-coupling Hamiltonian with the linear momentum-transfer term neglected (Eq. 10)
- domain assumption The chosen active spaces CAS(38e,36o) and CAS(39e,36o) capture the states contributing to the low-energy spectra
- domain assumption The oriented single-molecule spectrum is representative
Cite this review
Pith. "Pith review of Stimulated X-ray Raman and Absorption Spectroscopy of Iron-Sulfur Dimers." pith.science (2026). https://pith.science/paper/RSGOMVCA
@misc{pith2026190805802,
  author       = {Pith},
  title        = {Pith review of: Stimulated X-ray Raman and Absorption Spectroscopy of Iron-Sulfur Dimers},
  year         = {2026},
  howpublished = {\url{https://pith.science/paper/RSGOMVCA}},
  note         = {Machine review of arXiv:1908.05802}
}
read the original abstract
Iron-sulfur complexes play an important role in biological processes such as metabolic electron transport. A detailed understanding of the mechanism of long range electron transfer requires knowledge of the electronic structure of the complexes, which has traditionally been challenging to obtain, either by theory or by experiment, but the situation has begun to change with advances in quantum chemical methods and intense free electron laser light sources. We compute the signals from stimulated X-ray Raman spectroscopy (SXRS) and absorption spectroscopy of homovalent and mixed-valence [2Fe-2S] complexes, using the {\it ab initio} density matrix renormalization group (DMRG) algorithm. The simulated spectra show clear signatures of the theoretically predicted dense low-lying excited states within the d-d manifold. Furthermore, the difference in signal intensity between the absorption-active and Raman-active states provides a potential mechanism to selectively excite states by a proper tuning of the excitation pump, to access the electronic dynamics within this manifold.
Figures


Reference graph
Works this paper leans on
- [1]
- [2]
- [3]
-
[4]
Chemical reviews 2015, 115, 11191--11238
Blumberger, J. Chemical reviews 2015, 115, 11191--11238
work page 2015
-
[5]
Journal of Biological Chemistry 1966, 241, 253--253
Palmer, G.; Sands, R. Journal of Biological Chemistry 1966, 241, 253--253
work page 1966
-
[6]
Brintzinger, H.; Palmer, G.; Sands, R. H. Proceedings of the National Academy of Sciences of the United States of America 1966, 55, 397
work page 1966
-
[7]
Dunham, W. R.; Bearden, A. J.; Salmeen, I. T.; Palmer, G.; Sands, R. H.; Orme-Johnson, W.; Beinert, H. Biochimica et Biophysica Acta (BBA)-Bioenergetics 1971, 253, 134--152
work page 1971
-
[8]
Dunham, W. R.; Palmer, G.; Sands, R. H.; Bearden, A. J. Biochimica et Biophysica Acta (BBA)-Bioenergetics 1971, 253, 373--384
work page 1971
Show all 45 references
-
[9]
B.; Holm, R.; Ibers, J
Mayerle, J.; Frankel, R. B.; Holm, R.; Ibers, J. A.; Phillips, W.; Weiher, J. Proceedings of the National Academy of Sciences 1973, 70, 2429--2433
1973
-
[10]
E.; DePamphilis, B.; Ibers, J
Mayerle, J.; Denmark, S. E.; DePamphilis, B.; Ibers, J. A.; Holm, R. Journal of the American Chemical Society 1975, 97, 1032--1045
1975
-
[11]
Venkateswara Rao, P.; Holm, R. Chem. Rev. 2004, 104, 527--560
2004
-
[12]
The Journal of Chemical Physics 1983, 79, 1766--1775
Girerd, J.-J. The Journal of Chemical Physics 1983, 79, 1766--1775
1983
-
[13]
Noodleman, L.; Baerends, E. J. Journal of the American Chemical Society 1984, 106, 2316--2327
1984
-
[14]
The Journal of Chemical Physics 1981, 74, 5737--5743
Noodleman, L. The Journal of Chemical Physics 1981, 74, 5737--5743
1981
-
[15]
G.; Osborne, J
Noodleman, L.; Norman Jr, J. G.; Osborne, J. H.; Aizman, A.; Case, D. A. J. Am. Chem. Soc. 1985, 107, 3418--3426
1985
-
[16]
Yamaguchi, K.; Fueno, T.; Ueyama, N.; Nakamura, A.; Ozaki, M. Chem. Phys. Lett. 1989, 164, 210--216
1989
-
[17]
Noodleman, L.; Lovell, T.; Liu, T.; Himo, F.; Torres, R. A. Current opinion in chemical biology 2002, 6, 259--273
2002
-
[18]
Sharma, S.; Sivalingam, K.; Neese, F.; Chan, G. K.-L. Nat. Chem. 2014, 6, 927--933
2014
-
[19]
G.; DeBeer, S.; Neese, F
Chilkuri, V. G.; DeBeer, S.; Neese, F. Inorganic Chemistry 2019,
2019
-
[20]
R.; Martin, R
White, S. R.; Martin, R. L. J. Chem. Phys. 1999, 110, 4127--4130
1999
-
[21]
K.-L.; Head-Gordon, M
Chan, G. K.-L.; Head-Gordon, M. J. Chem. Phys. 2002, 116, 4462--4476
2002
-
[22]
O .; R \
Legeza, \"O .; R \"o der, J.; Hess, B. A. Physical Review B 2003, 67, 125114
2003
-
[23]
A.; Reiher, M
Moritz, G.; Hess, B. A.; Reiher, M. The Journal of chemical physics 2005, 122, 024107
2005
-
[24]
Sharma, S.; Chan, G. K.-L. J. Chem. Phys. 2012, 136, 124121
2012
-
[25]
E.; Hahn, A
Van Kuiken, B. E.; Hahn, A. W.; Nayyar, B.; Schiewer, C. E.; Lee, S. C.; Meyer, F.; Weyherm \"u ller, T.; Nicolaou, A.; Cui, Y.-T.; Miyawaki, J.; Harada, Y.; DeBeer, S. Inorganic chemistry 2018, 57, 7355--7361
2018
-
[26]
A.; Palmer, G.; Fee, J
Eaton, W. A.; Palmer, G.; Fee, J. A.; Kimura, T.; Lovenberg, W. Proceedings of the National Academy of Sciences 1971, 68, 3015--3020
1971
-
[27]
Y.; Saurabh, P.; Mukamel, S
Chernyak, V. Y.; Saurabh, P.; Mukamel, S. The Journal of Chemical Physics 2015, 143, 164107
2015
-
[28]
W.; Hasegawa, H
Anderson, P. W.; Hasegawa, H. Phys. Rev. 1955, 100, 675
1955
-
[29]
Roos, B
Veryazov, V.; Malmqvist, P. .; Roos, B. O. Int. J. Quantum Chem. 2011, 111, 3329--3338
2011
-
[30]
J.; Truhlar, D
Presti, D.; Stoneburner, S. J.; Truhlar, D. G.; Gagliardi, L. The Journal of Physical Chemistry C 2019,
2019
-
[31]
Li, Z.; Guo, S.; Sun, Q.; Chan, G. K. arXiv preprint arXiv:1810.10196 2018,
2018 arXiv
-
[32]
Pipek, J.; Mezey, P. G. J. Chem. Phys. 1989, 90, 4916--4926
1989
-
[33]
Becke, A. D. Phys. Rev. A 1988, 38, 3098
1988
-
[34]
Perdew, J. P. Phys. Rev. B 1986, 33, 8822
1986
-
[35]
Liu, W. Mol. Phys. 2010, 108, 1679--1706
2010
-
[36]
ChemPhysChem 2011, 12, 3077--3094
Saue, T. ChemPhysChem 2011, 12, 3077--3094
2011
-
[37]
Peng, D.; Reiher, M. Theor. Chem. Acc. 2012, 131, 1081
2012
-
[38]
The Journal of chemical physics 2012, 137, 154114
Li, Z.; Xiao, Y.; Liu, W. The Journal of chemical physics 2012, 137, 154114
2012
-
[39]
B.; Peterson, K
Balabanov, N. B.; Peterson, K. A. The Journal of chemical physics 2005, 123, 064107
2005
-
[40]
C.; Blunt, N
Sun, Q.; Berkelbach, T. C.; Blunt, N. S.; Booth, G. H.; Guo, S.; Li, Z.; Liu, J.; McClain, J. D.; Sayfutyarova, E. R.; Sharma, S.; Wouters, S.; Chan, G. K. Wiley Interdiscip. Rev. Comput. Mol. Sci. 2017,
2017
-
[41]
V.; Krylov, A
Matsika, S.; Feng, X.; Luzanov, A. V.; Krylov, A. I. The Journal of Physical Chemistry A 2014, 118, 11943--11955
2014
-
[42]
Hu, W.; Chan, G. K.-L. Journal of chemical theory and computation 2015, 11, 3000--3009
2015
-
[43]
The journal of physical chemistry letters 2017, 8, 2175--2181
Ren, J.; Peng, Q.; Zhang, X.; Yi, Y.; Shuai, Z. The journal of physical chemistry letters 2017, 8, 2175--2181
2017
-
[44]
Martin, R. L. The Journal of chemical physics 2003, 118, 4775--4777
2003
-
[45]
Veryazov, V
Malmqvist, P. .; Veryazov, V. Molecular Physics 2012, 110, 2455--2464 mcitethebibliography tocentry [width=0.9 ] FIG/TOC.jpg \\ tocentry document
2012
Reviewed August 14, 2026 · model on record in the stance chip above.
Discussion (0). Continue with ORCID to comment.