REVIEW 5 major objections 5 minor 88 references
Feature Learning to Automatically Assess Radiographic Knee Osteoarthritis Severity
T0 review · 5 major / 5 minor · reviewed 2026-08-14 · deepseek-v4-flash
Pith's one-line read This paper claims that convolutional neural networks can automate knee osteoarthritis grading from X-rays, with a jointly trained classifier and regressor reaching 64.6% multi-class accuracy and a mean-squared error of 0.480, on par with…
desk verdict A competent consolidation of prior knee-OA deep learning work with useful practical comparisons, but the central state-of-the-art claim is weakened by an omitted cited baseline and missing error bars. read the letter →
The pith
A machine-rendered reading of the paper's core claim, the machinery that carries it, and where it could break.
The reading
What carries the argument
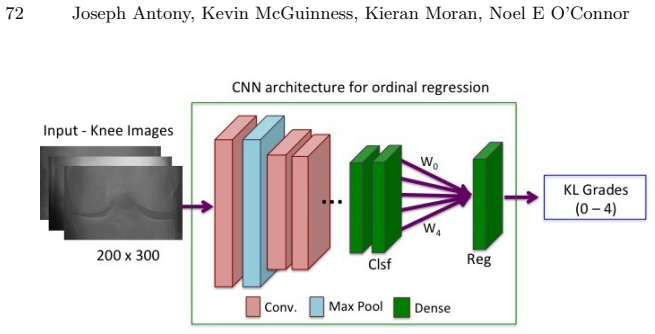
The central mechanism is multi-objective convolutional learning: a single lightweight CNN of about 2.9 million parameters, built from blocks of cascaded 3x3 convolutions, batch normalization, and max pooling, ends in a shared fully connected layer that branches into a softmax head for the five KL classes and a linear head for a continuous severity value. The loss is a weighted sum of categorical cross-entropy and mean-squared error, with the ratio tuned to 0.5; cross-entropy preserves discrete grade information while MSE injects ordering and distance information between grades. The ordinal-regression variant replaces the regression branch with a dot product of the softmax probabilities against fixed weights [0,1,2,3,4], so the regression target is the expected grade under the class distribution, and this is the mechanism that produces the paper's lowest reported MSE.
What would settle it
Take a test set of OAI or MOST radiographs that also have OARSI sub-scores for joint space narrowing and osteophytes, and compare the ordinal-regression predictions against the measured sub-scores: if a model whose grade weights are proportional to measured joint space width achieves lower MSE than the fixed [0,1,2,3,4] model, the equidistant-spacing assumption behind the paper's continuous claim is false.
Extended reading notes
Core claim
On the paper's own terms, the discovery is that feature learning with CNNs, rather than handcrafted image features, is the effective route to fine-grained knee OA quantification, and that the best quantification comes from training the network to predict KL grade as both a discrete class and a continuous value at once. The jointly trained CNN predicts a discrete grade through a softmax head and a continuous value through a linear regression head, with the loss a weighted sum of categorical cross-entropy and mean-squared error; it reaches 64.6% multi-class accuracy and MSE 0.507 on the regression head. A variant that treats the softmax head as a hidden layer and multiplies its probabilities by fixed weights [0,1,2,3,4], the ordinal-regression approach, reaches MSE 0.480 while keeping classification accuracy near 64.3%, which the paper reports as the best continuous-scale quantification. The claim is that this accuracy is on par with the reliability of expert radiologic readings, making the automatic system a credible replacement for manual KL scoring.
Load-bearing premise
The central claim assumes KL grades 0 through 4 are equally spaced points on a continuous severity scale; the paper itself notes they are not equidistant, so the reported continuous MSE depends on that spacing.
Editorial extensions
If this is right
- An end-to-end pipeline using a fully convolutional network for knee localization plus the jointly trained CNN can produce KL grades and continuous severity scores directly from raw X-rays, removing manual ROI cropping.
- The localizer alone detects knee joints at 100% accuracy for Jaccard index >= 0.5 over the combined OAI-MOST test set, so downstream grading need not depend on hand-drawn regions.
- Training a CNN from scratch outperforms fine-tuning ImageNet-pretrained networks on this task (61.8% versus 57.6% accuracy), suggesting that domain-specific features learned on medical images outweigh transfer from natural images when enough data are available.
- Joint training with two losses improves both class accuracy and regression MSE over training either head alone, making multi-objective convolutional learning a practical recipe for progressive-disease grading.
- The system's accuracy is on par with radiologic reliability readings, implying automatic KL grading could serve as a second reader or initial screening tool in clinical workflows.
Reading between the lines
- If KL grades are not equidistant, as the paper itself notes, the fixed weights [0,1,2,3,4] impose a spacing the data may not support; a natural extension is to learn those weights from joint-space-width or osteophyte measurements instead of fixing them.
- The same weighted-loss recipe should transfer to other ordinal medical scales, such as Alzheimer's or cancer staging, where the disease is progressive but labels are discrete; the paper sketches this direction but does not test it.
- Because the paper reports only MSE against integer KL labels, a stronger test of continuous quantification would compare predictions to OARSI sub-scores such as joint space narrowing and osteophytes; if those correlations are high, the continuous claim is independently supported.
- The 64.6% accuracy may be partly dataset-specific: OAI and MOST share imaging protocols and reading standards, so a test on an external multi-center radiograph collection would reveal whether the learned features generalize.
Signed reviews
Editorial analysis
A structured set of objections, weighed in public.
Referee Report
Summary. This manuscript, written in thesis-chapter style, proposes and evaluates convolutional-neural-network methods for automatic knee osteoarthritis severity grading from X-ray images. The contributions include an FCN for knee joint localization, CNN classifiers and regressors trained from scratch, a jointly trained multi-objective network combining cross-entropy and MSE losses, and an ordinal regression variant with fixed grade weights. Experiments use the public OAI and MOST datasets; the final comparison (Table 43) reports that the jointly trained CNN reaches 64.6% multi-class accuracy and the ordinal regression reaches MSE 0.480, outperforming the WNDCHRM baseline and a fine-tuned BVLC CaffeNet.
Significance. If the results are reproducible and the comparisons are made on a common benchmark, the paper would provide a useful demonstration that multi-objective training and ordinal regression improve automatic KL grading over handcrafted-feature baselines. Strengths include the systematic progression from handcrafted features to transfer learning to from-scratch training, the use of two public datasets, the explicit error analysis, and the description of an end-to-end pipeline. The central claim of outperforming existing approaches is not currently established, however, because a published baseline (Tiulpin et al. [44]) cited in the paper itself reports higher accuracy, and because no variance or significance information is provided.
major comments (5)
- [Section 2.2.2 / Table 43] The paper's claim to 'outperform existing approaches' (abstract and Section 6) is not supported by the comparisons in Table 43. Section 2.2.2 cites Tiulpin et al. [44] with 66.7% average multi-class accuracy on the entire OAI dataset, which is higher than the 64.6% reported here for the jointly trained CNN. Table 43 only includes WNDCHRM and a fine-tuned BVLC CaffeNet, and no explicit comparison to [44] is provided. Please either run the proposed method and the Tiulpin et al. method on the same evaluation protocol, or revise the claims to state superiority only over the methods actually tested.
- [Section 5.2.6 / Table 43] The ordinal regression results are reported inconsistently. The text (Section 5.2.6, Results) states that after rounding the ordinal output, classification accuracy is 61.8% and MSE is 0.504, while the classification branch itself reaches 64.3%. Table 43 lists 'Ordinal Regression 64.3% 0.480', which does not match either quantity as described. Clarify which outputs and rounding procedures the table entries refer to, and correct the numbers in the abstract and conclusion if needed.
- [Section 5.2.4/5.2.5 (Tables 39-43)] The key accuracy and MSE differences (e.g., 61.8% vs 64.6%, and regression MSE 0.574 vs 0.507) are reported for single training runs, with no confidence intervals, repeated-seed statistics, or significance tests. Without such information, the improvement from joint training and ordinal regression cannot be distinguished from random variation. Please provide means and standard deviations over multiple runs or another appropriate statistical assessment.
- [Section 5.2.5 Discussion / 5.2.6] The continuous-scale quantification claim depends on treating KL grades 0-4 as equidistant integer targets (fixed weights [0,1,2,3,4] in the ordinal regression and integer labels in MSE). The paper itself notes that KL grades are not equidistant, citing references [22,81,25,24,82]. The reported MSE therefore measures deviation on this arbitrary integer scale, not on a validated continuous severity scale. Please either validate the scale (e.g., against quantitative joint-space-width measurements or OARSI grades) or clearly limit the continuous-scale claim to a modeling choice.
- [Section 5.3] The proposed end-to-end diagnostic system is described as combining the FCN localization and the jointly trained CNN, but no experiments evaluate the full pipeline. The results in Table 43 appear to be obtained from cropped knee images, and it is not stated whether these crops come from automatic localization or manual annotation (Section 5.2.4 describes both but Table 43 does not specify). The paper should report end-to-end performance with automatic localization, or explicitly state that the system was not evaluated as a whole.
minor comments (5)
- [Throughout (architectures)] There are inconsistent network descriptions; for example, Table 33 lists conv4-1 with 128 kernels but an output shape of 96, and several architecture tables use inconsistent naming conventions (e.g., 'Conv2 1' vs 'conv2-1').
- [Throughout] The manuscript uses 'WNDCHARM' and 'WNDCHRM' interchangeably (e.g., Section 5.1.1 vs Table 31); please standardize the spelling.
- [Section 2.2.1] There are typos such as 'purpotedly' and non-standard ligatures in 'off-the-shelf'; a careful proofread is needed.
- [Section 5.2.5] The opening of Section 5.2.5 refers to 'Section 5.4.5' instead of 'Section 5.2.5'.
- [Figure 51] Figure 51 is captioned 'The CNN configuration for ordinal regression' but appears to be a plot of test accuracy over epochs; the caption and the figure content should be matched.
Circularity Check
No significant circularity: the CNN and ordinal-regression results are empirical, evaluated on held-out public data; self-citations are contextual and not load-bearing.
full rationale
The paper's central claims are empirical comparisons of CNN training variants on fixed public OAI/MOST data splits. The jointly trained CNN and ordinal regression outputs are produced by standard forward passes, with no parameter fitted to the test labels; the loss weight 0.5 is selected by validation and the same splits are maintained for all compared methods. The 'continuous scale' output is explicitly acknowledged as a modeling limitation: no continuous ground-truth exists, discrete KL labels are used as regression targets, and the paper notes that KL categories are not equidistant (Section 5.2.5 Discussion). This is a stated assumption about the label space, not a circular derivation. The fixed weights [0,1,2,3,4] in ordinal regression are a deterministic design choice, and the lower MSE relative to rounded classification is partly a mathematical property of the mean; however, the paper's main comparisons against single-output regression and classification are empirical and not forced by construction. Self-citations [45,58,86,88] describe the authors' earlier pipelines or related work; none supplies an unverified uniqueness theorem or a fitted parameter that the present claims reduce to. The omission of Tiulpin's published 66.7% accuracy baseline from Table 43 is a comparison/completeness concern, not circularity. Hence there is no significant circularity.
Assumptions & free parameters
free parameters (6)
- loss_weight_lambda =
0.5
- l2_regularization_penalty =
0.01
- dropout_ratios =
0.25, 0.3, 0.5
- input_image_size =
200x300
- roi_crop_size =
640x560
- ordinal_grade_weights =
[0,1,2,3,4]
assumptions (5)
- domain assumption KL grades are a valid ordinal ground truth for knee OA severity
- ad hoc to paper Discrete KL grades can be used as regression targets to represent a continuous severity scale
- domain assumption OAI and MOST images can be resized and combined without loss of diagnostic information
- domain assumption Manual annotations of knee joint centers and ROIs are accurate enough to serve as ground truth for FCN training
- domain assumption The FCN localization errors do not substantially affect downstream classification
Cite this review
Pith. "Pith review of Feature Learning to Automatically Assess Radiographic Knee Osteoarthritis Severity." pith.science (2026). https://pith.science/paper/JD7ANNZC
@misc{pith2026190808840,
  author       = {Pith},
  title        = {Pith review of: Feature Learning to Automatically Assess Radiographic Knee Osteoarthritis Severity},
  year         = {2026},
  howpublished = {\url{https://pith.science/paper/JD7ANNZC}},
  note         = {Machine review of arXiv:1908.08840}
}
read the original abstract
This chapter presents the investigations and the results of feature learning using convolutional neural networks to automatically assess knee osteoarthritis (OA) severity and the associated clinical and diagnostic features of knee OA from X-ray images. Also, this chapter demonstrates that feature learning in a supervised manner is more effective than using conventional handcrafted features for automatic detection of knee joints and fine-grained knee OA image classification. In the general machine learning approach to automatically assess knee OA severity, the first step is to localize the region of interest that is to detect and extract the knee joint regions from the radiographs, and the next step is to classify the localized knee joints based on a radiographic classification scheme such as Kellgren and Lawrence grades. First, the existing approaches for detecting (or localizing) the knee joint regions based on handcrafted features are reviewed and outlined. Next, three new approaches are introduced: 1) to automatically detect the knee joint region using a fully convolutional network, 2) to automatically assess the radiographic knee OA using CNNs trained from scratch for classification and regression of knee joint images to predict KL grades in ordinal and continuous scales, and 3) to quantify the knee OA severity optimizing a weighted ratio of two loss functions: categorical cross entropy and mean-squared error using multi-objective convolutional learning and ordinal regression. Two public datasets: the OAI and the MOST are used to evaluate the approaches with promising results that outperform existing approaches. In summary, this work primarily contributes to the field of automated methods for localization (automatic detection) and quantification (image classification) of radiographic knee OA.
Figures


Figures from the paper (49 more)






Reference graph
Works this paper leans on
-
[44]
Scientific reports 8(1) (2018) 1727
Tiulpin, A., Thevenot, J., Rahtu, E., Lehenkari, P., Saarakkala, S.: Automatic knee osteoarthritis diagnosis from plain radiographs: a deep learning-based approach. Scientific reports 8(1) (2018) 1727
work page 2018
-
[1]
IEEE Transactions on Biomedical Engineering 56(2) (2009)
Shamir, L., Ling, S.M., Scott Jr, W.W., Bos, A., Orlov, N., Macura, T.J., Eckley, D.M., Ferrucci, L., Goldberg, I.G.: Knee X-ray image analysis method for automated detection of osteoarthritis. IEEE Transactions on Biomedical Engineering 56(2) (2009)
2009
-
[2]
In: International Conference on Medical Image Computing and Computer-Assisted Intervention, Springer (2015) 127–134
Thomson, J., ONeill, T., Felson, D., Cootes, T.: Automated shape and texture analysis for detection of osteoarthritis from radiographs of the knee. In: International Conference on Medical Image Computing and Computer-Assisted Intervention, Springer (2015) 127–134
2015
-
[3]
Osteoarthritis and Cartilage 17(10) (2009) 1307–1312 Feature Learning to Assess Knee OA Severity 81
Shamir, L., Ling, S.M., Scott, W., Hochberg, M., Ferrucci, L., Goldberg, I.G.: Early detection of radiographic knee osteoarthritis using computer-aided analysis. Osteoarthritis and Cartilage 17(10) (2009) 1307–1312 Feature Learning to Assess Knee OA Severity 81
2009
-
[4]
Source code for biology and medicine 3(1) (2008) 13
Shamir, L., Orlov, N., Eckley, D.M., Macura, T., Johnston, J., Goldberg, I.G.: Wndchrm–an open source utility for biological image analysis. Source code for biology and medicine 3(1) (2008) 13
2008
-
[5]
Pattern recognition letters 29(11) (2008) 1684–1693
Orlov, N., Shamir, L., Macura, T., Johnston, J., Eckley, D.M., Goldberg, I.G.: WND-CHARM: Multi-purpose image classification using compound image trans- forms. Pattern recognition letters 29(11) (2008) 1684–1693
2008
-
[6]
Osteoarthritis and Cartilage 16(11) (2008) 1300–1306
Oka, H., Muraki, S., Akune, T., Mabuchi, A., Suzuki, T., Yoshida, H., Yamamoto, S., Nakamura, K., Yoshimura, N., Kawaguchi, H.: Fully automatic quantification of knee osteoarthritis severity on plain radiographs. Osteoarthritis and Cartilage 16(11) (2008) 1300–1306
2008
-
[7]
European journal of radiology 82(1) (2013) 112–117
Park, H.J., Kim, S.S., Lee, S.Y., Park, N.H., Park, J.Y., Choi, Y.J., Jeon, H.J.: A practical MRI grading system for osteoarthritis of the knee: association with Kellgren–Lawrence radiographic scores. European journal of radiology 82(1) (2013) 112–117
2013
Show all 88 references
-
[8]
PhD thesis, Stanford University (2010)
Lee, H.: Unsupervised feature learning via sparse hierarchical representations. PhD thesis, Stanford University (2010)
2010
-
[9]
PhD Thesis, Stanford University (2013)
Le, Q.V.: Scalable feature learning. PhD Thesis, Stanford University (2013)
2013
-
[10]
PhD Thesis, University of Washington (2013)
Yang, S.: Feature Engineering in Fine-Grained Image Classification. PhD Thesis, University of Washington (2013)
2013
-
[11]
PhD Thesis, Imperial College London (2013)
Donoghue, C.R.: Analysis of MRI for Knee Osteoarthritis using Machine Learning. PhD Thesis, Imperial College London (2013)
2013
-
[12]
Osteoarthritis and Cartilage 42(1) (2017) 60–88
Litjens, G., Kooi, T., Bejnordi, B.E., Setio, A.A.A., Ciompi, F., Ghafoorian, M., van der Laak, J.A., van Ginneken, B., S´ anchez, C.I.: A survey on deep learning in medical image analysis. Osteoarthritis and Cartilage 42(1) (2017) 60–88
2017
-
[13]
Annual Review of Biomedical Engineering (0) (2017)
Shen, D., Wu, G., Suk, H.I.: Deep learning in medical image analysis. Annual Review of Biomedical Engineering (0) (2017)
2017
-
[14]
In: Advances in neural information processing systems
Krizhevsky, A., Sutskever, I., Hinton, G.E.: Imagenet classification with deep convolutional neural networks. In: Advances in neural information processing systems. (2012) 1097–1105
2012
-
[15]
Tajbakhsh, N., Shin, J.Y., Gurudu, S.R., Hurst, R.T., Kendall, C.B., Gotway, M.B., Liang, J.: Convolutional neural networks for medical image analysis: full training or fine tuning? IEEE transactions on medical imaging 35(5) (2016) 1299– 1312
2016
-
[16]
In: International conference on medical image computing and computer- assisted intervention, Springer (2013) 246–253
Prasoon, A., Petersen, K., Igel, C., Lauze, F., Dam, E., Nielsen, M.: Deep feature learning for knee cartilage segmentation using a triplanar convolutional neural network. In: International conference on medical image computing and computer- assisted intervention, Springer (20...
2013
-
[17]
Medical image analysis 35 (2017) 18–31
Havaei, M., Davy, A., Warde-Farley, D., Biard, A., Courville, A., Bengio, Y., Pal, C., Jodoin, P.M., Larochelle, H.: Brain tumor segmentation with deep neural networks. Medical image analysis 35 (2017) 18–31
2017
-
[18]
NeuroImage 108 (2015) 214–224
Zhang, W., Li, R., Deng, H., Wang, L., Lin, W., Ji, S., Shen, D.: Deep convolutional neural networks for multi-modality isointense infant brain image segmentation. NeuroImage 108 (2015) 214–224
2015
-
[19]
In: SPIE Medical Imaging, International Society for Optics and Photonics (2015) 94131G–94131G
Roth, H.R., Farag, A., Lu, L., Turkbey, E.B., Summers, R.M.: Deep convolutional networks for pancreas segmentation in ct imaging. In: SPIE Medical Imaging, International Society for Optics and Photonics (2015) 94131G–94131G
2015
-
[20]
In: Advances in neural information processing systems
Ciresan, D., Giusti, A., Gambardella, L.M., Schmidhuber, J.: Deep neural networks segment neuronal membranes in electron microscopy images. In: Advances in neural information processing systems. (2012) 2843–2851 82 Joseph Antony, Kevin McGuinness, Kieran Moran, Noel E O’Connor
2012
-
[21]
Osteoarthritis and Cartilage 16(2) (2008) 234–243
Marijnissen, A.C., Vincken, K.L., Vos, P.A., Saris, D., Viergever, M., Bijlsma, J., Bartels, L., Lafeber, F.: Knee images digital analysis (kida): a novel method to quantify individual radiographic features of knee osteoarthritis in detail. Osteoarthritis and Cartilage 16(2) (...
2008
-
[22]
Osteoarthritis and Cartilage 5(4) (1997) 241–250
Felson, D.T., McAlindon, T.E., Anderson, J.J., Weissman, B.W., Aliabadi, P., Evans, S., Levy, D., LaValley, M.P.: Defining radiographic osteoarthritis for the whole knee. Osteoarthritis and Cartilage 5(4) (1997) 241–250
1997
-
[23]
Bone 51(2) (2012) 278–288
Braun, H.J., Gold, G.E.: Diagnosis of osteoarthritis: Imaging. Bone 51(2) (2012) 278–288
2012
-
[24]
Osteoarthritis and Cartilage 16(8) (2008) 873–882
Emrani, P.S., Katz, J.N., Kessler, C.L., Reichmann, W.M., Wright, E.A., McAlin- don, T.E., Losina, E.: Joint space narrowing and kellgren–lawrence progression in knee osteoarthritis: an analytic literature synthesis. Osteoarthritis and Cartilage 16(8) (2008) 873–882
2008
-
[25]
Hart, D., Spector, T.: Kellgren & lawrence grade 1 osteophytes in the kneedoubtful or definite? Osteoarthritis and cartilage 11(2) (2003) 149–150
2003
-
[26]
IOSR Journal of Electronics and Communication Engineering (IOSR-JECE) 9(5) (2014) 23–28
Shaikh, H., Panbude, J., Joshi, A.: Image segmentation techniques and its appli- cations for knee joints: A survey. IOSR Journal of Electronics and Communication Engineering (IOSR-JECE) 9(5) (2014) 23–28
2014
-
[27]
In: Biomedical and Pharmaceutical Engineering, 2006
Sun, Y., Teo, E., Zhang, Q.: Discussions of knee joint segmentation. In: Biomedical and Pharmaceutical Engineering, 2006. ICBPE 2006. International Conference on, IEEE (2006)
2006
-
[28]
International Journal of Computer Applications 145(1) (2016)
Gornale, S.S., Patravali, P.U., Manza, R.R.: Detection of osteoarthritis using knee x-ray image analyses: A machine vision based approach. International Journal of Computer Applications 145(1) (2016)
2016
-
[29]
In: Scandinavian Conference on Image Analysis, Springer (2017) 290–301
Tiulpin, A., Thevenot, J., Rahtu, E., Saarakkala, S.: A novel method for automatic localization of joint area on knee plain radiographs. In: Scandinavian Conference on Image Analysis, Springer (2017) 290–301
2017
-
[30]
Magnetic resonance imaging 17(7) (1999) 1033–1042
Stammberger, T., Eckstein, F., Michaelis, M., Englmeier, K.H., Reiser, M.: Interobserver reproducibility of quantitative cartilage measurements: comparison of b-spline snakes and manual segmentation. Magnetic resonance imaging 17(7) (1999) 1033–1042
1999
-
[31]
Osteoarthritis and cartilage 7(1) (1999) 95–109
Cohen, Z.A., Mccarthy, D.M., Kwak, S.D., Legrand, P., Fogarasi, F., Ciaccio, E.J., Ateshian, G.A.: Knee cartilage topography, thickness, and contact areas from mri: in-vitro calibration and in-vivo measurements. Osteoarthritis and cartilage 7(1) (1999) 95–109
1999
-
[32]
Osteoarthritis and cartilage 22(10) (2014) 1724–1731
Hirvasniemi, J., Thevenot, J., Immonen, V., Liikavainio, T., Pulkkinen, P., J¨ ams¨ a, T., Arokoski, J., Saarakkala, S.: Quantification of differences in bone texture from plain radiographs in knees with and without osteoarthritis. Osteoarthritis and cartilage 22(10) (2014) 1724–1731
2014
-
[33]
Medical physics 37(5) (2010) 2030–2042
Woloszynski, T., Podsiadlo, P., Stachowiak, G., Kurzynski, M.: A signature dissimilarity measure for trabecular bone texture in knee radiographs. Medical physics 37(5) (2010) 2030–2042
2010
-
[34]
Annals of the BMVA 2013(7) (2013) 1–22
Zhao, F., Xie, X.: An overview of interactive medical image segmentation. Annals of the BMVA 2013(7) (2013) 1–22
2013
-
[35]
PhD thesis, ETH Zurich (2005)
Pirnog, C.D.: Articular cartilage segmentation and tracking in sequential MR images of the knee. PhD thesis, ETH Zurich (2005)
2005
-
[36]
Medical physics 27(3) (2000) 580–591
Duryea, J., Li, J., Peterfy, C., Gordon, C., Genant, H.: Trainable rule-based algorithm for the measurement of joint space width in digital radiographic images of the knee. Medical physics 27(3) (2000) 580–591
2000
-
[37]
Medical physics 35(5) (2008) 1870–1883 Feature Learning to Assess Knee OA Severity 83
Podsiadlo, P., Wolski, M., Stachowiak, G.: Automated selection of trabecular bone regions in knee radiographs. Medical physics 35(5) (2008) 1870–1883 Feature Learning to Assess Knee OA Severity 83
2008
-
[38]
IPTEK The Journal for Technology and Science 22(3) (2011)
Anifah, L., Purnama, I.K.E., Hariadi, M., Purnomo, M.H.: Automatic segmenta- tion of impaired joint space area for osteoarthritis knee on x-ray image using gabor filter based morphology process. IPTEK The Journal for Technology and Science 22(3) (2011)
2011
-
[39]
In: Innova- tive Computing, Information and Control, 2006
Lee, H.C., Lee, J.S., Lin, M.C.J., Wu, C.H., Sun, Y.N.: Automatic assessment of knee osteoarthritis parameters from two-dimensional x-ray image. In: Innova- tive Computing, Information and Control, 2006. ICICIC’06. First International Conference on. Volume 2., IEEE (2006) 673–676
2006
-
[40]
Asian Journal of Scientific Research 6(4) (2013) 805
Subramoniam, M., Rajini, V.: Local binary pattern approach to the classification of osteoarthritis in knee x-ray images. Asian Journal of Scientific Research 6(4) (2013) 805
2013
-
[41]
Biomedical Research (2015)
Subramoniam, B., et al.: A non-invasive computer aided diagnosis of osteoarthritis from digital x-ray images. Biomedical Research (2015)
2015
-
[42]
International Journal of Engineering and Techniques 1(3) (2015)
Deokar, D.D., Patil, C.G.: Effective feature extraction based automatic knee osteoarthritis detection and classification using neural network. International Journal of Engineering and Techniques 1(3) (2015)
2015
-
[43]
PloS one 11(2) (2016) e0148724
Yoo, T.K., Kim, D.W., Choi, S.B., Park, J.S.: Simple scoring system and artificial neural network for knee osteoarthritis risk prediction: A cross-sectional study. PloS one 11(2) (2016) e0148724
2016
-
[45]
In: Pattern Recognition (ICPR), 2016 23rd International Conference on, IEEE (2016) 1195– 1200
Antony, J., McGuinness, K., O’Connor, N.E., Moran, K.: Quantifying radiographic knee osteoarthritis severity using deep convolutional neural networks. In: Pattern Recognition (ICPR), 2016 23rd International Conference on, IEEE (2016) 1195– 1200
2016
-
[46]
Machine Vision for three- demensional Sciences (1990)
Sobel, I.: An isotropic 3 × 3 image gradient operator. Machine Vision for three- demensional Sciences (1990)
1990
-
[47]
In: Computer Vision and Pattern Recognition, 2005
Dalal, N., Triggs, B.: Histograms of oriented gradients for human detection. In: Computer Vision and Pattern Recognition, 2005. CVPR 2005. IEEE Computer Society Conference on. Volume 1., IEEE (2005) 886–893
2005
-
[48]
In: Proceedings of the IEEE Conference on Computer Vision and Pattern Recognition
Long, J., Shelhamer, E., Darrell, T.: Fully convolutional networks for semantic segmentation. In: Proceedings of the IEEE Conference on Computer Vision and Pattern Recognition. (2015) 3431–3440
2015
-
[49]
In: 3D Vision (3DV), 2016 Fourth International Conference on, IEEE (2016) 565–571
Milletari, F., Navab, N., Ahmadi, S.A.: V-net: Fully convolutional neural networks for volumetric medical image segmentation. In: 3D Vision (3DV), 2016 Fourth International Conference on, IEEE (2016) 565–571
2016
-
[50]
arXiv preprint arXiv:1701.03056 (2017)
Kayalibay, B., Jensen, G., van der Smagt, P.: Cnn-based segmentation of medical imaging data. arXiv preprint arXiv:1701.03056 (2017)
2017 arXiv
-
[51]
arXiv preprint arXiv:1702.05970 (2017)
Christ, P.F., Ettlinger, F., Gr¨ un, F., Elshaera, M.E.A., Lipkova, J., Schlecht, S., Ahmaddy, F., Tatavarty, S., Bickel, M., Bilic, P., et al.: Automatic liver and tumor segmentation of ct and mri volumes using cascaded fully convolutional neural networks. arXiv preprint arXi...
2017 arXiv
-
[52]
(2016) Available at http://cs231n.github.io/ convolutional-networks/
Li, F.F., Karpathy, A., Johnson, J.: CS231n: Convolutional Neural Net- works for Visual Recognition. (2016) Available at http://cs231n.github.io/ convolutional-networks/
2016
-
[53]
arXiv preprint arXiv:1409.1556 (2014)
Simonyan, K., Zisserman, A.: Very deep convolutional networks for large-scale image recognition. arXiv preprint arXiv:1409.1556 (2014)
2014 arXiv
-
[54]
OpenCV library documentation (2001) 84 Joseph Antony, Kevin McGuinness, Kieran Moran, Noel E O’Connor
Kilian, J.: Simple image analysis by moments. OpenCV library documentation (2001) 84 Joseph Antony, Kevin McGuinness, Kieran Moran, Noel E O’Connor
2001
-
[55]
In: Color Imaging: Processing, Hardcopy, and Applications
Bressan, M., Dance, C.R., Poirier, H., Arregui, D.: Local contrast enhancement. In: Color Imaging: Processing, Hardcopy, and Applications. (2007) 64930Y
2007
-
[56]
Computer vision, graphics, and image processing 39(3) (1987) 355–368
Pizer, S.M., Amburn, E.P., Austin, J.D., Cromartie, R., Geselowitz, A., Greer, T., ter Haar Romeny, B., Zimmerman, J.B., Zuiderveld, K.: Adaptive histogram equalization and its variations. Computer vision, graphics, and image processing 39(3) (1987) 355–368
1987
-
[57]
In: Proceedings of the IEEE Conference on Computer Vision and Pattern Recognition
Erhan, D., Szegedy, C., Toshev, A., Anguelov, D.: Scalable object detection using deep neural networks. In: Proceedings of the IEEE Conference on Computer Vision and Pattern Recognition. (2014) 2147–2154
2014
-
[58]
In: International Conference on Machine Learning and Data Mining in Pattern Recognition, Springer (2017) 376–390
Antony, J., McGuinness, K., Moran, K., OConnor, N.E.: Automatic detection of knee joints and quantification of knee osteoarthritis severity using convolutional neural networks. In: International Conference on Machine Learning and Data Mining in Pattern Recognition, Springer (20...
2017
-
[59]
IEEE Transactions on pattern analysis and machine intelligence 24(7) (2002) 971–987
Ojala, T., Pietikainen, M., Maenpaa, T.: Multiresolution gray-scale and rotation invariant texture classification with local binary patterns. IEEE Transactions on pattern analysis and machine intelligence 24(7) (2002) 971–987
2002
-
[60]
Astrophysics Source Code Library (2013)
Shamir, L., Orlov, N., Eckley, D.M., Macura, T., Johnston, J., Goldberg, I.: Wnd- charm: Multi-purpose image classifier. Astrophysics Source Code Library (2013)
2013
-
[61]
IEEE Transactions on Systems, Man, and Cybernetics 8(6) (1978) 460–473
Tamura, H., Mori, S., Yamawaki, T.: Textural features corresponding to visual perception. IEEE Transactions on Systems, Man, and Cybernetics 8(6) (1978) 460–473
1978
-
[62]
IEEE Transactions on systems, man, and cybernetics 3(6) (1973) 610–621
Haralick, R.M., Shanmugam, K., et al.: Textural features for image classification. IEEE Transactions on systems, man, and cybernetics 3(6) (1973) 610–621
1973
-
[63]
IEEE Transactions on Image processing 11(10) (2002) 1160–1167
Grigorescu, S.E., Petkov, N., Kruizinga, P.: Comparison of texture features based on gabor filters. IEEE Transactions on Image processing 11(10) (2002) 1160–1167
2002
-
[64]
JOSA 70(8) (1980) 920–930
Teague, M.R.: Image analysis via the general theory of moments. JOSA 70(8) (1980) 920–930
1980
-
[65]
In: Proceedings of British Machine Vision Conference
Chatfield, K., Simonyan, K., Vedaldi, A., Zisserman, A.: Return of the devil in the details: Delving deep into convolutional nets. In: Proceedings of British Machine Vision Conference. (2014)
2014
-
[66]
In: Proceedings of the ACM International Conference on Multimedia
Jia, Y., Shelhamer, E., Donahue, J., Karayev, S., Long, J., Girshick, R., Guadar- rama, S., Darrell, T.: Caffe: Convolutional architecture for fast feature embedding. In: Proceedings of the ACM International Conference on Multimedia. (2014) 675– 678
2014
-
[67]
In: Proceedings of the British Machine Vision Conference, BMVA Press (2014)
Karayev, S., Trentacoste, M., Han, H., Agarwala, A., Darrell, T., Hertzmann, A., Winnemoeller, H.: Recognizing image style. In: Proceedings of the British Machine Vision Conference, BMVA Press (2014)
2014
-
[68]
International Journal of Computer Vision 115(3) (2015) 211–252
Russakovsky, O., Deng, J., Su, H., Krause, J., Satheesh, S., Ma, S., Huang, Z., Karpathy, A., Khosla, A., Bernstein, M., et al.: ImageNet large scale visual recognition challenge. International Journal of Computer Vision 115(3) (2015) 211–252
2015
-
[69]
(2014) 3320–3328
Yosinski, J., Clune, J., Bengio, Y., Lipson, H.: How transferable are features in deep neural networks? In: Advances in Neural Information Processing Systems. (2014) 3320–3328
2014
-
[70]
In: Proceedings of the Thirteenth International Conference on Artificial Intelligence and Statistics
Glorot, X., Bengio, Y.: Understanding the difficulty of training deep feedforward neural networks. In: Proceedings of the Thirteenth International Conference on Artificial Intelligence and Statistics. (2010) 249–256
2010
-
[71]
Journal of machine learning research 9 (2008) 1871–1874 Feature Learning to Assess Knee OA Severity 85
Fan, R.E., Chang, K.W., Hsieh, C.J., Wang, X.R., Lin, C.J.: LIBLINEAR: A library for large linear classification. Journal of machine learning research 9 (2008) 1871–1874 Feature Learning to Assess Knee OA Severity 85
2008
-
[72]
In: Biomedical Imaging (ISBI), 2016 IEEE 13th International Symposium on, IEEE (2016) 1430–1434
Miao, S., Wang, Z.J., Zheng, Y., Liao, R.: Real-time 2d/3d registration via cnn regression. In: Biomedical Imaging (ISBI), 2016 IEEE 13th International Symposium on, IEEE (2016) 1430–1434
2016
-
[73]
Medical image analysis 36 (2017) 41–51
Spampinato, C., Palazzo, S., Giordano, D., Aldinucci, M., Leonardi, R.: Deep learning for automated skeletal bone age assessment in x-ray images. Medical image analysis 36 (2017) 41–51
2017
-
[74]
In: Proceedings Volume 9785, Medical Imaging 2016: Computer-Aided Diagnosis, SPIE Medical Imaging (2016)
Roth, H.R., Wang, Y., Yao, J., Lu, L., Burns, J.E., Summers, R.M.: Deep convolutional networks for automated detection of posterior-element fractures on spine ct. In: Proceedings Volume 9785, Medical Imaging 2016: Computer-Aided Diagnosis, SPIE Medical Imaging (2016)
2016
-
[75]
In: CVPR09
Deng, J., Dong, W., Socher, R., Li, L.J., Li, K., Fei-Fei, L.: ImageNet: A Large- Scale Hierarchical Image Database. In: CVPR09. (2009)
2009
-
[76]
In: Proceedings of the IEEE Conference on Computer Vision and Pattern Recognition
Liu, S., Yang, J., Huang, C., Yang, M.H.: Multi-objective convolutional learning for face labeling. In: Proceedings of the IEEE Conference on Computer Vision and Pattern Recognition. (2015) 3451–3459
2015
-
[77]
In: Advances in neural information processing systems
Tompson, J.J., Jain, A., LeCun, Y., Bregler, C.: Joint training of a convolutional network and a graphical model for human pose estimation. In: Advances in neural information processing systems. (2014) 1799–1807
2014
-
[78]
In: German Conference on Pattern Recognition, Springer (2014) 107–118
Ranftl, R., Pock, T.: A deep variational model for image segmentation. In: German Conference on Pattern Recognition, Springer (2014) 107–118
2014
-
[79]
IEEE Transactions on Image Processing 14(9) (2005) 1360–1371
Ning, F., Delhomme, D., LeCun, Y., Piano, F., Bottou, L., Barbano, P.E.: Toward automatic phenotyping of developing embryos from videos. IEEE Transactions on Image Processing 14(9) (2005) 1360–1371
2005
-
[80]
In: European Conference on Computer Vision, Springer (2016) 19–35
Rudd, E.M., G¨ unther, M., Boult, T.E.: Moon: A mixed objective optimization network for the recognition of facial attributes. In: European Conference on Computer Vision, Springer (2016) 19–35
2016
-
[81]
Annals of the rheumatic diseases 67(7) (2008) 1034–1036
Schiphof, D., Boers, M., Bierma-Zeinstra, S.M.: Differences in descriptions of kellgren and lawrence grades of knee osteoarthritis. Annals of the rheumatic diseases 67(7) (2008) 1034–1036
2008
-
[82]
Journal of Musculoskeletal Research 13(04) (2010) 197–201
Shamir, L., Felson, D.T., Ferrucci, L., Goldberg, I.G.: Assessment of osteoarthritis initiative–kellgren and lawrence scoring projects quality using computer analysis. Journal of Musculoskeletal Research 13(04) (2010) 197–201
2010
-
[83]
IEEE Transactions on Knowledge and Data Engineering 28(1) (2016) 127–146
Guti´ errez, P.A., Perez-Ortiz, M., Sanchez-Monedero, J., Fernandez-Navarro, F., Hervas-Martinez, C.: Ordinal regression methods: survey and experimental study. IEEE Transactions on Knowledge and Data Engineering 28(1) (2016) 127–146
2016
-
[84]
Journal of Machine Learning Research 18(55) (2017) 1–35
Pedregosa, F., Bach, F., Gramfort, A.: On the consistency of ordinal regression methods. Journal of Machine Learning Research 18(55) (2017) 1–35
2017
-
[85]
arXiv preprint arXiv:1612.00775 (2016)
Beckham, C., Pal, C.: A simple squared-error reformulation for ordinal classifica- tion. arXiv preprint arXiv:1612.00775 (2016)
2016 arXiv
-
[86]
In: International Conference on Medical Imaging with Deep Learning
G´ orriz, M., Antony, J., McGuinness, K., Gir´ o-i Nieto, X., OConnor, N.E.: Assessing knee oa severity with cnn attention-based end-to-end architectures. In: International Conference on Medical Imaging with Deep Learning. (2019) 197–214
2019
-
[87]
Arthritis Care & Research 51(4) (2004) 558–561
Williams, D.A., Farrell, M.J., Cunningham, J., Gracely, R.H., Ambrose, K., Cupps, T., Mohan, N., Clauw, D.J.: Knee pain and radiographic osteoarthritis interact in the prediction of levels of self-reported disability. Arthritis Care & Research 51(4) (2004) 558–561
2004
-
[88]
Scientific reports 9(1) (2019) 5761
Abedin, J., Antony, J., McGuinness, K., Moran, K., OConnor, N.E., Rebholz- Schuhmann, D., Newell, J.: Predicting knee osteoarthritis severity: comparative modeling based on patients data and plain x-ray images. Scientific reports 9(1) (2019) 5761
2019
Reviewed August 14, 2026 · model on record in the stance chip above.
Discussion (0). Continue with ORCID to comment.