REVIEW 3 major objections 4 minor 37 references
Predicting knee osteoarthritis severity: comparative modeling based on patient's data and plain X-ray images
T0 review · 3 major / 4 minor · reviewed 2026-08-14 · deepseek-v4-flash
Pith's one-line read This paper claims that patient questionnaire data—symptoms, medication use, and basic characteristics—can predict knee osteoarthritis severity nearly as well as a convolutional neural network trained on the knee X-rays themselves.
desk verdict The paper's central comparison is compromised because the statistical models include baseline radiographic OA variables (P01LXRKOA/P01RXRKOA), so the 'questionnaire vs X-ray' framing is not clean; still, the modeling exercise and mixed-effects approach give it some value. read the letter →
The pith
A machine-rendered reading of the paper's core claim, the machinery that carries it, and where it could break.
The reading
What carries the argument
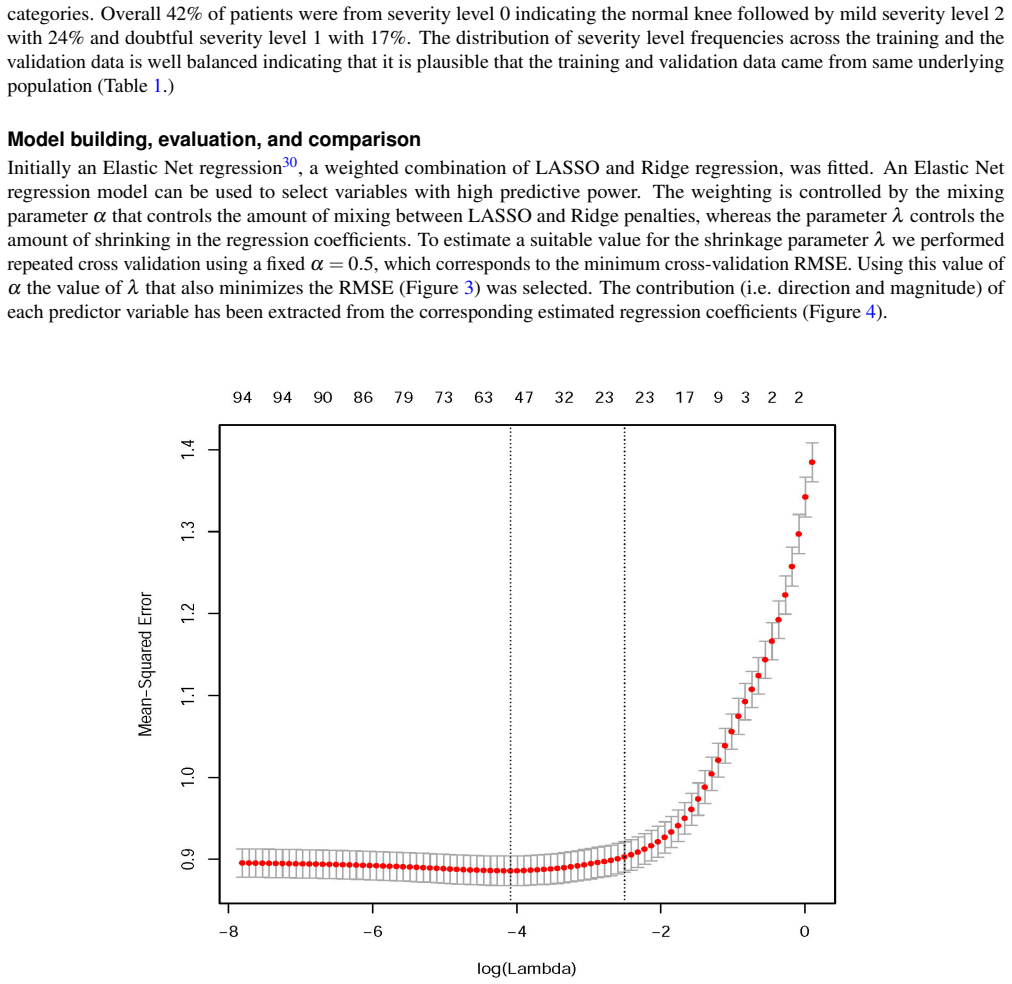
The argument is carried by a fixed comparison protocol: the same 70/30 patient split, the same validation set, and RMSE on the continuous KL score as the single yardstick. The four models are Elastic Net regression, a penalized linear model that selects predictors; Random Forest, a bagged ensemble of trees; a linear mixed model with a subject-level random effect to absorb the correlation between left and right knee; and a five-layer convolutional network with batch normalization, max pooling, dropout, and L2 regularization that was trained from scratch on automatically localized knee joint images. The Elastic Net and Random Forest identify shared high-importance variables; the mixed model corrects the uncertainty estimates for the hierarchical data structure. What all four models share is the outcome: a five-point ordinal grade treated as a continuous response, which the paper acknowledges is a deliberate modeling choice after ordinal logistic regression performed poorly.
What would settle it
Look up the data dictionary definitions of P01LXRKOA and P01RXRKOA in the study's public dataset. If those fields are recorded by radiologists from X-rays rather than answered by patients, retrain the Elastic Net and Random Forest models without them; if the RMSE rises well above 0.97, the paper's questionnaire-data conclusion is partly an imaging conclusion.
Extended reading notes
Core claim
The authors' central claim is that statistical models trained on patient assessment data predict KOA severity on the KL 0–4 scale with good accuracy, and that this accuracy is comparable to image-based deep learning. The RMSE values are 0.974 for Elastic Net, 0.943 for Random Forest, and 0.978 for the linear mixed model, versus 0.77 for the CNN; the paper reads the difference as considerably small and states that questionnaire data predict severity with good accuracy. The same validation split is used across all models, and the statistical models have the additional advantage of naming the predictors—prior knee surgery, pain medication, functional impairment, sex—that carry the signal. The paper also reports an intraclass correlation of 0.265, showing that the two knees of a patient are strongly correlated and that a mixed model is the appropriate inferential frame. The authors themselves flag that the KL grade is subjective and not a gold standard, which sets a ceiling on how well any model can agree with a single rater.
Load-bearing premise
The comparability claim assumes that P01LXRKOA and P01RXRKOA—the two variables with the highest predictive weight—are genuinely patient-reported questionnaire items, when their names describe baseline radiographic OA status of the knee.
Editorial extensions
If this is right
- If the comparison holds, routine clinical questionnaires could serve as a low-cost screening step that identifies patients warranting an X-ray, rather than imaging everyone first.
- The variables the models highlight—previous knee surgery, pain medication, functional knee limitations, and patient sex—could be tracked over time as an early-warning checklist for KOA progression.
- Because the linear mixed model captures 26.5% of variance at the patient level, analyses that treat the two knees as independent will overstate confidence; future knee-level studies should model the nested structure.
- On the hardest-to-predict cases (KL grades 3 and 4, where training data are scarce), the CNN's per-level RMSE is much lower than the questionnaires', so comparable overall does not mean interchangeable at the severe end.
Reading between the lines
- The central comparison would be cleaner if the two strongest predictors—P01LXRKOA and P01RXRKOA, named as baseline radiographic OA status for each knee—were excluded; their labels suggest they encode X-ray findings, so a questionnaire-only model without them may be a fairer test of the paper's headline claim.
- A natural extension the paper does not run is a combined model: the same validation set and outcome could be used to test whether adding questionnaire variables to the X-ray CNN pushes RMSE below 0.77, which would tell clinicians whether the two data sources carry complementary information.
- The per-level RMSE pattern predicts that in a population with more severe OA—where grades 3 and 4 are common—the overall comparability would likely shrink; the questionnaire models' weakness at high grades would matter more in a tertiary-care setting than in a community screening cohort.
- Because the paper reports only a single random split, a bootstrap or repeated-split estimate of the RMSE difference would show whether the 0.17–0.20 gap between CNN and questionnaire models is stable or within noise.
Signed reviews
Editorial analysis
A structured set of objections, weighed in public.
Referee Report
Summary. Using baseline data from the Osteoarthritis Initiative (OAI), the authors train Elastic Net, Random Forest, and linear mixed-effect models on participant questionnaire/clinical variables to predict Kellgren-Lawrence (KL) severity grades, and compare their RMSEs with a CNN trained on knee X-ray images. They report RMSEs of 0.973 (EN), 0.943 (RF), 0.978 (LMM), and 0.770 (CNN), and conclude that statistical models using patient questionnaire data achieve accuracy comparable to X-ray-image models. They also highlight the strongest predictive variables as potential monitoring targets. The paper's central claim is that a low-cost, non-imaging patient assessment can substitute for radiographic severity grading, while also yielding interpretable predictors.
Significance. If the comparison were valid, this would be a practically useful and novel result: questionnaire-based prediction of KL grade could support screening and monitoring without immediate X-ray imaging. The paper has several strengths: it uses a large public dataset, applies a deliberate training/validation split, uses LMM to account for the hierarchical structure of knees within patients, and attempts to identify interpretable predictors. However, the current analysis does not establish the central claim because the statistical models may include variables carrying radiographic information, the CNN benchmark is quoted from prior work by the same group without clear evidence of a matched evaluation protocol, and the RMSE comparisons lack uncertainty quantification.
major comments (3)
- [Discussion; Results (Table 3)] The paper's central claim depends on the statistical models using only patient questionnaire data, but the strongest predictors are described as 'knee baseline radiographic OA status for the right or left knee' (P01LXRKOA, P01RXRKOA). These names and the Discussion wording indicate that the models receive information about X-ray-derived OA status. If P01LXRKOA/P01RXRKOA are imaging-derived, or even if they are patient reports of a prior radiographic diagnosis, the statistical models are not using questionnaire/symptom data alone, and the comparison with the X-ray CNN is partly circular. Please define these variables precisely from the OAI codebook, state whether they encode radiographic assessment, and if they do, refit the EN, RF, and LMM models without them and report the resulting RMSEs. This is necessary to support the Abstract and Discussion claims about questionnaire-only prediction.
- [Methods (Convolution Neural Network); Results (Table 3)] The CNN RMSE of 0.770 is quoted from the authors' earlier publications (refs 26 and 27) rather than computed within the same evaluation pipeline described here. The text states that the same validation patients were used, but it does not demonstrate that the CNN was retrained on the same training set of 2,105 patients used for the statistical models, nor that its hyperparameters were selected without using the validation set. Without a fully matched training and validation protocol, Table 3 may compare models evaluated under different conditions, so the conclusion that the models are comparable is not yet supported. Please clarify whether the CNN result was recomputed for this paper, and report the exact split and model selection procedure used.
- [Results (Table 3)] All RMSE values are reported as single point estimates with no confidence intervals, bootstrap estimates, or significance tests. The observed differences between the CNN and the statistical models (e.g., 0.770 vs 0.943) could be within sampling variability, especially given the small numbers of patients at KL grades 3 and 4 and the large per-level RMSE differences in the table. Please provide uncertainty intervals (e.g., bootstrap over subjects, respecting the two-knee clustering) and, if appropriate, a paired comparison on the common validation set, so that the claim of 'comparable' accuracy is quantitatively supported.
minor comments (4)
- [Methods (Linear Mixed Effect Model), Eq. (2)] The notation in Eq. (2) is internally inconsistent: if i indexes patients and j indexes knees within a patient, then m should be the number of patients and n_i should be 2 for both knees; the text's statement that 'm = 2 representing left and right knee' is incorrect and should be corrected.
- [Methods (Data pre-processing)] The threshold for dropping categorical variables is described as 'very low frequency ... less than 5% into one category in a binary variable'; please report the exact criterion and, ideally, a sensitivity analysis showing that the main results are stable to reasonable changes in this threshold and in the 15% missingness threshold.
- [Data and Supplement] The supplementary table listing candidate variables is not available in the posted version; because the central concern about P01LXRKOA/P01RXRKOA depends on their definition, the OAI codebook entries and the full candidate variable list should be included as supplementary material, along with any code or data-processing scripts used to create the analytic dataset.
- [Throughout] There are several minor language issues, such as 'The red points represents RMSE' (should be 'represent') and 'patients share almost similar distribution' (should be 'have similar distributions'); these do not affect the science but should be corrected in revision.
Circularity Check
Statistical models include X-ray-derived 'baseline radiographic OA status' variables, making the questionnaire-vs-imaging comparison partially circular.
-
self definitional
[Discussion, strong-indicator-variables paragraph; Abstract/Results Table 3 RMSE comparison]
"The strong indicator variables are reporting on knee baseline radiographic OA status for the right or left knee (P01LXRKOA, P01RXRKOA) and on treatments such as surgery on the right or left knee (P01KSURGR, P01KSURGL) as well as other reasons to see the doctor (P01ARTDOC)."
The target KL grade is assigned by a radiologist from knee X-rays (Introduction: 'grades the severity level of the impairments according to the Kellgren and Lawrence grading scheme'). A variable that the paper itself labels as 'knee baseline radiographic OA status' therefore encodes the same imaging-derived construct as the outcome. Including P01LXRKOA/P01RXRKOA among the strong predictors means the EN/RF/LMM RMSE values in Table 3 are not produced from signs, symptoms, and medication alone; the statistical 'questionnaire' models import an X-ray-based diagnosis. The claimed comparability to the X-ray CNN is thus partly forced by construction: one of the strongest inputs is a restatement of the radiograph-derived status being predicted.
full rationale
The model-fitting machinery (Elastic Net, Random Forest, LMM, cross-validated RMSE) is standard and self-contained, and the CNN benchmark is a reasonable image-based comparator. The load-bearing problem is semantic leakage in the predictor set. The paper itself identifies P01LXRKOA and P01RXRKOA as 'knee baseline radiographic OA status' and as the strongest indicator variables, while the outcome is a radiograph-based KL severity grade. Under this description, the statistical models are not using questionnaire data alone; they are using a variable that already contains the X-ray-derived diagnostic status. Consequently the headline conclusion that questionnaire-based prediction is comparable to X-ray-image prediction is partially self-definitional, not an independent demonstration. This is a genuine partial circularity (score 7) rather than a fully circular derivation (score 8-10), because other questionnaire predictors contribute and the ML methods are otherwise conventional. No additional self-citation step is load-bearing: refs 26-28 are used as external benchmarks, and the CNN architecture is trained in this work.
Assumptions & free parameters
free parameters (6)
- alpha (Elastic Net mixing) =
0.5
- lambda (Elastic Net shrinkage) =
Selected by repeated cross-validation on training data
- number of trees (Random Forest) =
100
- missingness threshold =
15% missing allowed (variables with at least 85% non-missing kept)
- category frequency threshold =
5% (binary variables with less than 5% in one category dropped)
- CNN hyperparameters =
dropout 0.25 and 0.5; L2 penalty 0.01; learning rate 0.001 (from prior work)
assumptions (4)
- domain assumption KL grade is treated as a continuous outcome in EN, RF, and LMM.
- domain assumption Missing data are missing at random for variables kept in the analysis.
- ad hoc to paper P01LXRKOA and P01RXRKOA are treated as patient questionnaire variables.
- domain assumption The CNN model from refs 26 and 27 achieves RMSE 0.77 on the same validation patients.
Cite this review
Pith. "Pith review of Predicting knee osteoarthritis severity: comparative modeling based on patient's data and plain X-ray images." pith.science (2026). https://pith.science/paper/GGBHAQPI
@misc{pith2026190808873,
  author       = {Pith},
  title        = {Pith review of: Predicting knee osteoarthritis severity: comparative modeling based on patient's data and plain X-ray images},
  year         = {2026},
  howpublished = {\url{https://pith.science/paper/GGBHAQPI}},
  note         = {Machine review of arXiv:1908.08873}
}
read the original abstract
Knee osteoarthritis (KOA) is a disease that impairs knee function and causes pain. A radiologist reviews knee X-ray images and grades the severity level of the impairments according to the Kellgren and Lawrence grading scheme; a five-point ordinal scale (0--4). In this study, we used Elastic Net (EN) and Random Forests (RF) to build predictive models using patient assessment data (i.e. signs and symptoms of both knees and medication use) and a convolution neural network (CNN) trained using X-ray images only. Linear mixed effect models (LMM) were used to model the within subject correlation between the two knees. The root mean squared error for the CNN, EN, and RF models was 0.77, 0.97, and 0.94 respectively. The LMM shows similar overall prediction accuracy as the EN regression but correctly accounted for the hierarchical structure of the data resulting in more reliable inference. Useful explanatory variables were identified that could be used for patient monitoring before X-ray imaging. Our analyses suggest that the models trained for predicting the KOA severity levels achieve comparable results when modeling X-ray images and patient data. The subjectivity in the KL grade is still a primary concern.
Figures

Figures from the paper (3 more)


Reference graph
Works this paper leans on
-
[1]
Arden, N. et al. Atlas of osteoarthritis (Springer, 2014)
work page 2014
-
[2]
Eyre, D. R. Collagens and cartilage matrix homeostasis. Clin. orthopaedics related research 427, S118–S122 (2004)
work page 2004
-
[3]
Murphy, S. L., Lyden, A. K., Phillips, K., Clauw, D. J. & Williams, D. A. Subgroups of older adults with osteoarthritis based upon differing comorbid symptom presentations and potential underlying pain mechanisms. Arthritis research & therapy 13, R135 (2011)
work page 2011
-
[4]
Zhang, Y . & Jordan, J. M. Epidemiology of osteoarthritis.Clin. geriatric medicine 26, 355–369 (2010)
work page 2010
-
[5]
Peat, G., McCarney, R. & Croft, P. Knee pain and osteoarthritis in older adults: a review of community burden and current use of primary health care. Annals rheumatic diseases 60, 91–97 (2001)
work page 2001
-
[6]
Bliddal, H. & Christensen, R. The treatment and prevention of knee osteoarthritis: a tool for clinical decision-making. Expert. opinion on pharmacotherapy 10, 1793–1804 (2009)
work page 2009
-
[7]
Knee osteoarthritis prevalence, risk factors, pathogenesis and features: Part i
Heidari, B. Knee osteoarthritis prevalence, risk factors, pathogenesis and features: Part i. Casp. journal internal medicine 2, 205 (2011)
work page 2011
-
[8]
Altman, R. D. Early management of osteoarthritis. The Am. journal managed care 16, S41–7 (2010)
work page 2010
Show all 37 references
-
[9]
Cross, M. et al. The global burden of hip and knee osteoarthritis: estimates from the global burden of disease 2010 study. Annals rheumatic diseases annrheumdis–2013 (2014)
2014
-
[10]
& Zamora, A
Puig-Junoy, J. & Zamora, A. R. Socio-economic costs of osteoarthritis: a systematic review of cost-of-illness studies. In Seminars in arthritis and rheumatism , vol. 44-5, 531–541 (Elsevier, 2015)
2015
-
[11]
for Disease Control, C., (CDC, P. et al. Arthritis prevalence and activity limitations–united states, 1990. MMWR. Morb. mortality weekly report 43, 433 (1994)
1994
-
[12]
Guccione, A. A. et al. The effects of specific medical conditions on the functional limitations of elders in the framingham study. Am. journal public health 84, 351–358 (1994)
1994
-
[13]
Karsdal, M. et al. Disease-modifying treatments for osteoarthritis (dmoads) of the knee and hip: lessons learned from failures and opportunities for the future. Osteoarthr. cartilage 24, 2013–2021 (2016)
2016
-
[14]
& Lawrence, J
Kellegren, J. & Lawrence, J. Radiological assessment of osteoarthritis. Ann Rheum Dis 16, 494–501 (1957)
1957
-
[15]
Braun, H. J. & Gold, G. E. Diagnosis of osteoarthritis: imaging. Bone 51, 278–288 (2012)
2012
-
[16]
Gossec, L. et al. Comparative evaluation of three semi-quantitative radiographic grading techniques for knee osteoarthritis in terms of validity and reproducibility in 1759 x-rays: report of the oarsi–omeract task force. Osteoarthr. cartilage 16, 742–748 (2008)
2008
-
[17]
Sheehy, L. et al. Validity and sensitivity to change of three scales for the radiographic assessment of knee osteoarthritis using images from the multicenter osteoarthritis study (most). Osteoarthr. cartilage 23, 1491–1498 (2015)
2015
-
[18]
& Huskisson, E
Dacree, J. & Huskisson, E. The automatic assessment of knee radiographs in osteoarthritis using digital image analysis. Rheumatol. 28, 506–510 (1989)
1989
-
[19]
T., Ferrucci, L
Shamir, L., Felson, D. T., Ferrucci, L. & Goldberg, I. G. Assessment of osteoarthritis initiative–kellgren and lawrence scoring projects quality using computer analysis. J. Musculoskelet. Res. 13, 197–201 (2010)
2010
-
[20]
& Kurzynski, M
Woloszynski, T., Podsiadlo, P., Stachowiak, G. & Kurzynski, M. A dissimilarity-based multiple classifier system for trabecular bone texture in detection and prediction of progression of knee osteoarthritis. Proc. Inst. Mech. Eng. Part H: J. Eng. Medicine 226, 887–894 (2012)
2012
-
[21]
Shamir, L. et al. Early detection of radiographic knee osteoarthritis using computer-aided analysis. Osteoarthr. Cartil. 17, 1307–1312 (2009)
2009
-
[22]
& Cootes, T
Thomson, J., O’Neill, T., Felson, D. & Cootes, T. Automated shape and texture analysis for detection of osteoarthritis from radiographs of the knee. In International Conference on Medical Image Computing and Computer-Assisted Intervention , 127–134 (Springer, 2015)
2015
-
[23]
& Hunter, D
Eckstein, F., Mosher, T. & Hunter, D. Imaging of knee osteoarthritis: data beyond the beauty. Curr. opinion rheumatology 19, 435–443 (2007)
2007
-
[24]
Segal, N. A. et al. The multicenter osteoarthritis study: opportunities for rehabilitation research. PM&R 5, 647–654 (2013)
2013
-
[25]
Oka, H. et al. Fully automatic quantification of knee osteoarthritis severity on plain radiographs. Osteoarthr. Cartil. 16, 1300–1306 (2008). 11/12
2008
-
[26]
Antony, J., McGuinness, K., O’Connor, N. E. & Moran, K. Quantifying radiographic knee osteoarthritis severity using deep convolutional neural networks. In Pattern Recognition (ICPR), 2016 23rd International Conference on , 1195–1200 (IEEE, 2016)
2016
-
[27]
& O’Connor, N
Antony, J., McGuinness, K., Moran, K. & O’Connor, N. E. Automatic detection of knee joints and quantification of knee osteoarthritis severity using convolutional neural networks. In International Conference on Machine Learning and Data Mining in Pattern Recognition, 376–390 (Sp...
2017
-
[28]
& Saarakkala, S
Tiulpin, A., Thevenot, J., Rahtu, E., Lehenkari, P. & Saarakkala, S. Automatic knee osteoarthritis diagnosis from plain radiographs: A deep learning-based approach. Sci. reports 8, 1727 (2018)
2018
-
[29]
& ´Angeles, G
Kolenikov, S. & ´Angeles, G. The use of discrete data in principal component analysis with applications to socio-economic indices. cpc. Tech. Rep., MEASURE Working Paper No. WP-04-85 (2004)
2004
-
[30]
& Hastie, T
Zou, H. & Hastie, T. Regularization and variable selection via the elastic net. J. Royal Stat. Soc. Ser. B (Statistical Methodol. 67, 301–320 (2005)
2005
-
[31]
Random forests
Breiman, L. Random forests. Mach. learning 45, 5–32 (2001)
2001
-
[32]
& Spector, T
Hart, D. & Spector, T. Kellgren & lawrence grade 1 osteophytes in the knee—doubtful or definite? Osteoarthr. cartilage 11, 149–150 (2003)
2003
-
[33]
J., McDougall, J
Hunter, D. J., McDougall, J. J. & Keefe, F. J. The symptoms of osteoarthritis and the genesis of pain. Rheum. Dis. Clin. North Am. 34, 623–643 (2008)
2008
-
[34]
Regression models for ordinal data
McCullagh, P. Regression models for ordinal data. J. Royal Stat. Soc. Ser. B (Methodological) 42, 109–127 (1980)
1980
-
[35]
Anderson, J. A. Regression and ordered categorical variables. J. Royal Stat. Soc. Ser. B (Methodological) 46, 1–22 (1984)
1984
-
[36]
Laird, N. M. & Ware, J. H. Random-effects models for longitudinal data. Biom. 963–974 (1982)
1982
-
[37]
Ho, T. K. Random decision forests. In Document analysis and recognition, 1995., proceedings of the third international conference on, vol. 1, 278–282 (IEEE, 1995). Acknowledgements This publication has emanated from research supported in part by a research grant from Science F...
1995
Reviewed August 14, 2026 · model on record in the stance chip above.
Discussion (0). Continue with ORCID to comment.