REVIEW 3 major objections 6 minor 36 references
Automation is no barrier to light vehicle electrification
T0 review · 3 major / 6 minor · reviewed 2026-08-14 · deepseek-v4-flash
Pith's one-line read Adding full self-driving hardware to an electric car costs only 4-14 percent of its range, a physics-based model finds.
desk verdict A transparent, physics-based answer to the automation-EV range question, but the 'minor penalty' conclusion hinges on a 1 kW compute ceiling that the paper itself cites as possibly too low. read the letter →
The pith
A machine-rendered reading of the paper's core claim, the machinery that carries it, and where it could break.
The reading
What carries the argument
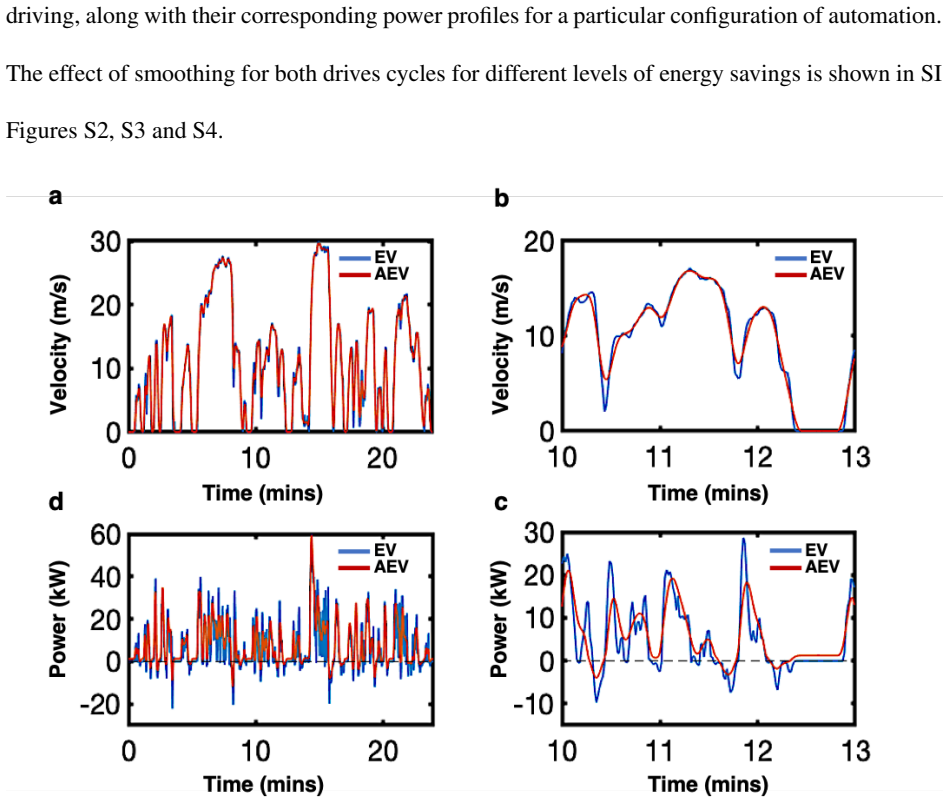
The load-bearing object is an extended physics-based vehicle dynamics model that computes, at one-second resolution, the instantaneous power needed to overcome aerodynamic drag, rolling friction, and inertia: $P(t) = [ (1/2\rho C_d A v(t)^2) v(t) + \mu_{rr} m g v(t) + m (dv/dt) v(t) ] / (\eta_1 \eta_2)$, with automation compute and sensor loads added at each timestep. The automated vehicle is modeled by adding component weights to vehicle mass, raising the drag coefficient by 15-40% for a roof-mounted spinning LiDAR (zero for camera-only or integrated solid-state LiDAR), and replacing the human velocity profile with a smoothing spline that produces 5-25% energy savings. Repeating the cycle until the battery is depleted gives AEV range, which is compared with the same vehicle driven manually. Battery longevity is then evaluated with an electrochemical-thermal degradation model that includes SEI growth, lithium plating, and active-material isolation, run over repeated daily drive-and-charge cycles.
What would settle it
Measure the real-world energy use of a production Level 4-5 electric vehicle against the same model driven manually on identical routes while logging compute and sensor power draw. If the automation load regularly exceeds about 1 kW, or if the measured range loss exceeds the modeled 90% intervals (for example, more than about 22% on a city-only cycle with LiDAR), the paper's central conclusion would be overturned. A wind-tunnel test showing a roof-mounted spinning LiDAR increases drag by more than 40% would similarly push highway-cycle penalties above the paper's band.
Extended reading notes
Core claim
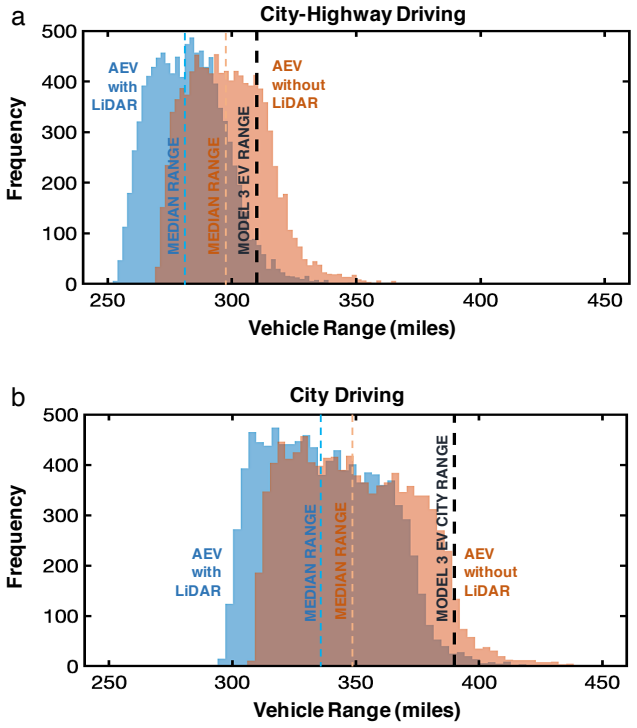
On its own terms, the paper's central claim is that the energy penalty from Level 4-5 automation is minor and its effect on battery life nearly negligible, so the first automated light-duty vehicles can be pure battery electrics rather than hybrids. The authors reach this by simulating an automated version of a long-range EV (310-mile rated range, 80 kWh pack) with Monte Carlo sampling over uncertain automation parameters. The median range loss is 9% on a combined city-highway cycle when a spinning roof LiDAR is included, and 4% without LiDAR; on a city-only cycle the medians are 14% and 11%, with 90% intervals of roughly [-4%, -22%] and [0%, -19%] for the LiDAR city case. Battery life, modeled with an electrochemical-thermal degradation framework, loses a median 5,500 miles (about 5%) with LiDAR on the composite cycle, and 9-10% at the 5th percentile; the 95th percentile automated vehicle actually outlasts the human-driven one because gentler driving lowers discharge rate and average state of charge. The paper further argues that the capitalized cost of the lost range is about $3,000, and that a value of saved time equivalent to $12 per hour for 250 hours over the vehicle's life is enough to make automation worthwhile, concluding that 'this need not be the case' for claims that the first AVs will be hybrids.
Load-bearing premise
The argument assumes production Level 4-5 automation draws between 150 W and 1,000 W of continuous computing power; if redundant computing and cooling push real-world loads into the multi-kilowatt range, the range penalty would leave the 'minor' band and the cost-benefit balance would worsen.
Editorial extensions
If this is right
- If the estimates hold, adding Level 4-5 automation to a light-duty EV does not push range loss beyond roughly a fifth even in the worst city-cycle cases, so automakers can pursue full automation without switching to hybrid powertrains.
- The LiDAR drag term is the most sensitive input; on highway-heavy cycles, developers who use roof-mounted spinning LiDAR will need aerodynamic integration or solid-state units to keep the penalty small, whereas an extra 100 W of compute costs only about 1% of range.
- Battery life is barely affected: median loss of under four months of driving, with some automated vehicles degrading more slowly than human-driven ones because of smoother driving and lower average state of charge.
- A modest value of time suffices: at $12 per hour, saving 250 hours of driving over the vehicle's life outweighs the roughly $3,000 capitalized cost of the 30-mile range loss.
- If computing power falls and sensors are integrated into the body, automation could even increase EV range, accelerating electrification rather than hindering it.
Reading between the lines
- Editorial inference: because the model shows range loss scales almost linearly with compute load and compute efficiency has been improving rapidly, the realistic long-run penalty may be closer to the 4% no-LiDAR end or below, making automation an enabler of electrification in dense urban fleets.
- Editorial inference: the city-cycle result implies robo-taxi operators, who care most about vehicle utilization, have a direct economic incentive to cut compute power, so the market will push toward the low end of the modeled range.
- Editorial inference: the paper's framing of automation as a two-month-to-three-year lag on battery specific energy suggests the range penalty can be fully offset by ordinary battery improvements within a model generation, which is a testable forecast: compare 2025-era automated EVs to 2020-era human-driven EVs.
- Editorial inference: the same physics-based method could be applied to heavy-duty trucks, where aerodynamic drag and compute loads matter differently; the paper mentions this as future work, but the extension is not demonstrated.
Signed reviews
Editorial analysis
A structured set of objections, weighed in public.
Referee Report
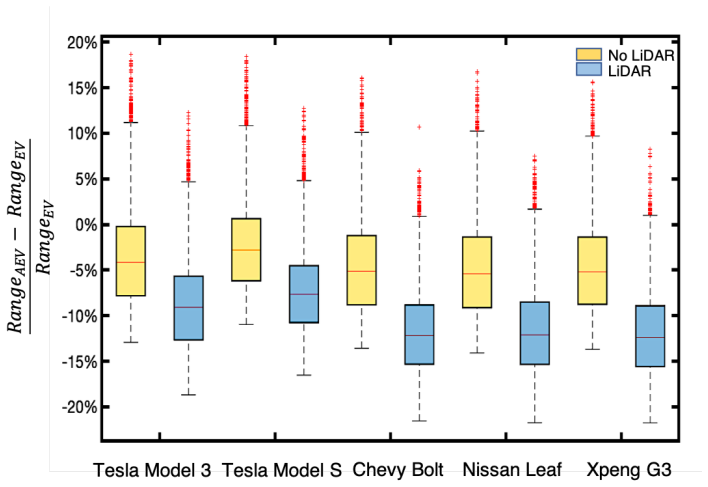
Summary. The paper uses a physics-based vehicle dynamics model, previously developed for EVs, to estimate the effect of SAE Level 4-5 automation on the range and battery life of a Tesla Model 3 and several other light-duty EVs. Automation adds mass (sensors and computing), electrical loads (30-150 W sensors, 150-1,000 W computing), drag (0-40% from roof-mounted LiDAR, approximated using wind-tunnel data for roof add-ons), and smoothing of the drive cycle (5-25% energy savings). Monte Carlo simulation over these uncertain parameters yields median range losses of 9% (with LiDAR) and 4% (without) on the composite California cycle, and 14% and 11% on the city cycle; battery longevity losses are a few thousand miles. The authors conclude that automation is likely a minor burden on EV range, not a barrier to electrification, and that consumers' value of time saved would exceed the cost of the range loss.
Significance. If correct, this is a useful and policy-relevant result: it directly challenges the frequently repeated claim that Level 4-5 automated vehicles will need hybrid powertrains because automation would overly compromise EV range. The paper's strengths are its explicit, well-documented assumptions; validation of the base model against EPA range ratings within 1%; Monte Carlo treatment of deep uncertainty; separate treatment of LiDAR/no-LiDAR architectures; and a web applet that allows readers to test assumptions. The battery degradation analysis uses an established electrochemical-thermal model. The conclusion is, however, conditional on a computational power ceiling of 1 kW and on smoothing realizations that the authors themselves label physically questionable; both assumptions push the penalty downward, so the magnitude of the 'minor' penalty is less robust than the qualitative direction of the effect.
major comments (3)
- [Methods — Computing load; Results — City driving] The 1,000 W ceiling on Level 4-5 computing power is load-bearing for the 'minor penalty' claim and is not a neutral representation of the cited literature. The paper itself notes that published estimates range to 'several thousand watts' and that redundancy and cooling could push loads higher, but the Monte Carlo distribution is truncated at 1,000 W. Because the compute load is drawn at every second of the cycle, it dominates the low-speed city cycle: using the authors' own sensitivity result (100 W costs ~1% of range), a 3 kW load would add roughly 20 percentage points of range penalty, increasing the city median from ~14% to ~30% or more. The authors should extend the Monte Carlo to include multi-kilowatt loads (or explicitly restrict conclusions to sub-1 kW architectures), report results for a 2-4 kW sensitivity case, and adjust the abstract's 'minor penalty' language accordingly.
- [SI §3 — Smoothing of City Drive Profile; Methods — Velocity Smoothing] The smoothing parameter range of 5-25% includes realizations the authors describe as 'perhaps untenable', such as the 25% savings case where the smoothed vehicle moves at 10 m/s while the original cycle is stopped. Including these physically infeasible trajectories in the Monte Carlo lowers the computed energy use and biases the median range penalty downward. I recommend restricting the smoothing distribution to cases that respect the physics of the original schedule (e.g., where the vehicle remains stopped at red lights) and reporting the sensitivity of the headline medians to that restriction; the current SI discussion is an admission that a large part of the assumed smoothing support is not credible.
- [Methods — Drag; SI Fig. S6] The drag penalty for roof-mounted LiDAR is approximated by wind-tunnel data for taxi signs, sirens, and barrels, with a 15-40% range. The paper correctly states that no empirical LiDAR drag data exist, but the proxy is the most sensitive input in the model (SI Fig. S6), so an error in this proxy translates directly into the headline 'with LiDAR' range penalty. Because the proxy is a single-directional systematic assumption (aerodynamic drag is not a random error), the paper should at least explicitly condition the 'minor penalty' conclusion on the drag proxy and, ideally, validate or bound it with CFD or scale-model measurements. This is a correctness-risk concern rather than a demonstration of error.
minor comments (6)
- [Methods — Communications] The text says 'decicated short range communication' in the Methods section; this should be 'dedicated'.
- [Figure 2] The y-axis labels are 'MODEL 3 EV RANGE' rather than the AEV range being simulated; this is confusing and should be clarified in the caption.
- [Table 1] The 'Range Impact' column uses positive values for increased range, but the sign convention is not defined in the caption.
- [SI §5] The statement that 'even doubling the computing load results in less than a 10% decrease in range' appears inconsistent with the main text's rule that 100 W decreases range by 1%, since doubling from 1,000 W to 2,000 W should be about 10%; please reconcile the two statements.
- [Methods — Power equations] In the Methods power equations, the efficiency treatment differs between tractive power (divided by η1·η2) and compute/sensor power (divided by η2 only); please define η1 and η2 explicitly and justify the difference.
- [Costs of automation] The cost-benefit analysis uses taxi/ride-share driver wages ($12/hour) as the value of time for all owners; the authors should discuss how this relates to other willingness-to-pay-to-save-time estimates from the literature.
Circularity Check
No significant circularity: the range penalty is forward-simulated and benchmarked against EPA ratings, not fitted or self-defined.
full rationale
The central claim that Level 4-5 automation imposes a minor range penalty is produced by a forward vehicle-dynamics simulation. The model is not fitted to the headline range-penalty numbers; its baseline is externally anchored: the paper reports 309 predicted vs 310 EPA-rated miles for the composite cycle and 393 vs 391 for the city cycle. The automation-related inputs (component weights, compute/sensor loads, drag increment, smoothing level) are stated assumptions sampled in Monte Carlo; none of them is defined in terms of the output range penalty. The compute-load ceiling of 1,000 W and the 5-25% smoothing bounds are acknowledged uncertainties, not calibrated values. The battery-longevity analysis uses a degradation model from prior work by the same group (Sripad and Viswanathan), but this is applied to translate already-computed power profiles into a longevity estimate; the 'negligible effect' conclusion is a consequence, not an input. The paper itself flags the limits of aggressive smoothing (the 25% case may be untenable) and notes that higher compute loads are possible, which strengthens the assumption-sensitivity discussion rather than indicating circularity. No equation in the paper reduces to its inputs by construction, and no parameter is fitted to the target results. Self-citation here is not load-bearing because the cited vehicle model is described in the paper and validated against independent EPA data.
Assumptions & free parameters
free parameters (5)
- Sensor and connectivity power load =
30-150 W, uniform distribution
- Computing power load =
150-1000 W, uniform distribution
- Drag increase from roof-mounted LiDAR =
15-40% increase in Cd, uniform; 0 if no LiDAR
- Energy savings from smoother driving =
5-25% reduction in energy use, uniform
- Linear coupling between compute and sensor load =
assumed linear relation between bounds
assumptions (8)
- standard math Newtonian force balance: F = F_drag + F_friction + F_inertia; gradient neglected
- domain assumption EPA rated ranges of production EVs are accurate baselines for the physics model
- domain assumption Drive cycles (California Unified, UDDS) are representative for relative automation vs human range comparison
- ad hoc to paper Wind-tunnel drag data for roof add-ons (taxi signs, sirens, barrels) approximate the drag penalty of roof-mounted LiDAR
- ad hoc to paper Computing load scales linearly with sensor load between bounds
- ad hoc to paper Smoothing spline with target energy savings 5-25% represents achievable automated driving behavior
- domain assumption Battery degradation sub-model (SEI growth, lithium plating, active material isolation) from Yang et al. 2017 and coauthor models is valid for this pack
- ad hoc to paper Transferring compute/sensor load during regenerative braking to adjacent seconds does not materially change battery degradation
Cite this review
Pith. "Pith review of Automation is no barrier to light vehicle electrification." pith.science (2026). https://pith.science/paper/CNSDFHWK
@misc{pith2026190808920,
  author       = {Pith},
  title        = {Pith review of: Automation is no barrier to light vehicle electrification},
  year         = {2026},
  howpublished = {\url{https://pith.science/paper/CNSDFHWK}},
  note         = {Machine review of arXiv:1908.08920}
}
read the original abstract
Weight, computational load, sensor load, and possibly higher drag may increase the energy use of automated electric vehicles (AEVs) relative to human-driven electric vehicles (EVs), although this increase may be offset by smoother driving. We use a vehicle dynamics model to show that automation is likely to impose a minor penalty on EV range and have negligible effect on battery longevity. As such, while some commentators have suggested that the power and energy requirements of automation mean that the first automated vehicles (AVs) will be gas-electric hybrids, we conclude that this need not be the case. We also find that drivers need to place only a modest value on the time saved by automation for its benefits to exceed direct costs.
Figures
Figures from the paper (1 more)

Reference graph
Works this paper leans on
-
[1]
Andrew J. Hawkins. Not all of our self-driving cars will be electrically pow- ered heres why. https://www.theverge.com/2017/12/12/16748024/ self-driving-electric-hybrid-ev-av-gm-ford/ (2017). Accessed: 30- January-2019
work page 2017
-
[2]
Taiebat, M., Brown, A. L., Safford, H. R., Qu, S. & Xu, M. A review on energy, environmental, and sustainability implications of connected and automated vehicles. Environ. Sci. Technol. 52, 11449–11465 (2018)
work page 2018
-
[3]
Stephens, T. et al. Estimated bounds and important factors for fuel use and consumer costs of connected and automated vehicles. Tech. Rep., National Renewable Energy Lab.(NREL), Golden, CO (United States) (2016)
work page 2016
-
[4]
Energy Information Administration
U.S. Energy Information Administration. Study of the potential energy. consumption impacts of connected and automated vehicles. Tech. Rep. (2017)
work page 2017
-
[5]
Offer, G. J. Automated vehicles and electrification of transport. Environ. Sci. Technol. 8, 26–30 (2015)
work page 2015
-
[6]
Sripad, S. & Viswanathan, V . Evaluation of current, future, and beyond li-ion batteries for the electrification of light commercial vehicles: Challenges and opportunities. J. Electrochem. Soc. 164, E3635–E3646 (2017)
work page 2017
-
[7]
Ouster. OS1 Datasheet. https://static1.squarespace.com/ static/58dd3a75c534a52312bad724/t/5ca679da15fcc032a353ad04/ 1554414043557/OS-1+Datasheet.pdf (2019). Accessed: 20-March-2019. 20
work page 2019
-
[8]
Chassis systems control: Mid-range radar sensor (mrr) for front and rear applications
Bosch. Chassis systems control: Mid-range radar sensor (mrr) for front and rear applications. Tech. Rep. (2015)
work page 2015
Show all 36 references
-
[9]
Dragonfly2 0.8 MP Mono FireWire 1394a Board Level (Sony ICX204)
PtGrey. Dragonfly2 0.8 MP Mono FireWire 1394a Board Level (Sony ICX204). https://www.ptgrey.com/ dragonfly2-08-mp-mono-firewire-1394a-board-level-sony-icx204 (2018). Accessed: 20-December-2018
2018
-
[10]
Velodyne. HDL-64E. hhttps://velodynelidar.com/hdl-64e.html (2019). Ac- cessed: 05-January-2019
2019
-
[11]
Carroll, A., Heiser, G. et al. An analysis of power consumption in a smartphone. In USENIX annual technical conference, vol. 14, 21–21 (Boston, MA, 2010)
2010
-
[12]
& Hernandez, J
Sepulcre, M., Gozalvez, J. & Hernandez, J. Cooperative vehicle-to-vehicle active safety testing under challenging conditions. Transportation research part C: emerging technologies26, 233– 255 (2013)
2013
-
[13]
H., Keoleian, G
Gawron, J. H., Keoleian, G. A., De Kleine, R. D., Wallington, T. J. & Kim, H. C. Life cycle assessment of connected and automated vehicles: Sensing and computing subsystem and vehicle level effects. Environ. Sci. Technol. 52, 3249–3256 (2018)
2018
-
[14]
& Gaudiot, J.-L
Liu, S., Tang, J., Zhang, Z. & Gaudiot, J.-L. Caad: Computer architecture for autonomous driving. arXiv preprint arXiv:1702.01894 (2017). 21
2017 arXiv
-
[15]
Lin, S.-C. et al. The architectural implications of autonomous driving: Constraints and accel- eration. In Proceedings of the Twenty-Third International Conference on Architectural Support for Programming Languages and Operating Systems , 751–766 (ACM, 2018)
2018
-
[16]
Nvidia Drive AGX Pegasus
Nvidia. Nvidia Drive AGX Pegasus. https://www.nvidia.com/en-us/ self-driving-cars/drive-platform/hardware/ (2018). Accessed: 20- October-2018
2018
-
[17]
Tesla Shares Details of its New Self-Driving Chipset at Autonomy Investor Day’
Eric Walz. Tesla Shares Details of its New Self-Driving Chipset at Autonomy Investor Day’. https://www.futurecar.com/3153/ Tesla-Shares-Details-of-its-New-Self-Driving-Chipset-at-Autonomy-Investor-Day (2019). Accessed: 30-April-2019
2019
-
[18]
& Watkins, S
Chowdhury, H., Alam, F., Khan, I., Djamovski, V . & Watkins, S. Impact of vehicle add-ons on energy consumption and greenhouse gas emissions. Procedia Eng. 49, 294–302 (2012)
2012
-
[19]
& Meier, A
Chen, Y . & Meier, A. Fuel consumption impacts of auto roof racks.Energy Policy92, 325–333 (2016)
2016
-
[20]
Liu, J., Kockelman, K. M. & Nichols, A. Anticipating the emissions impacts of smoother driving by connected and autonomous vehicles, using the moves model. In Transportation Research Board 96th Annual Meeting (2016)
2016
-
[21]
Prakash, N., Cimini, G., Stefanopoulou, A. G. & Brusstar, M. J. Assessing fuel economy from automated driving: influence of preview and velocity constraints. In ASME 2016 Dy- 22 namic Systems and Control Conference , V002T19A001–V002T19A001 (American Society of Mechanical Engin...
2016
-
[22]
Mersky, A. C. & Samaras, C. Fuel economy testing of autonomous vehicles. Transport. Res. C-Emer .65, 31–48 (2016)
2016
-
[23]
Gao, Z. et al. Evaluation of electric vehicle component performance over eco-driving cycles. Energy 172, 823–839 (2019)
2019
-
[24]
Certificate Summary Information Report, TESLA MOTORS: MODEL 3 LONG RANGE, 02/28/2019
United States Environmental Protection Agency. Certificate Summary Information Report, TESLA MOTORS: MODEL 3 LONG RANGE, 02/28/2019. https://iaspub.epa. gov/otaqpub/display_file.jsp?docid=46968&flag=1 (2019). Accessed: 30- April-2019
2019
-
[25]
Brad Templeton. Elon Musk’s War On LIDAR: Who Is Right And Why Do They Think That? https://www.forbes.com/sites/bradtempleton/2019/05/06/ elon-musks-war-on-lidar-who-is-right-and-why-do-they-think-that/ 7fe42c4f2a3b (2019). Accessed: 10-June-2019
2019
-
[26]
G., Henrion, M
Morgan, M. G., Henrion, M. & Small, M. Uncertainty: a guide to dealing with uncertainty in quantitative risk and policy analysis (Cambridge university press, 1992)
1992
-
[27]
& Winter, M
Placke, T., Kloepsch, R., Duehnen, S. & Winter, M. Lithium ion, lithium metal, and alternative rechargeable battery technologies: the odyssey for high energy density. J. Solid State Electr . 21, 1939–1964 (2017). 23
2017
-
[28]
& Viswanathan, V
Sripad, S., Kulandaivel, S., Pande, V ., Sekar, V . & Viswanathan, V . Vulnerabilities of electric vehicle battery packs to cyberattacks. arXiv preprint arXiv:1711.04822 (2017)
2017 arXiv
-
[29]
EV Consumer Study
Lindland, R. EV Consumer Study. https://www.eia.gov/conference/2017/ pdf/presentations/rebecca_lindland.pdf (2017)
2017
-
[30]
Taxi Drivers, Ride-Hailing Drivers, and Chauffeurs
BLS. Taxi Drivers, Ride-Hailing Drivers, and Chauffeurs. https://www. bls.gov/ooh/transportation-and-material-moving/mobile/ taxi-drivers-and-chauffeurs.htm (2018). Accessed: 20-February-2019
2018
-
[31]
Anderson, J. M. et al. Autonomous vehicle technology: A guide for policymakers (Rand Corporation, 2014)
2014
-
[32]
Tesla Model 3
Tesla, Inc. Tesla Model 3. https://www.tesla.com/model3 (2019). Accessed: 30- April-2019
2019
-
[33]
& Wang, C.-Y
Srinivasan, V . & Wang, C.-Y . Analysis of electrochemical and thermal behavior of li-ion cells. J. Electrochem. Soc. 150, A98–A106 (2003)
2003
-
[34]
Fang, W., Kwon, O. J. & Wang, C.-Y . Electrochemical–thermal modeling of automotive li- ion batteries and experimental validation using a three-electrode cell. Int. J. Energy Res. 34, 107–115 (2010)
2010
-
[35]
& Wang, C.-Y
Smith, K. & Wang, C.-Y . Power and thermal characterization of a lithium-ion battery pack for hybrid-electric vehicles. J. Power Sources 160, 662–673 (2006). 24
2006
-
[36]
& Wang, C.-Y
Yang, X.-G., Leng, Y ., Zhang, G., Ge, S. & Wang, C.-Y . Modeling of lithium plating induced aging of lithium-ion batteries: Transition from linear to nonlinear aging. J. Power Sources 360, 28–40 (2017). Acknowledgements This work was supported by the CMU College of Engineerin...
2017
Reviewed August 14, 2026 · model on record in the stance chip above.
Discussion (0). Continue with ORCID to comment.