REVIEW 2 major objections 6 minor 22 references
Atlas: A Dataset and Benchmark for E-commerce Clothing Product Categorization
T0 review · 2 major / 6 minor · reviewed 2026-08-14 · deepseek-v4-flash
Pith's one-line read This paper introduces Atlas, a public dataset of 186,150 clothing images with a 52-leaf taxonomy, and benchmarks image-only categorization at a 0.92 micro F-score.
desk verdict A useful dataset release whose benchmark number is questionable until the split is clarified. read the letter →
The pith
A machine-rendered reading of the paper's core claim, the machinery that carries it, and where it could break.
The reading
What carries the argument
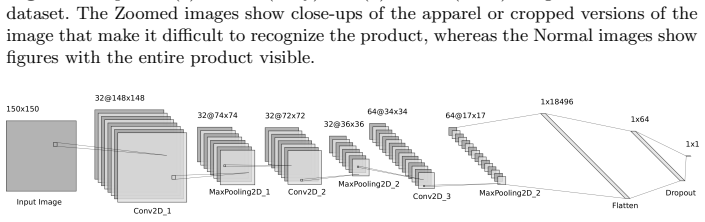
The load-bearing object is the Atlas dataset itself: 186,150 images with 52 category paths under a three-level taxonomy built by clustering similar retailer breadcrumbs. Two mechanisms carry the benchmark. First, a two-class CNN filter, called the Zoomed Versus Normal model, is trained on visually inspected thumbnails to remove close-up or cropped images that would otherwise corrupt the dataset. Second, the benchmark models: a ResNet-34 classifier with adaptive pooling, and an attention-based sequence-to-sequence model in which a ResNet-101 encoder produces a $14 \times 14 \times 2048$ feature map and an LSTM decoder with soft attention predicts the category path as a token sequence from a start marker to an end marker, using beam search at inference.
What would settle it
Take a random sample of Atlas test images, have independent annotators assign the 52 leaf categories without seeing the stored labels, and measure agreement against the dataset labels; low agreement would mean the reported F-scores partly reflect label noise rather than categorization accuracy.
Extended reading notes
Core claim
The central claim is that Atlas is a clean, usable dataset for e-commerce clothing categorization and that standard visual models perform well on it: the ResNet-34 image classifier obtains a micro F-score of 0.92 over 52 leaf categories, while the attention-based encoder-decoder, which predicts the category path level by level from a ResNet-101 image encoding, obtains 0.90. The paper also claims the attention model offers an explanation for predictions by focusing on different image regions, such as the face for gender and the garment area for later levels, and that it can propose new category paths, though only 2 of 5 generated paths were valid, so manual inspection is needed. This establishes a baseline rather than a solution; the authors position Atlas as an invitation for the community to improve on these numbers.
Load-bearing premise
The dataset labels are derived from retailer website breadcrumbs that were manually mapped to the paper's taxonomy; if any mapped breadcrumb is wrong or the mapping is inconsistent across stores, the labels are noisy and the reported F-scores no longer measure what they appear to.
Editorial extensions
If this is right
- Future methods can be compared directly on fixed 65/5/30 splits, since Atlas fixes the taxonomy and the test set.
- The zoomed-versus-normal filtering step shows that a small binary CNN can remove unrepresentative product images with an average F-score of 0.98, a reusable cleaning step.
- The attention-based sequence model reaches a 0.90 micro F-score and produces attention maps that indicate which image region supports each category level.
- The sequence model generates novel category paths, but only 2 of 5 it produced were valid, so manual review is required before enriching the taxonomy.
Reading between the lines
- If the labels survive independent audit, the 0.92 image-only baseline suggests the ceiling for 52 well-separated clothing categories is already close to practical accuracy, and further gains should come from difficult confusable pairs rather than model capacity.
- Constraining the decoder to output only legal child categories would directly test whether invalid path generation is avoidable; this is measurable against the paper's reported 2-of-5 validity.
- Because the taxonomy includes Indian ethnic-wear categories, Atlas can serve as a domain-shift test for models trained on Western fashion images.
- Product titles and prices were collected alongside images but are not used by the benchmark models; a multimodal model using both could be compared against the 0.92 image-only number.
Signed reviews
Editorial analysis
A structured set of objections, weighed in public.
Referee Report
Summary. The paper introduces Atlas, a clothing product image dataset of 186,150 images organized into a three-level taxonomy with 52 leaf category paths, collected by crawling Indian e-commerce product listings and manually mapping store breadcrumbs to a custom taxonomy. The authors describe a zoomed-vs-normal image filtering step, then present two benchmarks: a ResNet-34 image classifier and an attention-based CNN-LSTM sequence-to-sequence model that predicts category paths. On a 65/5/30 split, they report a micro F-score of 0.92 for the classifier and 0.90 for the sequence model. The dataset, code, and pre-trained models are publicly released.
Significance. If the reported performance is a valid estimate of generalization to new products, Atlas would be a useful, reproducible benchmark for image-based e-commerce product categorization, and the public release of data, code, and training configurations is a concrete strength. The paper also provides a plausible, extensible methodology for building similar taxonomy datasets. However, the central empirical claim depends on two load-bearing assumptions: that the train/test split prevents leakage of the same product across splits, and that the crawled breadcrumb-derived labels are accurate. These are asserted but not demonstrated, so the headline 0.92 F-score should currently be treated as unverified.
major comments (2)
- [Section 6, with Section 3.3] The reported benchmark numbers may not measure generalization to new products because the split appears to be image-level, not product-level. Section 6 states that the train/validation/test split was produced by stratified random sampling on the dataset, giving 119,155 training images, 11,147 validation images, and 55,848 test images; Section 3.3 explicitly notes that an e-commerce listing often contains several images of a single product. If multiple images of the same product are distributed across train and test, the model can exploit near-duplicate appearance, and the reported 0.92 micro-F becomes an overestimate of performance on unseen products. The paper does not mention product IDs, deduplication, or a product-level split. Please report whether the splits are grouped by product, and either provide a product-level split or demonstrate that no product appears in both training and test sets.
- [Section 3.2] The ground-truth labels are created by manually mapping each retailer's breadcrumb path to the authors' custom taxonomy, but no label-quality measurement is reported. If retailer breadcrumbs are wrong or the manual mapping is inconsistent, the labels are noisy and the F-scores do not measure what they claim. The paper should report an audit of the labeling process, such as inter-annotator agreement on a sample, a manual verification of a random subset, or a quantitative comparison against an independent label source. Without this, the 'high-quality dataset' claim is not yet supported.
minor comments (6)
- [Section 3, first paragraph] The text says 'Our dataset contains data corresponding to 52 products' but the rest of the paper consistently describes 52 category paths (leaf nodes), not 52 products. This should be corrected to avoid confusion.
- [Section 6] Please define micro-F precisely: is it computed on the leaf-level category, on full path accuracy, or on per-level token predictions? For the sequence model, a path is only correct if all levels are correct, so the metric definition matters for interpreting the 0.92 versus 0.90 comparison.
- [Section 6] The results are reported as single numbers without error bars or repeated runs. Given that the two models differ by only two points, a small number of independent runs with mean and standard deviation would make the benchmark comparison more informative.
- [Section 3.3] The zoomed-vs-normal filter is a key data-cleaning step, but the paper does not report the size or construction of the test set used for Table 1, nor how the 6005 normal and 1054 zoomed training images were split. Please clarify whether the filter's test set is disjoint from the final Atlas train/test split.
- [Section 5.1] The beam width is said to be chosen 'based on our experiments,' but no sweep or resulting F-scores are reported. Please provide the evaluated beam widths and the corresponding performance, or state that the choice had negligible effect.
- [Section 3.3] There is a typo: 'contors' should be 'contours.'
Circularity Check
No significant circularity: the benchmark is an empirical measurement on a held-out test set.
full rationale
The paper's central claim is an empirical benchmark: ResNet-34 and Seq2Seq models are trained on a training split and scored on a held-out test split (Section 6), with no parameter fitted to the test labels. The dataset labels are produced from external retailer breadcrumbs manually mapped to the authors' taxonomy (Sections 3.1-3.2), not from the benchmark models, so label construction does not predetermine the reported F-scores. There are no load-bearing self-citations or imported uniqueness theorems. Concerns raised in review, such as possible product-level leakage from image-level splitting or label noise from breadcrumb mapping, are data-quality and evaluation-validity issues rather than circularity: they do not make the reported numbers equal to an input by construction. Therefore the paper warrants a 0 circularity score.
Assumptions & free parameters
free parameters (4)
- Beam width =
5
- SVM regularization C =
0.0001
- Encoder/decoder learning rates =
1e-4 and 4e-4
- Zoomed-vs-normal filter training set composition =
6,005 normal and 1,054 zoomed
assumptions (4)
- domain assumption Retailer breadcrumbs and the manually constructed mapping to the custom taxonomy provide correct category labels.
- domain assumption The zoomed-versus-normal CNN trained on 6,005 and 1,054 manually labeled images reliably cleans the full dataset.
- domain assumption Stratified image-level splitting produces independent train and test sets.
- domain assumption Pretrained ImageNet weights transfer appropriately to clothing images.
Cite this review
Pith. "Pith review of Atlas: A Dataset and Benchmark for E-commerce Clothing Product Categorization." pith.science (2026). https://pith.science/paper/YQBG4ANL
@misc{pith2026190808984,
  author       = {Pith},
  title        = {Pith review of: Atlas: A Dataset and Benchmark for E-commerce Clothing Product Categorization},
  year         = {2026},
  howpublished = {\url{https://pith.science/paper/YQBG4ANL}},
  note         = {Machine review of arXiv:1908.08984}
}
read the original abstract
In E-commerce, it is a common practice to organize the product catalog using product taxonomy. This enables the buyer to easily locate the item they are looking for and also to explore various items available under a category. Product taxonomy is a tree structure with 3 or more levels of depth and several leaf nodes. Product categorization is a large scale classification task that assigns a category path to a particular product. Research in this area is restricted by the unavailability of good real-world datasets and the variations in taxonomy due to the absence of a standard across the different e-commerce stores. In this paper, we introduce a high-quality product taxonomy dataset focusing on clothing products which contain 186,150 images under clothing category with 3 levels and 52 leaf nodes in the taxonomy. We explain the methodology used to collect and label this dataset. Further, we establish the benchmark by comparing image classification and Attention based Sequence models for predicting the category path. Our benchmark model reaches a micro f-score of 0.92 on the test set. The dataset, code and pre-trained models are publicly available at \url{https://github.com/vumaasha/atlas}. We invite the community to improve upon these baselines.
Figures


Figures from the paper (2 more)


Reference graph
Works this paper leans on
-
[1]
In: Asian conference on computer vi- sion
Bossard, L., Dantone, M., Leistner, C., Wengert, C., Quack, T., Van Gool, L.: Apparel classification with style. In: Asian conference on computer vi- sion. pp. 321–335. Springer (2012)
work page 2012
-
[2]
In: European conference on computer vision
Chen, H., Gallagher, A., Girod, B.: Describing clothing by semantic at- tributes. In: European conference on computer vision. pp. 609–623. Springer (2012)
work page 2012
-
[3]
Das, P., Xia, Y., Levine, A., Di Fabbrizio, G., Datta, A.: Web-scale language-independent cataloging of noisy product listings for e-commerce. In: Proceedings of the 15th Conference of the European Chapter of the As- sociation for Computational Linguistics: Volume 1, Long Papers. vol. 1, pp. 969–979 (2017)
work page 2017
-
[4]
In: Proceedings of the 5th international conference on business information systems (2002)
Ding, Y., Korotkiy, M., Omelayenko, B., Kartseva, V., Zykov, V., Klein, M., Schulten, E., Fensel, D.: Goldenbullet: Automated classification of product data in e-commerce. In: Proceedings of the 5th international conference on business information systems (2002)
work page 2002
-
[5]
Dumais, S., Chen, H.: Hierarchical classification of web content. In: Proceed- ings of the 23rd annual international ACM SIGIR conference on Research and development in information retrieval. pp. 256–263. ACM (2000)
work page 2000
-
[6]
Ha, J.W., Pyo, H., Kim, J.: Large-scale item categorization in e-commerce using multiple recurrent neural networks. In: Proceedings of the 22nd ACM SIGKDD International Conference on Knowledge Discovery and Data Min- ing. pp. 107–115. ACM (2016)
work page 2016
-
[7]
In: Proceedings of the IEEE conference on computer vision and pattern recognition
He, K., Zhang, X., Ren, S., Sun, J.: Deep residual learning for image recog- nition. In: Proceedings of the IEEE conference on computer vision and pattern recognition. pp. 770–778 (2016)
2016
-
[8]
Hiramatsu, M., Wakabayashi, K.: Encoder-decoder neural networks for tax- onomy classification. In: eCOM@SIGIR. CEUR Workshop Proceedings, vol. 2319. CEUR-WS.org (2018)
work page 2018
Show all 22 references
-
[9]
In: Proceedings of the IEEE conference on computer vision and pattern recognition
Karpathy, A., Fei-Fei, L.: Deep visual-semantic alignments for generating image descriptions. In: Proceedings of the IEEE conference on computer vision and pattern recognition. pp. 3128–3137 (2015)
2015
-
[10]
In: European conference on computer vision
Kiapour, M.H., Yamaguchi, K., Berg, A.C., Berg, T.L.: Hipster wars: Dis- covering elements of fashion styles. In: European conference on computer vision. pp. 472–488. Springer (2014)
2014
-
[11]
In: Proceedings of the 2015 Conference of the North Ameri- can Chapter of the Association for Computational Linguistics: Human Lan- guage Technologies
Kozareva, Z.: Everyone likes shopping! multi-class product categorization for e-commerce. In: Proceedings of the 2015 Conference of the North Ameri- can Chapter of the Association for Computational Linguistics: Human Lan- guage Technologies. pp. 1329–1333 (2015)
2015
-
[12]
In: Advances in neural information pro- cessing systems
Krizhevsky, A., Sutskever, I., Hinton, G.E.: Imagenet classification with deep convolutional neural networks. In: Advances in neural information pro- cessing systems. pp. 1097–1105 (2012) 12 V. Umaashankar et al
2012
-
[13]
In: eCOM@SIGIR
Li, M.Y., Kok, S., Kok, S.: Unconstrained product categorization with sequence-to-sequence models. In: eCOM@SIGIR. CEUR Workshop Pro- ceedings, vol. 2319. CEUR-WS.org (2018)
2018
-
[14]
arXiv preprint arXiv:1812.05774 (2018)
Li, M.Y., Kok, S., Tan, L.: Don’t classify, translate: Multi-level e- commerce product categorization via machine translation. arXiv preprint arXiv:1812.05774 (2018)
2018 arXiv
-
[15]
In: eCOM@SIGIR
Lin, Y., Das, P., Datta, A.: Overview of the SIGIR 2018 ecom rakuten data challenge. In: eCOM@SIGIR. CEUR Workshop Proceedings, vol. 2319. CEUR-WS.org (2018)
2018
-
[16]
In: Proceedings of the IEEE conference on computer vision and pattern recognition
Liu, Z., Luo, P., Qiu, S., Wang, X., Tang, X.: Deepfashion: Powering robust clothes recognition and retrieval with rich annotations. In: Proceedings of the IEEE conference on computer vision and pattern recognition. pp. 1096– 1104 (2016)
2016
-
[17]
In: Proceedings of the 38th Interna- tional ACM SIGIR Conference on Research and Development in Informa- tion Retrieval
McAuley, J., Targett, C., Shi, Q., Van Den Hengel, A.: Image-based recom- mendations on styles and substitutes. In: Proceedings of the 38th Interna- tional ACM SIGIR Conference on Research and Development in Informa- tion Retrieval. pp. 43–52. ACM (2015)
2015
-
[18]
In: Proceedings of the 21st ACM international conference on Information and knowledge management
Shen, D., Ruvini, J.D., Sarwar, B.: Large-scale item categorization for e- commerce. In: Proceedings of the 21st ACM international conference on Information and knowledge management. pp. 595–604. ACM (2012)
2012
-
[19]
In: 2017 IEEE Winter Conference on Applications of Computer Vision (WACV)
Smith, L.N.: Cyclical learning rates for training neural networks. In: 2017 IEEE Winter Conference on Applications of Computer Vision (WACV). pp. 464–472. IEEE (2017)
2017
-
[20]
Neural computation 1(2), 270–280 (1989)
Williams, R.J., Zipser, D.: A learning algorithm for continually running fully recurrent neural networks. Neural computation 1(2), 270–280 (1989)
1989
-
[21]
arXiv preprint arXiv:1609.08144 (2016)
Wu, Y., Schuster, M., Chen, Z., Le, Q.V., Norouzi, M., Macherey, W., Krikun, M., Cao, Y., Gao, Q., Macherey, K., et al.: Google’s neural ma- chine translation system: Bridging the gap between human and machine translation. arXiv preprint arXiv:1609.08144 (2016)
2016 arXiv
-
[22]
In: International conference on machine learning
Xu, K., Ba, J., Kiros, R., Cho, K., Courville, A., Salakhudinov, R., Zemel, R., Bengio, Y.: Show, attend and tell: Neural image caption generation with visual attention. In: International conference on machine learning. pp. 2048–2057 (2015)
2015
Reviewed August 14, 2026 · model on record in the stance chip above.
Discussion (0). Continue with ORCID to comment.