REVIEW 2 major objections 6 minor 17 references
Temporal and Spatial Evolutions of a Large Sunspot Group and Great Auroral Storms around the Carrington Event in 1859
T0 review · 2 major / 6 minor · reviewed 2026-08-14 · deepseek-v4-flash
Pith's one-line read The 1859 Carrington storm was extreme but not unique.
desk verdict Solid historical reconstruction that adds genuine new primary sources and strengthens the case that Carrington was one of several extreme storms, though the comparative table needs an uncertainty analysis before its precise ranking is used. read the letter →
The pith
A machine-rendered reading of the paper's core claim, the machinery that carries it, and where it could break.
The reading
What carries the argument
The machinery is the equatorward boundary of the auroral oval expressed in invariant latitude (ILAT), the footprint latitude of the magnetic-field line on which auroral electrons travel. Because this boundary correlates empirically with the Dst storm index, comparing ILAT values across historical events lets the paper rank storms of very different eras on a single scale. To get those values, the paper converts archival visual aurora reports into site magnetic latitudes with the GUFM1 geomagnetic field model, then uses reported elevation angles and an assumed auroral altitude of up to 400 km to infer how far equatorward the oval itself extended; the same conversion is applied to the 1872, 1909, 1921, and 1989 events so that the comparison is internally consistent.
What would settle it
Recompute the 1859 September 1/2 oval boundary from the same visual reports while varying the assumed auroral altitude from 100 to 600 km and propagating elevation-angle errors; if plausible altitudes put the boundary at or below 24.2 degrees invariant latitude, the ranking that places 1872 ahead of 1859 collapses.
Extended reading notes
Core claim
The paper's central discovery is that the Carrington event, long treated as the benchmark extreme storm, is better understood as one member of a small family of comparable superstorms. Reconstructed from newly recovered auroral reports in the Russian Empire, Ireland, Iberia, Oceania, Mexico, and Japan, the September 1859 storm's auroral oval reached an equatorward boundary of about 28.5°/30.8° invariant latitude, with auroral visibility down to about 20.5°/21.8° magnetic latitude. The same reconstruction applied to the 1872 February, 1909 September, 1921 May, and 1989 March events gives boundaries of 24.2°, 31.6°, 27.1°, and 35°/40.1° invariant latitude respectively, so the Carrington event ranks third by auroral extent rather than first. Supported by sunspot drawings showing the source active region was a large, complex, likely delta-configuration group that produced two storms, and by magnetograms showing auroral visibility tracking the storm phases, the paper concludes that the Carrington event was "probably not the exceptional extreme storm, but one of the most extreme magnetic storms."
Load-bearing premise
The ranking of storms rests on assuming the 1859 aurora could be as high as 400 km and that reported elevation angles are accurate enough to convert visual sightings into an oval boundary.
Editorial extensions
If this is right
- The Carrington event should be treated as a member of a family of Carrington-class superstorms rather than as the unique worst case, so worst-case space-weather scenarios should be built from the 1872 and 1921 events too.
- The September 1859 storm's Dst was probably near -900 nT (with uncertainty +50/-150), comparable to the 1921 storm, not an off-scale outlier.
- Storms with auroral ovals reaching below about 31 degrees invariant latitude occurred at least five times between 1859 and 1989, suggesting a higher recurrence rate than a once-per-century benchmark.
- Because aurorae remained visible at mid-low latitudes during the recovery phase, the disturbance to ionospheric currents and ground-based systems lasted longer than the main-phase peak alone.
Reading between the lines
- One implication the paper leaves implicit is that the ranking is only as stable as the assumed auroral altitude; recomputing all five oval boundaries with a range of plausible altitudes (say 100-600 km) could reorder 1859, 1921, and 1909 even if the broad conclusion stands.
- The same visual-report-to-oval pipeline could be extended backward to candidate superstorms in the 18th century, such as the 1770 and 1730 auroral events, producing a homogeneous multi-century ranking that the paper's table does not yet include.
- If satellite-era measurements of auroral altitude at low latitudes were substituted for the fixed 400 km assumption, the comparison could be given formal error bars and tested for sensitivity to the single most uncertain input.
- The paper's timing argument implies that the Eastern Hemisphere's daytime gap in visual reports, rather than weaker storm intensity, explains why fewer auroral reports survive for the September storm's main phase; this could be tested by checking whether the same longitude asymmetry appears in the 1872 event.
Signed reviews
Editorial analysis
A structured set of objections, weighed in public.
Referee Report
Summary. This paper revisits the 1859 Carrington event by combining newly recovered sunspot drawings (Schwabe, Secchi, Carrington) and a broad set of visual auroral reports from the Russian Empire, Japan, Iberia, Oceania, Mexico, and other regions. The authors construct a time series of auroral visibility and compare it with contemporary magnetograms from Bombay/Colaba and Russian stations. They then estimate the equatorward boundary of the auroral oval during the August and September 1859 storms and compare these boundaries with those of the 1872, 1909, 1921, and 1989 extreme storms. The paper concludes that the Carrington event is 'probably not the exceptional extreme storm, but one of the most extreme magnetic storms.'
Significance. The archival work is a genuine contribution: it introduces new primary sources that fill geographic gaps in the 1859 auroral record and provide independent corroboration of Carrington's sunspot drawing. The authors are transparent about several important caveats, marking preliminary single-station Dst values and the Honolulu dating uncertainty. If the comparative ranking in Table 1 is robust, the paper would provide a valuable quantitative context for the Carrington event and caution against treating it as a unique worst-case. However, the central comparative claim is only as strong as the ILAT estimates in Table 1, which currently lack a common reduction and uncertainty quantification; a sensitivity analysis is needed to determine whether the ranking is robust.
major comments (2)
- [Section 5, Table 1] The conclusion in Section 6 that the Carrington event is 'probably not the exceptional extreme storm, but one of the most extreme magnetic storms' rests on the equatorward-boundary ILAT values in Table 1, which are not derived with a common, uncertainty-quantified method. The 1859 September value assumes an auroral elevation up to 400 km (Section 4 and Hayakawa et al. 2018b), the 1909 value is based on a 30° elevation angle at Matsuyama, the 1921 value is newly derived here from a 22° reported altitude at Apia without a stated emission height, and the 1989 value is based on particle precipitation and electric-field boundaries rather than visual aurora. For low-elevation observations, varying the assumed emission height between 100 and 400 km changes the inferred ILAT by several degrees, and the gaps among the 1859 (28.5/30.8), 1921 (27.1), and 1872 (24.2) values are of the same order. Because no uncertainties or sensitivity analysis are reported for these ILAT values, the ranking that makes 1859 'not unique' is not established by the evidence presented.
- [Section 5, 1921 entry] The newly reconstructed 1921 oval boundary of 27.1° ILAT is a key data point in the comparison, but the derivation is not documented. The paper quotes the 22° reported altitude at Apia and immediately states the resulting ILAT without giving the assumed auroral height, the field-line mapping, or the geometric calculation. Since this value is introduced in the present work, the calculation should be shown explicitly and its sensitivity to the assumed height should be quantified.
minor comments (6)
- [Table 1] The entry '≥ −484*' for the 1859 August storm is ambiguous because Dst is usually negative; '≥ −484' could be misread as indicating a weaker storm, and '≤ −484' or '≲ −484' would be clearer.
- [Reference list] The entry for Farrona et al. (2011) ends with a stray 'Gonzalez et al., 2011' that should be deleted.
- [Reference list] The entry for Hayakawa et al. (2016) repeats the article title twice; the duplicate title should be removed.
- [Section 6, Conclusion] 'complimentarily' should be 'complementarily'.
- [Section 5, paragraph on Dst] 'although this a single station measurement' should be 'although this is a single-station measurement'.
- [Section 4, paragraph describing auroral visibility bands] The phrase 'assuming an auroral elevation up to 400 km' does not specify the exact height used for converting observed elevations to MLAT/ILAT; a single reference height with a sensitivity test would improve reproducibility.
Circularity Check
No significant circularity: the Carrington-event comparison is an empirical synthesis of independent archival reconstructions, not a derivation that reduces to its inputs.
full rationale
The paper's central claim is that the Carrington event was not unique, based on the equatorward boundary of the auroral oval in Table 1 (28.5/30.8 ILAT for 1859 versus 24.2, 27.1, and 31.6 ILAT for 1872, 1921, and 1909). These values are not fitted parameters or definitions. The 1859 values are taken from Hayakawa et al. (2018b), which reconstructed them from contemporary auroral reports and an explicitly stated assumption of auroral elevation up to 400 km; the 1872 and 1909 values come from Hayakawa et al. (2018a, 2019a), each based on independent primary reports (overhead aurora at Shanghai/Jacabad and a 30-degree elevation at Matsuyama); the 1921 value is computed in this work from the Apia elevation angle reported by Angenheister and Westland (1921) using IGRF. The Dst values are taken from independent magnetogram analyses (Siscoe et al., 2006; Love et al., 2019a,b). The empirical correlation of Yokoyama et al. (1998) is used only to argue consistency, not to generate the ranking. No equation in the paper defines a target quantity in terms of the conclusion, and no parameter is fitted to data and then renamed a prediction. The self-citations to the authors' earlier papers are load-bearing in the sense that the comparison table relies on them, but those papers contain their own primary historical evidence and are externally falsifiable; they are not unverified assertions invoked to close an argument. The legitimate weakness is uncertainty in the geometric conversions (assumed auroral height, reported elevation angles, field model), which is a correctness/sensitivity concern, not circularity. Hence the paper is essentially self-contained against external benchmarks, with score 1 reflecting only the heavy reliance on the authors' own prior reconstructions.
Assumptions & free parameters
free parameters (1)
- Assumed auroral altitude for boundary conversion =
400 km
assumptions (5)
- domain assumption The GUFM1 geomagnetic field model accurately describes the 1859 magnetic field at the observation sites.
- domain assumption The historical reports in newspapers, diaries, and observatory yearbooks accurately record auroral sightings, dates, and local times.
- domain assumption The empirical correlation between auroral oval equatorward boundary and Dst (Yokoyama et al., 1998) applies to extreme historical storms.
- domain assumption Sunspot groups identified across Carrington, Schwabe, and Secchi drawings correspond to the same active region.
- domain assumption An auroral altitude of up to 400 km is appropriate for converting low-latitude visual reports to magnetic footprint locations.
Cite this review
Pith. "Pith review of Temporal and Spatial Evolutions of a Large Sunspot Group and Great Auroral Storms around the Carrington Event in 1859." pith.science (2026). https://pith.science/paper/BGCO3I4K
@misc{pith2026190810326,
  author       = {Pith},
  title        = {Pith review of: Temporal and Spatial Evolutions of a Large Sunspot Group and Great Auroral Storms around the Carrington Event in 1859},
  year         = {2026},
  howpublished = {\url{https://pith.science/paper/BGCO3I4K}},
  note         = {Machine review of arXiv:1908.10326}
}
read the original abstract
The Carrington event is considered to be one of the most extreme space weather events in observational history within a series of magnetic storms caused by extreme interplanetary coronal mass ejections (ICMEs) from a large and complex active region (AR) emerged on the solar disk. In this article, we study the temporal and spatial evolutions of the source sunspot active region and visual aurorae, and compare this storm with other extreme space weather events on the basis of their spatial evolution. Sunspot drawings by Schwabe, Secchi, and Carrington describe the position and morphology of the source AR at that time. Visual auroral reports from the Russian Empire, Iberia, Ireland, Oceania, and Japan fill the spatial gap of auroral visibility and revise the time series of auroral visibility in mid to low magnetic latitudes (MLATs). The reconstructed time series is compared with magnetic measurements and shows the correspondence between low to mid latitude aurorae and the phase of magnetic storms. The spatial evolution of the auroral oval is compared with those of other extreme space weather events in 1872, 1909, 1921, and 1989 as well as their storm intensity, and contextualizes the Carrington event, as one of the most extreme space weather events, but likely not unique.
Figures

Reference graph
Works this paper leans on
-
[1]
Original sunspot drawings during the 1859 storms are revealed and analyzed
-
[2]
New auroral reports from Eurasia and Oceania fill the spatial and temporal gaps of the auroral visibility during the 1859 storms
-
[3]
The 1859 storms are compared and contextualized with the other extreme space weather events
-
[4]
Introduction: After the earliest datable observation of a white-light flare in a large sunspot group by Carrington (1859) and Hodgson (1859) on 1859 September 1, humanity experienced one of the most extreme magnetic storms in observational history (Tsurutani et al., 2003; Cliver and Dietrich, 2013). The reported white-light solar flare was followed by a s...
work page 2003
-
[5]
outstanding auroras
Comparison of the Spatial Evolution of the Auroral Ovals for Extreme Events: Having presented an updated view of the temporal evolution of the auroral ovals during the stormy interval around the Carrington event, we can categorize the Carrington event not as an exceptionally outstanding event but as one of the most extreme events by comparison with the sp...
1995
-
[6]
Method: In this article, we review the contemporary observations of the solar surface and reconstruct the time series of auroral visibility during the stormy interval around the Carrington event. For the observations of the solar surface, we consulted the observational logs by Carrington (1863) and his unpublished manuscripts (RAS MS Carrington 1.3 and 3....
2018
-
[7]
The Solar Surface: The storms around the Carrington event occur almost in the maximum of Solar Cycle
-
[9]
until the dawn light dimmed it
Auroral Evolutions and Magnetic Disturbances: The large sunspot group (Group 520 in Carrington, Group 143 in Schwabe, and Group 219 in Secchi) caused a series of interplanetary coronal mass ejections (ICMEs) and a subsequent series of magnetic storms and auroral displays between 1859 August 28 and September 4 (Kimball, 1960; Green and Boardsen, 2006; Lakh...
1960
Show all 17 references
-
[10]
only a glancing below
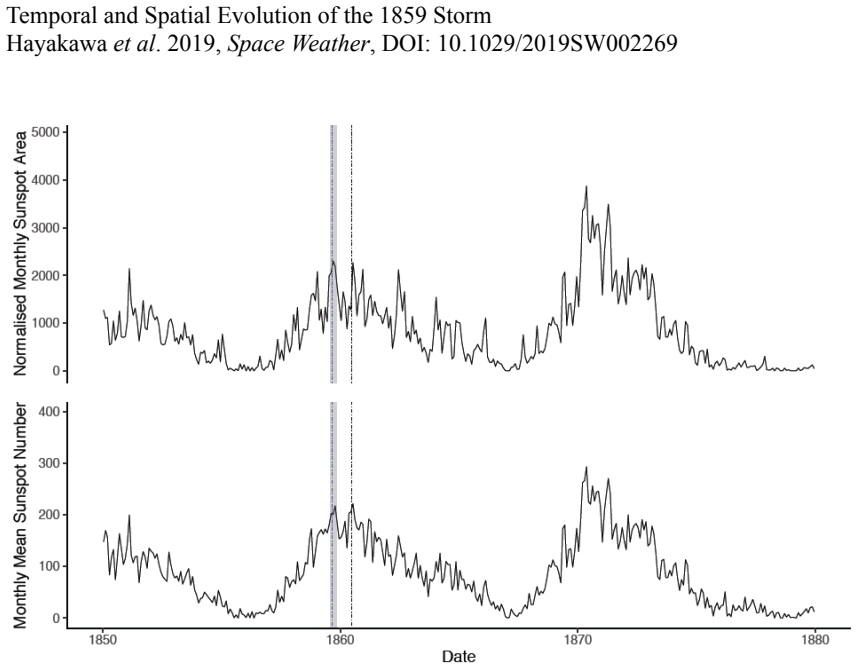
Figure 1 shows the monthly mean value of the total sunspot number (SSN) (Clette et al., 2014; Clette and Lefèvre, 2016), with two peaks in 1859 October (SSN: 218) and 1860 July (SSN: 222). Likewise, the monthly mean value of the smoothed sunspot area (Carrasco et al., 2016) sh...
2006
-
[11]
The extreme magnetic storm of 1-2 September 1859
Conclusion: In this article, we have revised the temporal and spatial evolutions of the auroral displays during the stormy interval around the Carrington event. The contemporary sunspot drawings by Richard Carrington, Heinrich Schwabe, and Father Angelo Secchi showed a large a...
2016
-
[15]
Perfect Storms
DOI: 10.1093/mnras/20.1.13 Carrington, R. C. (1863) Observations of the spots on the sun from November 9, 1853, to March 24, 1861, made at Redhill, London. Chapman, S. (1957) The Aurora in Middle and Low Latitudes, Nature, 179, 4549, 7-11. DOI: 10.1038/179007a0 Cid, C., Palaci...
1957
-
[16]
(2008) On geomagnetic variations during the August September storms of 1859, Advances in Space Research, 42, 1, 171-180
DOI: 10.1016/j.asr.2005.07.076 Nevanlinna, H. (2008) On geomagnetic variations during the August September storms of 1859, Advances in Space Research, 42, 1, 171-180. DOI: 10.1016/j.asr.2008.01.002 Ngwira, C. M., Pulkkinen, A., Leila Mays, M., et al. (2013) Simulation of the 2...
2008 doi
-
[21]
(2012) On the probability of occurrence of extreme space weather events, Space Weather, 10, 2
DOI: 10.1007/s11214-017-0456-3 Riley, P. (2012) On the probability of occurrence of extreme space weather events, Space Weather, 10, 2. DOI: 10.1029/2011SW000734 Schrijver, C. J., Beer, J., Baltensperger, U., et al. (2012) Estimating the frequency of extremely energetic solar ...
2012 doi
-
[187]
F., Cliver, E
DOI: 10.3847/1538-4357/aaf471 Neidig, D. F., Cliver, E. W. (1983) A catalog of solar white-light flares, including their statistical properties and associated emissions, 1859 – 1982, AFGL Technical Report. Neumeyer, G. (1864) Meteorological and Nautical Taken in the Colony of ...
1983 doi
-
[267]
R., Adolphi, F., et al
doi: 10.1007/BF00158405 Mekhaldi, F., McConnell, J. R., Adolphi, F., et al. (2018) No Coincident Nitrate Enhancement Events in Polar Ice Cores Following the Largest Known Solar Storms, Journal of Geophysical Research: Atmospheres, 122, 21, 11,900 -11,913. DOI: 10.1002/2017JD02...
2018 doi
-
[535]
2019, Space Weather, DOI: 10.1029/2019SW002269 34 Silverman, S
DOI: 10.1016/S1364-6826(00)00174-7 Temporal and Spatial Evolution of the 1859 Storm Hayakawa et al. 2019, Space Weather, DOI: 10.1029/2019SW002269 34 Silverman, S. M. (1995) Low latitude auroras: the storm of 25 September 1909, Journal of Atmospheric and Terrestrial Physics, 5...
1995 doi
-
[2018]
2019, Space Weather, DOI: 10.1029/2019SW002269 4 et al., 2006; Smart et al., 2006) rather controversial (Cliver and Dietrich, 2013; Usoskin, 2017)
made the existing estimate of its SEP fluence (e.g., McCracken et al., 2001; Shea Temporal and Spatial Evolution of the 1859 Storm Hayakawa et al. 2019, Space Weather, DOI: 10.1029/2019SW002269 4 et al., 2006; Smart et al., 2006) rather controversial (Cliver and Dietrich, 2013...
2006 doi
Reviewed August 14, 2026 · model on record in the stance chip above.
Discussion (0). Continue with ORCID to comment.