REVIEW 3 major objections 6 minor 37 references
Demystifying Brain Tumour Segmentation Networks: Interpretability and Uncertainty Analysis
T0 review · 3 major / 6 minor · reviewed 2026-08-14 · deepseek-v4-flash
Pith's one-line read Brain tumor segmentation networks learn human-understandable concepts at the filter level and localize tumors from whole brain to fine subregions.
desk verdict A genuinely honest pilot study applying interpretability tools to brain tumor segmentation, but the central claims about disentangled concepts and top-down localization are only qualitatively supported. read the letter →
The pith
A machine-rendered reading of the paper's core claim, the machinery that carries it, and where it could break.
The reading
What carries the argument
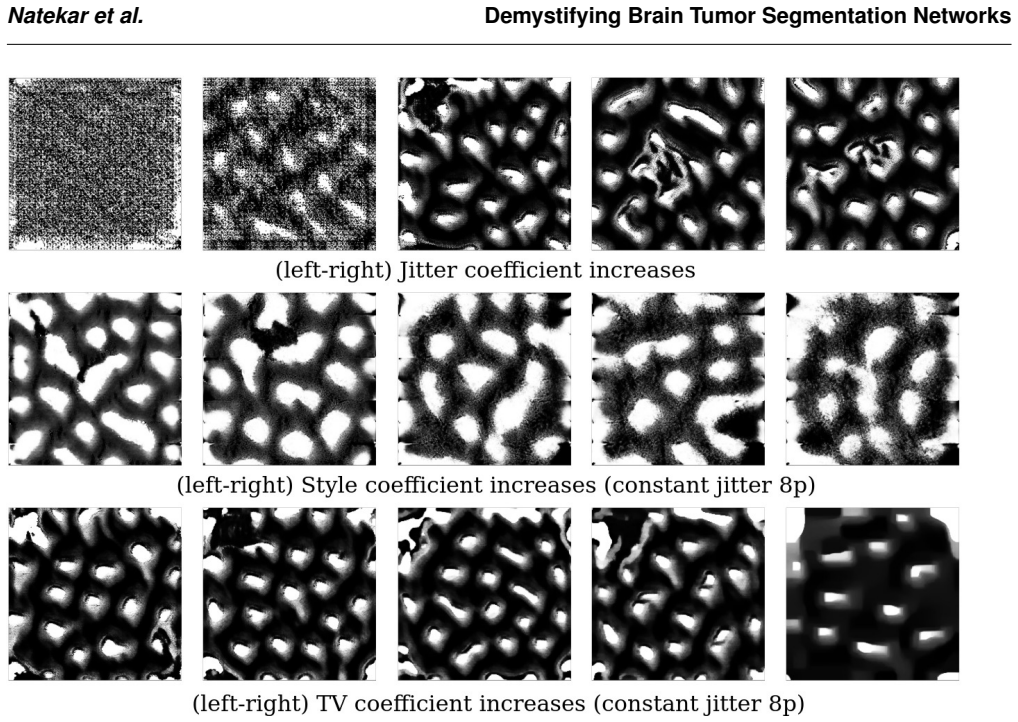
The machinery is network dissection, which turns a filter's activation map into a concept mask by thresholding at the $0.01$ quantile of its dataset-wide activation distribution, post-processing the mask, and scoring it with $\mathrm{IoU}(M_{k,l}(x), gt) \ge c$ against labeled tumor subregions. A detector is declared when the IoU exceeds a threshold $c$. Grad-CAM computes neuron importance weights via gradients of the global-average-pooled segmentation output and produces a ReLU-weighted attention map per layer. Activation maximization with jitter, total-variation, and style regularization constructs pre-images that maximally excite a filter. Test-time dropout approximates Bayesian inference by averaging $T$ stochastic forward passes and estimating the variance. Together these four tools connect individual filters to concepts, trace spatial attention over layers, visualize filter preferences, and quantify prediction confidence.
What would settle it
Retrain the same model architecture on the same BraTS data with several random seeds and rerun network dissection: if the same layer positions do not reproducibly yield the same concept assignments, or if the IoU scores at the 0.01 quantile are no higher than at other quantiles or than scores from randomly permuted filter-to-concept mappings, the filter-level disentanglement is an artifact of the analysis rather than a stable property of the network.
Extended reading notes
Core claim
The authors' claim, stated on their own terms, is that brain tumor segmentation networks do not encode tumor knowledge in an unstructured way: individual filters learn disentangled, human-understandable concepts, with separate filters detecting the whole tumor, edema, and tumor core, and even implicit concepts like white and grey matter that were never part of the training labels. Across three differently structured 2D segmentation networks trained on BraTS 2018, thresholded activation masks from individual filters matched these concepts, and Grad-CAM attention maps showed the networks first fixating on the brain, then the tumor region, then the fine subregions. The paper presents this as evidence that segmentation models take a top-down, hierarchical approach to localization, that skip and residual connections accelerate spatial localization in early layers, and that misclassified regions carry high uncertainty. It does not claim state-of-the-art segmentation accuracy; it claims that these human-understandable traces of inference are present and extractable in ordinary segmentation networks.
Load-bearing premise
The claim of disentangled concepts rests on the assumption that a per-filter activation threshold set at the 0.01 quantile, chosen because it gives the best concept scores, and the visual assignment of unlabeled concepts truly reflect what each filter detects; if the threshold choice and assignment are arbitrary, the apparent concepts could be artifacts.
Editorial extensions
If this is right
- Filter-level concept detectors mean a segmentation prediction can be audited by checking which filters fired, rather than treating the network as an opaque whole.
- Skip and residual connections appear to carry spatial information toward early layers: DenseUnet and ResUnet localize the tumor within their first layers, while the connection-free SimUnet only localizes it near the output.
- The layer-wise attention sequence (background to brain to tumor to fine subregions) implies segmentation networks follow the same global-to-local ordering documented in human visual perception.
- Misclassified tumor regions coincide with high test-time-dropout uncertainty, so uncertainty maps can flag where a radiologist should double-check the model.
Reading between the lines
- The authors' threshold-choice procedure could be turned into a hypothesis test: if filter-to-concept assignments are stable across random initializations and across thresholds away from the hand-picked 0.01 quantile, disentanglement is a property of the task; if not, it is an artifact of the analysis.
- A natural next experiment is to feed the discovered implicit concept masks (brain, white matter) back into the network as auxiliary input channels and measure whether segmentation accuracy improves; that would turn the descriptive claim into a causal one.
- Extending the same pipeline to 3D segmentation models is an open question the authors flag; one could compute concept consistency across adjacent slices to see whether disentanglement survives volumetric inference.
- The correlation between uncertainty and misclassification suggests a concrete clinical workflow: model proposes, uncertainty map highlights, radiologist adjudicates; this workflow's net benefit could be measured against unassisted reading in a reader study.
Editorial analysis
A structured set of objections, weighed in public.
Referee Report
Summary. The paper applies a pipeline of interpretability and uncertainty techniques to three 2D brain tumor segmentation networks (DenseUnet, ResUnet, SimUnet) trained on the BraTS 2018 dataset. The three analysis strands are: network dissection to identify filter-level concepts, Grad-CAM to trace layer-wise spatial attention, and test-time dropout to estimate epistemic uncertainty; activation maximization is also used to visualize filter inputs. The central empirical claims are that individual filters learn human-understandable disentangled concepts (e.g., whole tumor, edema, tumor core, and implicit concepts such as brain or white matter), that the models localize tumors in a top-down hierarchical manner (brain first, then tumor, then fine subregions), that skip/residual connections help early localization, and that misclassified regions are often associated with high uncertainty. The paper is framed as an introductory study and explicitly notes limitations, including the uncertain faithfulness of activation maximization and the difficulty of extending the analysis to 3D models.
Significance. If substantiated, the paper's findings would be valuable for the medical imaging interpretability community: filter-level disentanglement and hierarchical localization in segmentation networks would support the idea that such models can be inspected in human-understandable terms, potentially increasing clinician trust. The paper has several strengths: it applies established interpretability methods (network dissection, Grad-CAM, test-time dropout) to a medically relevant task, compares three architectures in a controlled setting, uses the public BraTS 2018 benchmark, and is candid about the exploratory nature of some results. However, the central claims rest on selective qualitative evidence and post hoc threshold choices rather than systematic quantitative evaluation. The current manuscript therefore does not yet establish the disentanglement and top-down localization assertions, but the gap is addressable with additional analysis rather than being fundamentally unworkable.
major comments (3)
- [3.1, Eq. (2)] The concept-detector criterion is incompletely specified: the IoU threshold c in Eq. (2) is never stated, and the text reports no distribution of IoU values, no number or fraction of filters that pass the threshold, and no breakdown by layer or network. Without these statistics, the statement that 'individual filters learn explicit as well as implicit disentangled concepts' is supported only by selected panels in Figures 2-4. Please report the full statistics: the number of filters evaluated per layer, the distribution of IoU values, the value of c used, and the fraction of filters exceeding c. In addition, provide a null baseline (for example, thresholded random noise masks or filters with shuffled activations) to demonstrate that the observed IoU values cannot be obtained by the thresholding and post-processing procedure alone.
- [3.1, Eq. (1) and post-processing paragraph] The threshold T in Eq. (1) is chosen as the 0.01 quantile because it 'gives the best results' on the same data used for evaluation, and this is a post hoc selection on the test distribution. The post-processing step, which keeps only the largest activated connected component inside the brain, can further inflate IoU for large structures such as the whole tumor, even from noisy activation maps. In addition, the implicit concepts (brain, edema, grey matter) are assigned by visual inspection with no stated protocol or inter-rater validation. Please specify a pre-specified or cross-validated threshold selection procedure, document the concept labeling rule, and report quantitative concept-detection results (mean and standard deviation of IoU, per-concept filter counts) over the entire held-out validation set rather than only selected examples.
- [3.2] The top-down hierarchical localization claim is based on qualitative inspection of selected Grad-CAM maps in Figure 5, with no quantitative attention metric computed over the test set. The assertion that 'attention moves from the brain to the tumor and finally to finer subregions' needs to be substantiated with a layer-wise localization score, such as the overlap of the Grad-CAM map with the brain mask, the whole-tumor mask, and the tumor subregion masks, averaged over all validation volumes for each model. Please also state how the displayed layers and images were selected, and report whether the top-down pattern is consistently observed across the full dataset or only in the shown examples.
minor comments (6)
- [3.1 opening] The phrase 'In-Network Dissection' appears to be missing a space and an article; it should likely read 'In Network Dissection' or 'In the Network Dissection pipeline'.
- [Table 1] The Dice scores in Table 1 are reported as single values without variance; please include standard deviations or confidence intervals, since the 48-volume validation set is large enough to support such statistics.
- [4.2] The regularization coefficients are given as 'approximate values' (λ∼1e-4, γ∼1e-2, ζ∼1e-5) and jitter/rotation parameters as ∼8 pixels and ∼10 degrees; please state the exact values used or provide a sensitivity table, as these choices directly affect the activation-maximization visualizations.
- [Figure 1 caption] The caption contains a typo: 'possiblity' should be 'possibility'.
- [4.2.2, Eq. (7)] The total variation term in Eq. (7) uses square brackets that appear to denote absolute values, but the absolute value operator is not shown; please clarify the notation.
- [5] The claim that misclassified regions are often associated with high uncertainty is supported only by selected examples in Figure 7; please add a quantitative evaluation, for instance comparing the distribution of uncertainty values in correctly versus incorrectly classified voxels across the validation set.
Circularity Check
No significant circularity: the interpretability findings are post-hoc analyses of trained networks; threshold and visual-selection caveats are validity concerns, not definitional circularity.
full rationale
The paper's central claims—filter-level disentangled concepts, top-down hierarchical localization, and uncertainty correlated with misclassification—are empirical observations made on trained networks using externally published interpretability methods (Network Dissection, Grad-CAM, test-time dropout, activation maximization). These claims are not derived from the network outputs by construction: the segmentation ground truths are used only to evaluate extracted concept masks, not to construct the interpretability claims themselves. The only self-citation is the DenseUnet architecture (Shaikh et al., 2017, with overlapping authorship), which is one of three off-the-shelf architectures and is not load-bearing for the interpretability conclusion. The main validity concern is in §3.1, where the 0.01-quantile threshold is explicitly chosen because it 'gives the best results ... in terms of dice score' on the same concepts, and implicit concepts are assigned by visual inspection; consequently, the reported IoU values are not an independent test of disentanglement. Similarly, the hierarchy claim in §3.2 rests on selected Grad-CAM panels. These are selection and threshold artifacts that could inflate apparent specificity, but they do not make any claimed prediction equivalent to its inputs by definition. The paper itself flags a related limitation in §4.2: 'It is still not clear, however, that these are faithful reflections of what the filter is actually detecting.' Under the hard rules, this is a validity limitation, not circularity, so the score is 1.
Assumptions & free parameters
free parameters (4)
- Network dissection activation quantile =
0.01
- Activation maximization regularization coefficients =
lambda≈1e-4, gamma≈1e-2, zeta≈1e-5; jitter shift ≈8 px, rotation ≈10°
- Test-time dropout rate =
0.2
- Monte Carlo sampling passes =
100
assumptions (6)
- domain assumption BraTS 2018 ground truth segmentations are accurate enough to serve as concept labels for core and enhancing tumor.
- domain assumption A filter is a concept detector if its thresholded activation map overlaps the ground-truth mask above a threshold, after the activation quantile is chosen post hoc.
- domain assumption Grad-CAM gradients over global-average-pooled segmentation outputs faithfully indicate the spatial regions the network uses for localization.
- domain assumption Monte Carlo dropout with dropout rate 0.2 approximates epistemic uncertainty.
- domain assumption Activation maximization pre-images, after regularization, are faithful first-order representations of filter function.
- domain assumption 2D slice-level analysis transfers to the 3D segmentation problem.
Cite this review
Pith. "Pith review of Demystifying Brain Tumour Segmentation Networks: Interpretability and Uncertainty Analysis." pith.science (2026). https://pith.science/paper/VKYYLFIO
@misc{pith2026190901498,
  author       = {Pith},
  title        = {Pith review of: Demystifying Brain Tumour Segmentation Networks: Interpretability and Uncertainty Analysis},
  year         = {2026},
  howpublished = {\url{https://pith.science/paper/VKYYLFIO}},
  note         = {Machine review of arXiv:1909.01498}
}
read the original abstract
The accurate automatic segmentation of gliomas and its intra-tumoral structures is important not only for treatment planning but also for follow-up evaluations. Several methods based on 2D and 3D Deep Neural Networks (DNN) have been developed to segment brain tumors and to classify different categories of tumors from different MRI modalities. However, these networks are often black-box models and do not provide any evidence regarding the process they take to perform this task. Increasing transparency and interpretability of such deep learning techniques are necessary for the complete integration of such methods into medical practice. In this paper, we explore various techniques to explain the functional organization of brain tumor segmentation models and to extract visualizations of internal concepts to understand how these networks achieve highly accurate tumor segmentations. We use the BraTS 2018 dataset to train three different networks with standard architectures and outline similarities and differences in the process that these networks take to segment brain tumors. We show that brain tumor segmentation networks learn certain human-understandable disentangled concepts on a filter level. We also show that they take a top-down or hierarchical approach to localizing the different parts of the tumor. We then extract visualizations of some internal feature maps and also provide a measure of uncertainty with regards to the outputs of the models to give additional qualitative evidence about the predictions of these networks. We believe that the emergence of such human-understandable organization and concepts might aid in the acceptance and integration of such methods in medical diagnosis.
Figures


Figures from the paper (11 more)



Reference graph
Works this paper leans on
-
[1]
[Dataset] Bakas, S., Akbari, H., Sotiras, A., Bilello, M., Rozycki, M., Kirby, J., et al. (2017a). Segmentation labels and radiomic features for the pre-operative scans of the tcga-gbm collection. the cancer imaging archive (2017)
work page 2017
-
[2]
Bakas, S., Reyes, M., Jakab, A., Bauer, S., Rempfler, M., Crimi, A., et al. (2018). Identifying the best machine learning algorithms for brain tumor segmentation, progression assessment, and overall survival prediction in the brats challenge. arXiv preprint arXiv:1811.02629
arXiv 2018
-
[3]
Bau, D., Zhou, B., Khosla, A., Oliva, A., and Torralba, A. (2017). Network dissection: Quantifying interpretability of deep visual representations. In Proceedings of the IEEE Conference on Computer Vision and Pattern Recognition. 6541–6549
work page 2017
-
[4]
Beaucousin, V ., Simon, G., Cassotti, M., Pineau, A., Houd´e, O., and Poirel, N. (2013). Global interference during early visual processing: Erp evidence from a rapid global/local selective task. Frontiers in psychology 4, 539
work page 2013
-
[5]
Begoli, E., Bhattacharya, T., and Kusnezov, D. (2019). The need for uncertainty quantification in machine-assisted medical decision making. Nature Machine Intelligence 1, 20
work page 2019
-
[6]
Deng, J., Dong, W., Socher, R., Li, L.-J., Li, K., and Fei-Fei, L. (2009). ImageNet: A Large-Scale Hierarchical Image Database. In CVPR09
work page 2009
-
[7]
Doshi-Velez, F. and Kim, B. (2017). Towards a rigorous science of interpretable machine learning. arXiv preprint arXiv:1702.08608
arXiv 2017
-
[8]
Drozdzal, M., V orontsov, E., Chartrand, G., Kadoury, S., and Pal, C. (2016). The importance of skip connections in biomedical image segmentation. In Deep Learning and Data Labeling for Medical Applications (Springer). 179–187
work page 2016
Show all 37 references
-
[9]
Erhan, D., Bengio, Y ., Courville, A., and Vincent, P. (2009). Visualizing higher-layer features of a deep network. University of Montreal 1341, 1
2009
-
[10]
A., Ko, J., Swetter, S
Esteva, A., Kuprel, B., Novoa, R. A., Ko, J., Swetter, S. M., Blau, H. M., et al. (2017). Dermatologist-level classification of skin cancer with deep neural networks. Nature 542, 115
2017
-
[11]
and Ghahramani, Z
Gal, Y . and Ghahramani, Z. (2016). Dropout as a bayesian approximation: Representing model uncertainty in deep learning. In international conference on machine learning. 1050–1059 Frontiers 15 Natekar et al. Demystifying Brain Tumor Segmentation Networks
2016
-
[12]
H., Bau, D., Yuan, B
Gilpin, L. H., Bau, D., Yuan, B. Z., Bajwa, A., Specter, M., and Kagal, L. (2018). Explaining explanations: An overview of interpretability of machine learning. In 2018 IEEE 5th International Conference on data science and advanced analytics (DSAA) (IEEE), 80–89
2018
-
[13]
S., and Kell, D
Holzinger, A., Biemann, C., Pattichis, C. S., and Kell, D. B. (2017). What do we need to build explainable ai systems for the medical domain? arXiv preprint arXiv:1712.09923 J´egou, S., Drozdzal, M., Vazquez, D., Romero, A., and Bengio, Y . (2017). The one hundred layers tiram...
2017 arXiv
-
[14]
and Yovel, G
Kanwisher, N. and Yovel, G. (2006). The fusiform face area: a cortical region specialized for the perception of faces. Philosophical Transactions of the Royal Society B: Biological Sciences 361, 2109–2128
2006
-
[15]
Kendall, A., Badrinarayanan, V ., and Cipolla, R. (2015). Bayesian segnet: Model uncertainty in deep convolutional encoder-decoder architectures for scene understanding. arXiv preprint arXiv:1511.02680
2015 arXiv
-
[16]
and Gal, Y
Kendall, A. and Gal, Y . (2017). What uncertainties do we need in bayesian deep learning for computer vision? In Advances in neural information processing systems. 5574–5584
2017
-
[17]
S., Goldbaum, M., Cai, W., Valentim, C
Kermany, D. S., Goldbaum, M., Cai, W., Valentim, C. C., Liang, H., Baxter, S. L., et al. (2018). Identifying medical diagnoses and treatable diseases by image-based deep learning. Cell 172, 1122–1131
2018
-
[18]
Kermi, A., Mahmoudi, I., and Khadir, M. T. (2018). Deep convolutional neural networks using u-net for automatic brain tumor segmentation in multimodal mri volumes. In International MICCAI Brainlesion Workshop (Springer), 37–48
2018
-
[19]
Kimchi, R. (2015). The perception of hierarchical structure. Oxford handbook of perceptual organization , 129–149
2015
-
[20]
S., Berens, P., and Wahl, S
Leibig, C., Allken, V ., Ayhan, M. S., Berens, P., and Wahl, S. (2017). Leveraging uncertainty information from deep neural networks for disease detection. Scientific reports 7, 17816
2017
-
[21]
Li, Y ., Wang, N., Liu, J., and Hou, X. (2017). Demystifying neural style transfer. arXiv preprint arXiv:1701.01036
2017 arXiv
-
[22]
H., Jakab, A., Bauer, S., Kalpathy-Cramer, J., Farahani, K., Kirby, J., et al
Menze, B. H., Jakab, A., Bauer, S., Kalpathy-Cramer, J., Farahani, K., Kirby, J., et al. (2014). The multimodal brain tumor image segmentation benchmark (brats). IEEE transactions on medical imaging 34, 1993–2024
2014
-
[23]
Molnar, C. (2018). Interpretable machine learning. A Guide for Making Black Box Models Explainable 7 [Dataset] Mordvintsev, A., Olah, C., and Tyka, M. (2015). Inceptionism: Going deeper into neural networks
2018
-
[24]
Navon, D. (1977). Forest before trees: The precedence of global features in visual perception. Cognitive psychology 9, 353–383
1977
-
[25]
Nguyen, A., Yosinski, J., and Clune, J. (2016). Multifaceted feature visualization: Uncovering the different types of features learned by each neuron in deep neural networks. arXiv preprint arXiv:1602.03616
2016 arXiv
-
[26]
Olah, C., Mordvintsev, A., and Schubert, L. (2017). Feature visualization.Distill doi:10.23915/distill.00007. Https://distill.pub/2017/feature-visualization
2017 doi
-
[27]
Olah, C., Satyanarayan, A., Johnson, I., Carter, S., Schubert, L., Ye, K., et al. (2018). The building blocks of interpretability. Distill doi:10.23915/distill.00010. Https://distill.pub/2018/building-blocks
2018 doi
-
[28]
T., Walsh, V ., and Duchaine, B
Pitcher, D., Charles, L., Devlin, J. T., Walsh, V ., and Duchaine, B. (2009). Triple dissociation of faces, bodies, and objects in extrastriate cortex. Current Biology 19, 319–324
2009
-
[29]
R., Cogswell, M., Das, A., Vedantam, R., Parikh, D., and Batra, D
Selvaraju, R. R., Cogswell, M., Das, A., Vedantam, R., Parikh, D., and Batra, D. (2017). Grad-cam: Visual explanations from deep networks via gradient-based localization. In Proceedings of the IEEE International Conference on Computer Vision. 618–626 16 Natekar et al. Demystif...
2017
-
[30]
Shaikh, M., Anand, G., Acharya, G., Amrutkar, A., Alex, V ., and Krishnamurthi, G. (2017). Brain tumor segmentation using dense fully convolutional neural network. In International MICCAI Brainlesion Workshop (Springer), 309–319
2017
-
[31]
and Chan, T
Strong, D. and Chan, T. (2003). Edge-preserving and scale-dependent properties of total variation regularization. Inverse problems 19, S165
2003
-
[32]
F., Reps, J., Kai, J., Garibaldi, J
Weng, S. F., Reps, J., Kai, J., Garibaldi, J. M., and Qureshi, N. (2017). Can machine-learning improve cardiovascular risk prediction using routine clinical data? PloS one 12, e0174944
2017
-
[33]
Yang, X., Kwitt, R., Styner, M., and Niethammer, M. (2017). Quicksilver: Fast predictive image registration–a deep learning approach. NeuroImage 158, 378–396
2017
-
[34]
R., Wu, T.-L., Sun, L., Shen, W
Zamir, A. R., Wu, T.-L., Sun, L., Shen, W. B., Shi, B. E., Malik, J., et al. (2017). Feedback networks. In Proceedings of the IEEE Conference on Computer Vision and Pattern Recognition. 1308–1317
2017
-
[35]
and Bartels, A
Zeki, S. and Bartels, A. (1998). The autonomy of the visual systems and the modularity of conscious vision. Philosophical Transactions of the Royal Society of London. Series B: Biological Sciences 353, 1911–1914
1998
-
[36]
and Zhu, S.-C
Zhang, Q.-s. and Zhu, S.-C. (2018). Visual interpretability for deep learning: a survey. Frontiers of Information Technology & Electronic Engineering19, 27–39
2018
-
[37]
Zhou, B., Khosla, A., Lapedriza, A., Oliva, A., and Torralba, A. (2014). Object detectors emerge in deep scene cnns. arXiv preprint arXiv:1412.6856 Frontiers 17 Natekar et al. Demystifying Brain Tumor Segmentation Networks 8 SUPPLEMENTARY MATERIAL 8.1 Network Architectures Fig...
2014 arXiv
Reviewed August 14, 2026 · model on record in the stance chip above.
Discussion (0). Continue with ORCID to comment.