REVIEW 2 major objections 3 minor 40 references
Time-to-Event Pretraining for 3D Medical Imaging
T0 review · 2 major / 3 minor · reviewed 2026-08-12 · deepseek-v4-flash
Pith's one-line read Time-to-event pretraining—predicting when each EHR medical code first appears after a CT scan—improves 3D imaging outcome prediction by an average 23.7% AUROC and 29.4% C-index across eight benchmarks, without sacrificing diagnostic…
desk verdict TTE pretraining moves prognostic signal into 3D CT encoders, but the headline gains are inflated by likely overlap between the 8,192 pretraining codes and the 8 benchmark outcomes. read the letter →
The pith
A machine-rendered reading of the paper's core claim, the machinery that carries it, and where it could break.
The reading
What carries the argument
The load-bearing mechanism is the time-to-event task set plus a piecewise exponential neural network (PEANN) survival loss. Each medical code in an ontology knowledge graph is treated as a separate pretraining task whose label is the time from the CT scan to that code's first occurrence; right-censored patients (including those who die before the code appears) still contribute through the survival likelihood. Task selection keeps 8,192 informative codes out of 4.3 million candidates by solving an entropy-based vertex cover over the ontology's directed acyclic graph, following the selection rule used for structured-EHR pretraining. After continued pretraining, the encoder is frozen and evaluated with a logistic-regression head for classification or a Cox proportional-hazards (DeepSurv) head for survival tasks.
What would settle it
Train an identical model with the same 8,192 tasks but shuffle event times across patients, preserving each code's marginal time distribution; if the AUROC and C-index gains over the same-visit baseline persist, the model is not actually using temporal order, and the claimed mechanism is wrong. Alternatively, re-run the pipeline on an external health system with different coding practices; if the gains vanish, the signal is documentation-driven rather than image-driven biology.
Extended reading notes
Core claim
The paper's central discovery claim is that temporal supervision—specifically, predicting the time until each of 8,192 EHR medical codes first occurs after a CT scan—is a usable and effective pretraining signal for 3D medical image encoders. On the INSPECT dataset of 18,945 chest CTs linked to a median of five years of follow-up, encoders continued-pretrained with this time-to-event objective outperform models trained with the same tasks restricted to the current visit and models trained with multitask classification, by an average 23.7% AUROC and 29.4% Harrell's C-index across eight prognostic benchmarks. The same encoders do not lose diagnostic classification performance on eight RSPECT image-labeling tasks, and calibration (integrated Brier score) improves by an average of 54%. The paper interprets this as evidence that future-guided temporal context is what existing self-supervised methods are missing.
Load-bearing premise
The load-bearing premise is that the time until a medical code appears in a patient's EHR is a valid, learnable proxy for the clinical outcome tied to that code, so that the image-to-code timing relationship is a real biomarker signal rather than an artifact of who gets tested or how often they visit.
Editorial extensions
If this is right
- Encoders pretrained this way can be adapted to new tasks with lightweight heads: the frozen encoder plus linear or Cox head is the evaluation protocol, so downstream deployment is cheap.
- The same CT scan yields roughly three times more training labels when future EHR time is used, so the method raises data efficiency for a given pretraining corpus.
- Prognostic gains come with preserved or slightly improved diagnostic classification, so adding temporal supervision does not force a trade-off against current-image labeling tasks.
- Right censoring is handled inside the pretraining loss, so patients who are lost to follow-up contribute to pretraining instead of being dropped.
- The paper's reported gains extend across three architectures (SwinUNETR, DenseNet-121, ResNet-152), suggesting the effect is not tied to one backbone.
Reading between the lines
- If the temporal signal is the active ingredient, the same recipe should transfer to other modalities with longitudinal EHR linkage, such as MRI or PET, and to 2D radiography; the paper only tests chest CT, so this is an extrapolation.
- A risk not settled by the paper is that code timing may partly encode follow-up intensity or documentation practice; testing on an external health system with different coding behavior would separate biology from billing artifacts.
- Because task selection maximizes conditional entropy, the chosen 8,192 codes may over-represent frequently documented events; ablating by ontology type (diagnoses vs. medications vs. procedures) would show which code families actually drive the prognostic gain.
- A practical extension the paper does not develop: TTE pretrained encoders could be used for opportunistic screening of underdiagnosed conditions from routine CTs, since the pretraining objective foregrounds future-disease signal in pixels.
Signed reviews
Editorial analysis
A structured set of objections, weighed in public.
Referee Report
Summary. The paper proposes time-to-event (TTE) pretraining for 3D medical imaging encoders. Using 18,945 chest CT scans from INSPECT linked to longitudinal EHR data, the authors convert medical codes into 8,192 TTE prediction tasks and continue-pretrain SwinUNETR, DenseNet-121, and ResNet-152 backbones. The frozen encoders are then probed on prognostic TTE tasks, prognostic binary classification, and diagnostic classification (RSPECT). The central claim is that TTE pretraining improves outcome prediction—average AUROC +23.7% and Harrell's C-index +29.4% across 8 benchmark tasks—without hurting diagnostic classification. The paper includes baselines (base, base/MTL, base/visit), bootstrap confidence intervals, significance tests, and additional metrics (time-dependent C-statistics, integrated Brier score, subgroup analyses, GradCAM).
Significance. If the effect is real and generalizes beyond the pretraining label vocabulary, TTE pretraining would be a valuable and scalable way to inject temporal prognostic signal into 3D imaging encoders, with practical implications for medical foundation models. The study is carefully executed in several respects: it uses public datasets, releases code and checkpoints, evaluates three architectures, includes an ablation that shares the same 8,192-task vocabulary (base/visit), reports bootstrap CIs with significance tests, and provides calibration and subgroup analyses. These are genuine strengths. However, the central generalization claim is weakened by the apparent overlap between pretraining tasks and evaluation tasks, and by the confounding of temporal scope with label density in the key comparison. As a result, the headline numbers are better interpreted as in-distribution task improvement than as evidence of transfer to novel prognostic outcomes.
major comments (2)
- [§4 (Creating TTE Pretraining Tasks), §5 (Datasets & Evaluation Tasks), Appendix B] The manuscript does not state that the 8 prognostic evaluation tasks (Mortality, Readmission, PH, ATX, CMG, CONS, EDM, PEFF) were held out of the 8,192 pretraining tasks. Section 4 says pretraining tasks are created by 'treating each code as a separate task' and selecting 8,192 codes from the EHR ontology (INSPECT), while Section 5 defines the five additional TTE tasks (ATX, CMG, CONS, EDM, PEFF) from the same INSPECT EHR event space (Appendix B); Mortality, Readmission, and PH are also EHR events. Because the manuscript is silent on exclusion, a reader cannot rule out that base/TTE was directly optimized to predict the exact future codes used for evaluation, whereas base/visit—the most informative baseline—was pretrained on the same code vocabulary but with same-visit labels and thus did not directly optimize those future-event evaluation tasks. In that case, the reported +23.7% AUROC and +29.4% C-index gains compare an in-distribution evaluation against an out-of-distribution baseline, rather than demonstrating generalizable prognostic transfer. This is load-bearing for the abstract's claim that temporal supervision from EHRs improves outcome prediction. The authors should either (a) verify and state explicitly that all evaluation codes were excluded from the 8,192-task pretraining set, and provide the task-selection details needed to confirm this, or (b) re-run the evaluation on held-out tasks that were provably not in the pretraining task family, ideally including an external dataset with survival outcomes. Without such evidence, the headline claims should be reframed as in-vocabulary task improvement.
- [§5 (Model Baselines), §6 (Results), Figure 3, Tables 2–3] The comparison between base/TTE and base/visit, which the paper identifies as the most informative ablation, varies temporal scope and label density simultaneously. Base/visit uses the same 8,192 tasks but labels assigned to the same visit as the CT scan, yielding on average 3x fewer labels per image (Figure 3); base/TTE uses future events with full survival times. The observed gains could therefore be driven by the higher label density, the temporal distance of the labels, or the survival objective itself. The text attributes the improvements specifically to temporal supervision (e.g., 'TTE Supervision Improves Training Data Efficiency' and 'TTE Pretraining Improves Prognostic Performance' in Section 7), but the design cannot separate these factors. A control that matches the number of labels per image while ablating the future-time component (e.g., binary future-event occurrence with the same density, or TTE labels subsampled to the base/visit density) is needed to support the claim that time-to-event modeling, rather than simply more labels, drives the effect. This is a load-bearing point for Hypothesis 2 and for the paper's central contribution.
minor comments (3)
- [Appendix M, Eq. (5) and Eq. (6)] In Equation (5) of Appendix M, the indicator 'I(Se ≤ t ≤ Sp)' appears to contain a typo; the main text's survival function uses intervals with start Sp and end Ep, so the indicator should likely read 'I(Sp ≤ t ≤ Ep)' or equivalent. Please correct this and the corresponding line in Equation (6).
- [Appendix K, Tables 14 and 16] Some entries in the confidence-interval tables are malformed: Table 14 contains '(-0.579 0.001)*' (missing comma) and Table 16 contains a stray '0.020' before a parenthesized interval in the SwinUNETR base EDM row. These formatting errors make the tables hard to read and should be fixed.
- [§5 (Datasets & Evaluation Tasks)] The text says 'INSPECT defines 3 prognostic binary tasks' and then later introduces '5 additional prognostic TTE tasks'; the relationship between the binary prognostic tasks and the TTE task set is described in a way that could confuse readers about which tasks are evaluated in which table. Please clarify whether the same underlying outcomes are evaluated in both formulations and how the eight benchmark tasks in the abstract map to Tables 2 and 3.
Circularity Check
No significant derivation circularity: the outcome benchmarks share the pretraining code family, but the base/MTL and base/visit controls make the temporal-signal comparison fair.
full rationale
The paper's central claim is empirical: TTE continued pretraining improves frozen-encoder outcome prediction relative to base, base/MTL, and base/visit. The evaluation TTE tasks (ATX, CMG, CONS, EDM, PEFF, PH, mortality, readmission) are defined in Appendix B as 'time until the first occurrence' of EHR codes, and the pretraining tasks in Section 4 are defined the same way ('predicting the time until the first occurrence... of a medical code'). Since the 8,192 pretraining tasks are selected from the same Athena/OMOP vocabulary, the benchmarks are likely in-distribution and cannot by themselves demonstrate transfer to novel outcome codes. This is a real external-validity limitation. It is not, however, derivation circularity: the paper never claims the evaluation outcomes were unseen during pretraining, and its two strongest baselines control for label exposure. base/MTL is trained directly on the eight INSPECT evaluation labels, yet base/TTE outperforms it; base/visit is pretrained on the same 8,192 code tasks with visit-level labels, isolating the future-time/censoring component. Thus the reported gains are not forced by construction. The main self-citation is MOTOR (Steinberg et al., 2024) for the conditional-entropy task selection and hyperparameters; this is a borrowed tool with overlapping authors, but it is not the load-bearing evidence for the outcome-prediction claim. The diagnostic RSPECT results provide an external but non-prognostic benchmark, so generalization to outcome codes outside the pretraining vocabulary remains untested; that is a correctness/generalization concern rather than a circular one. Overall, no prediction in the paper reduces by definition to a fitted input.
Assumptions & free parameters
free parameters (3)
- Number of pretraining tasks =
8,192
- Number of piecewise time bins =
8
- Evaluation time horizons =
1, 6, 12 months
assumptions (5)
- standard math Piecewise exponential survival model with constant hazard per time piece correctly models time-to-event for EHR-derived codes.
- domain assumption Each medical code in the OMOP ontology can be treated as an independent TTE pretraining task, with 'time until first occurrence' as the event.
- domain assumption Right censoring at death is the only competing risk; other reasons for loss to follow-up are ignored.
- ad hoc to paper MOTOR's conditional entropy and vertex-cover task selection is a valid way to pick informative tasks for image pretraining.
- domain assumption Base model weights (SwinUNETR, DenseNet-121, ResNet-152) are meaningful initialization points for continued pretraining.
Cite this review
Pith. "Pith review of Time-to-Event Pretraining for 3D Medical Imaging." pith.science (2026). https://pith.science/paper/OEZA22CJ
@misc{pith2026241109361,
  author       = {Pith},
  title        = {Pith review of: Time-to-Event Pretraining for 3D Medical Imaging},
  year         = {2026},
  howpublished = {\url{https://pith.science/paper/OEZA22CJ}},
  note         = {Machine review of arXiv:2411.09361}
}
read the original abstract
With the rise of medical foundation models and the growing availability of imaging data, scalable pretraining techniques offer a promising way to identify imaging biomarkers predictive of future disease risk. While current self-supervised methods for 3D medical imaging models capture local structural features like organ morphology, they fail to link pixel biomarkers with long-term health outcomes due to a missing context problem. Current approaches lack the temporal context necessary to identify biomarkers correlated with disease progression, as they rely on supervision derived only from images and concurrent text descriptions. To address this, we introduce time-to-event pretraining, a pretraining framework for 3D medical imaging models that leverages large-scale temporal supervision from paired, longitudinal electronic health records (EHRs). Using a dataset of 18,945 CT scans (4.2 million 2D images) and time-to-event distributions across thousands of EHR-derived tasks, our method improves outcome prediction, achieving an average AUROC increase of 23.7% and a 29.4% gain in Harrell's C-index across 8 benchmark tasks. Importantly, these gains are achieved without sacrificing diagnostic classification performance. This study lays the foundation for integrating longitudinal EHR and 3D imaging data to advance clinical risk prediction.
Figures


Figures from the paper (17 more)



Reference graph
Works this paper leans on
-
[1]
Detecting underdiagnosed medical conditions with deep learning-based opportunistic ct imaging
Asad Aali, Andrew Johnston, Louis Blankemeier, Dave Van Veen, Laura T Derry, David Svec, Jason Hom, Robert D Boutin, and Akshay S Chaudhari. Detecting underdiagnosed medical conditions with deep learning-based opportunistic ct imaging. arXiv preprint arXiv:2409.11686,
-
[3]
Merlin: A vision language foundation model for 3d computed tomography
Louis Blankemeier, Joseph Paul Cohen, Ashwin Kumar, Dave Van Veen, Syed Jamal Safdar Gardezi, Magdalini Paschali, Zhihong Chen, Jean-Benoit Delbrouck, Eduardo Reis, Cesar Truyts, et al. Merlin: A vision language foundation model for 3d computed tomography. arXiv preprint arXiv:2406.06512,
-
[5]
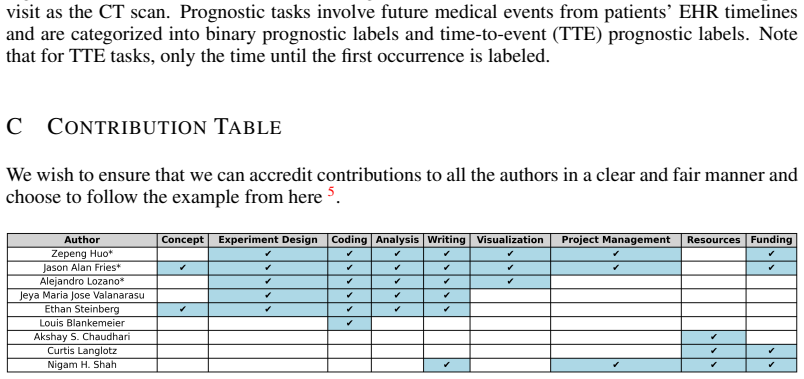
Figure 5: Overview of author contributions. * denotes equal contribution. 5https://x.com/SteinmetzNeuro/status/1147241128858570752 17 Published as a conference paper at ICLR 2025 D A DDITIONAL TIME -TO-EVENT MODEL METRICS We calculate additional metrics for time-to-event task modeling: the integrated Brier score (IBS) Graf et al. (1999), shown in Table 5,...
-
[6]
IBS is intended to assess the discrepancy between predicted survival probabili- ties and observed outcomes. At each time point, the Brier score calculates the squared difference between the predicted survival probability and the actual event or censoring status. By integrating over the time range from the start to a specified maximum horizon, it summarize...
work page 2005
-
[8]
Model Hyperparameters Values Image backbones SwinUNETR learning rate 10−4, 10−5, 10−6 dropout prob 0.1, 0.2, 0.3 patch size 2x2x2 window size 7x7x7, 8x8x8 augmentation strategies Random rotations, flips DenseNet learning rate 10−3, 10−4, 10−5, 10−6 depth 121, 169 num. of dense blocks 3,4 dropout prob 0.1, 0.2, 0.3 augmentation strategies Random rotations,...
work page 2025
-
[11]
Architecture Number of GPUs Estimated wall-clock time Estimated GPU hours SwinUNETRbase/TTE 4 H100 (80GB) 15 days 1,440 GPU hours DenseNet-121base/TTE 4 A100 (40GB) 9 days 864 GPU hours ResNet-152base/TTE 4 A100 (80GB) 10 days 960 GPU hours Table 11: Summary of compute cost across architectures 22 Published as a conference paper at ICLR 2025 J F ULL PARAM...
work page 2025
-
[12]
12 Published as a conference paper at ICLR 2025 Alexander Ke, William Ellsworth, Oishi Banerjee, Andrew Y Ng, and Pranav Rajpurkar. Chextrans- fer: performance and parameter efficiency of imagenet models for chest x-ray interpretation. In Proceedings of the conference on health, inference, and learning, pp. 116–124,
work page 2025
-
[15]
Accessed: 2023-08-16. 13 Published as a conference paper at ICLR 2025 Ramprasaath R Selvaraju, Michael Cogswell, Abhishek Das, Ramakrishna Vedantam, Devi Parikh, and Dhruv Batra. Grad-cam: Visual explanations from deep networks via gradient-based local- ization. In Proceedings of the IEEE international conference on computer vision, pp. 618–626,
work page 2023
Show all 40 references
-
[16]
Covid-19 prognosis via self-supervised representation learning and multi-image prediction
Anuroop Sriram, Matthew Muckley, Koustuv Sinha, Farah Shamout, Joelle Pineau, Krzysztof J Geras, Lea Azour, Yindalon Aphinyanaphongs, Nafissa Yakubova, and William Moore. Covid-19 prognosis via self-supervised representation learning and multi-image prediction. arXiv preprint ...
-
[17]
MOTOR: A time-to-event founda- tion model for structured medical records
Ethan Steinberg, Jason Alan Fries, Yizhe Xu, and Nigam Shah. MOTOR: A time-to-event founda- tion model for structured medical records. In The Twelfth International Conference on Learning Representations, ICLR 2024, Vienna, Austria, May 7-11,
2024
-
[18]
Disruptive autoencoders: Leveraging low-level features for 3d medical image pre-training
Jeya Maria Jose Valanarasu, Yucheng Tang, Dong Yang, Ziyue Xu, Can Zhao, Wenqi Li, Vishal M Patel, Bennett Landman, Daguang Xu, Yufan He, et al. Disruptive autoencoders: Leveraging low-level features for 3d medical image pre-training. arXiv preprint arXiv:2307.16896,
-
[19]
Medclip: Contrastive learning from unpaired medical images and text
Zifeng Wang, Zhenbang Wu, Dinesh Agarwal, and Jimeng Sun. Medclip: Contrastive learning from unpaired medical images and text. In Proceedings of the 2022 Conference on Empirical Methods in Natural Language Processing, pp. 3876–3887,
2022
-
[20]
Medtrinity-25m: A large-scale multimodal dataset with multigran- ular annotations for medicine
Yunfei Xie, Ce Zhou, Lang Gao, Juncheng Wu, Xianhang Li, Hong-Yu Zhou, Sheng Liu, Lei Xing, James Zou, Cihang Xie, et al. Medtrinity-25m: A large-scale multimodal dataset with multigran- ular annotations for medicine. arXiv preprint arXiv:2408.02900,
-
[21]
Con- trastive learning of medical visual representations from paired images and text
14 Published as a conference paper at ICLR 2025 Yuhao Zhang, Hang Jiang, Yasuhide Miura, Christopher D Manning, and Curtis P Langlotz. Con- trastive learning of medical visual representations from paired images and text. In Machine Learning for Healthcare Conference, pp. 2–25. PMLR,
2025
-
[22]
Deep convolutional neural network for survival analysis with pathological images
Xinliang Zhu, Jiawen Yao, and Junzhou Huang. Deep convolutional neural network for survival analysis with pathological images. In 2016 IEEE international conference on bioinformatics and biomedicine (BIBM), pp. 544–547. IEEE,
2016
-
[24]
Security, Data Storage, and Compliance: All authors involved in data handling have completed institutional training on HIPAA and data privacy before engaging with the data
and RSPECT (Colak et al., 2021), underwent thorough removal of protected health information prior to their public release and were approved by an Institutional Review Board. Security, Data Storage, and Compliance: All authors involved in data handling have completed institutio...
2021
-
[25]
However, we take two steps to mitigate risk
and is not covered in this study. However, we take two steps to mitigate risk. First, all of our contin- ued pretrained model releases includes a Data Use Agreement (DUA) that explicitly prohibits direct medical care. Second, in line with the recommendations from Chang et al. ...
2022
-
[26]
16 Published as a conference paper at ICLR 2025 APPENDIX A D ATA PREPROCESSING CT Scans
To ensure reproducibility, all experiments use researcher accessible, public medical datasets. 16 Published as a conference paper at ICLR 2025 APPENDIX A D ATA PREPROCESSING CT Scans. Each CT scan is preprocessed by extracting pixel data and applying a linear trans- formation ...
2025
-
[27]
B INSPECT N EW TTE T ASK DEFINITIONS We have selected a set of commonly used pulmonary disease tasks (Irvin et al., 2019), that are coded in INSPECT dataset’s EHR events
(OMOP vocabulary version: v20240830) as our knowledge graph for generating tasks. B INSPECT N EW TTE T ASK DEFINITIONS We have selected a set of commonly used pulmonary disease tasks (Irvin et al., 2019), that are coded in INSPECT dataset’s EHR events. We use these common task...
2019
-
[31]
Architecture Method Loss Dim. Dataset Size SwinUNETRbase Self-supervised MAE 3D Custom Medical 10,050 DenseNet-121base Supervised BCE 2D ImageNet 1,281,167 ResNet-152base Supervised BCE 2D ImageNet 1,281,167 Table 10: Summary of model architectures, pretraining approaches, and...
2023
-
[33]
We can conclude that single task full parameter fine-tuning does not scale as well as TTE pretraining, and in general the performance is no better than, if not much worse than TTE pretraining. Dataset (fine-tuning task) Architecture Full param fine-tuned results (AUROC) Linear...
-
[34]
The * indicates sta- tistical significance under p-value at 0.05 for null hypothesis
Table 14: 95% confidence interval differences for time-to-event performance on INSPECT dataset for proposed method ( base/TTE) and baselines, measured by Harrell’s C-Index . The * indicates sta- tistical significance under p-value at 0.05 for null hypothesis. 24 Published as a...
2025
-
[35]
Table 17: 95% confidence interval differences classification performance of different methods on RSPECT dataset for diagnosis labels, measured by AUROC. * indicates the statistical significance under p value = 0.05 25 Published as a conference paper at ICLR 2025 L T ASK HEAD C...
2025
-
[36]
PX p=1 λipI(Se ≤ t ≤ Sp) #∆i L = nY i=i [ PY p=1 exp −λip(min(t, Ep) − Sp))I(t ≥ Sp) ]
0.50 0.55 0.60 0.65 0.70 0.75 0.80 AUROC (Higher is better) Mortality 1M Mortality 6M Mortality 12M Readmission 1M Readmission 6M Readmission 12M Pulm HTN 12M SwinUNETR 0.50 0.55 0.60 0.65 0.70 0.75 AUROC (Higher is better) DenseNet 0.50 0.55 0.60 0.65 0.70 0.75 0.80 AUROC (Hi...
2025
-
[37]
We have maximum and median time to event distributions for the 8192 labels and all time to event distribution for each occurrence in Figures 17, 18,
Figure 9: Kaplan-Meier curve for Mortality Figure 10: Kaplan-Meier curve for Readmission 29 Published as a conference paper at ICLR 2025 Figure 11: Kaplan-Meier curve for Pulmonary Hypertension (PH) Figure 12: Kaplan-Meier curve for Atelectasis Figure 13: Kaplan-Meier curve fo...
2025
-
[38]
Figure 17: Maximum Time to Event across INSPECT cohort for 8192 future events (Per event) Figure 18: Median Time to Event across INSPECT cohort for 8192 future events (Per event) Figure 19: All Time to Event across INSPECT cohort for 8192 future events (Per occurrence) 32 Publ...
2025
-
[39]
Ontology OMOP Extension Medicare Specialty CPT4 CVX ICD9Proc RxNorm SNOMED RxNorm Extension Cancer Modifier ICD10PCS CMS Place of Service Visit Ethnicity Gender ICDO3 Race LOINC HCPCS Table 18: OHDSI Athena ontolgies used in our benchmark Medical Code Description Quintile SNOM...
2025
-
[40]
We can observe that the TTE version of the model can focus the pathology in a more reasonable region rather than scattered features learned by different baselines. Actual Atelectasis occured: True GradCAM (base) Atelectasis occured: True GradCAM (MTL) Atelectasis occured: True...
2025
-
[41]
Bold indicates the best performance across all models
Group Concept Counts Gender Female 1844 Male 1370 Age 18-39 448 39-69 1667 69-89 993 >89 106 Race Asian 554 Black 192 Native 74 White 1730 Unknown 664 Ethnicity Hispanic 495 Not Hispanic 2612 Unknown 107 Table 20: Subgroup stratified counts for the test split under INSPECT dat...
2025
-
[1972]
Training a neural network based on unreliable human annotation of medical images
Yair Dgani, Hayit Greenspan, and Jacob Goldberger. Training a neural network based on unreliable human annotation of medical images. In 2018 IEEE 15th International symposium on biomedical imaging (ISBI 2018), pp. 39–42. IEEE,
2018
-
[1996]
Deep residual learning for image recog- nition
Kaiming He, Xiangyu Zhang, Shaoqing Ren, and Jian Sun. Deep residual learning for image recog- nition. arxiv e-prints. arXiv preprint arXiv:1512.03385, 10,
-
[2014]
doi: 10.1007/978-3-319-09042-9_9
ISBN 978-3-319-09041-2. doi: 10.1007/978-3-319-09042-9_9. Erika Graf, Claudia Schmoor, Willi Sauerbrei, and Martin Schumacher. Assessment and comparison of prognostic classification schemes for survival data. Statistics in medicine, 18(17-18):2529– 2545,
-
[2016]
15 Published as a conference paper at ICLR 2025 ETHICS STATEMENT Research involving de-identifed publicly available data does not require Institutional Review Board (IRB) approval. However, to uphold standards and safeguard patient privacy, we follow the health- care machine l...
2025
-
[2018]
Piecewise exponential artificial neural networks (peann) for modeling hazard function with right censored data
11 Published as a conference paper at ICLR 2025 Marco Fornili, Federico Ambrogi, Patrizia Boracchi, and Elia Biganzoli. Piecewise exponential artificial neural networks (peann) for modeling hazard function with right censored data. In Computation Intelligence Methods for Bioin...
2025
-
[2019]
Hemant Ishwaran, Udaya B Kogalur, Eugene H Blackstone, and Michael S Lauer
URL http://arxiv.org/abs/1901.07031. Hemant Ishwaran, Udaya B Kogalur, Eugene H Blackstone, and Michael S Lauer. Random survival forests
1901 arXiv
-
[2020]
Masked image modeling advances 3d medical image analysis
Zekai Chen, Devansh Agarwal, Kshitij Aggarwal, Wiem Safta, Mariann Micsinai Balan, and Kevin Brown. Masked image modeling advances 3d medical image analysis. In Proceedings of the IEEE/CVF Winter Conference on Applications of Computer Vision, pp. 1970–1980,
1970
-
[2021]
Capabilities of gemini models in medicine
Khaled Saab, Tao Tu, Wei-Hung Weng, Ryutaro Tanno, David Stutz, Ellery Wulczyn, Fan Zhang, Tim Strother, Chunjong Park, Elahe Vedadi, et al. Capabilities of gemini models in medicine. arXiv preprint arXiv:2404.18416,
-
[2022]
Robust and efficient medical imaging with self-supervision
Shekoofeh Azizi, Laura Culp, Jan Freyberg, Basil Mustafa, Sebastien Baur, Simon Kornblith, Ting Chen, Patricia MacWilliams, S Sara Mahdavi, Ellery Wulczyn, et al. Robust and efficient medical imaging with self-supervision. arXiv preprint arXiv:2205.09723,
-
[2023]
Suraj Pai, Dennis Bontempi, Ibrahim Hadzic, Vasco Prudente, Mateo Sokaˇc, Tafadzwa L Chaunzwa, Simon Bernatz, Ahmed Hosny, Raymond H Mak, Nicolai J Birkbak, et al
Accessed: 2023-06-07. Suraj Pai, Dennis Bontempi, Ibrahim Hadzic, Vasco Prudente, Mateo Sokaˇc, Tafadzwa L Chaunzwa, Simon Bernatz, Ahmed Hosny, Raymond H Mak, Nicolai J Birkbak, et al. Foundation model for cancer imaging biomarkers. Nature machine intelligence, 6(3):354–367,
2023
-
[2024]
Densely connected convolutional networks
Gao Huang, Zhuang Liu, and Kilian Q Weinberger. Densely connected convolutional networks. corr. arXiv preprint arXiv:1608.06993,
Reviewed August 12, 2026 · model on record in the stance chip above.
Discussion (0). Continue with ORCID to comment.