REVIEW 4 major objections 6 minor 52 references
Game Theoretic Liquidity Provisioning in Concentrated Liquidity Market Makers
T0 review · 4 major / 6 minor · reviewed 2026-08-12 · deepseek-v4-flash
Pith's one-line read The paper claims that concentrated-liquidity AMM liquidity provision admits a unique waterfilling Nash equilibrium in an equivalent atomic game, and that risky-pool LPs' deviations from it leave about $116/day on the table.
desk verdict Solid twinship and uniqueness theorems for CLMM liquidity games; the empirical 'Nash beats real LPs' claim is partly in-sample, so treat the $116 gain as a calibrated illustration rather than a prediction. read the letter →
The pith
A machine-rendered reading of the paper's core claim, the machinery that carries it, and where it could break.
The reading
What carries the argument
The load-bearing object is the atomic game and the linear aggregation map $\theta$ that summarizes any LP's positions over $O(M^2)$ general price ranges into $M$ atomic per-tick liquidities; Theorem 3.5 (twinship) shows the original and atomic games are payoff-equivalent under this map. Uniqueness is carried by the diagonal strict concavity condition of the atomic utility (Rosen's theorem) combined with the KKT conditions of the budget-constrained concave program, and the waterfilling property follows from those KKT conditions via a monotonicity argument on per-range marginal utilities.
What would settle it
Take one narrow price range in a live CLMM pool and measure its daily fee revenue before and after a large new liquidity position is added there, holding market conditions fixed; if fee revenue moves systematically with the added liquidity, the constant-fee assumption fails and the simulated gains from the inert game are not trustworthy. Alternatively, an exhaustive numerical search for two distinct equilibrium vectors in a small instance with $0<\alpha\le 1$ would directly refute the uniqueness theorem.
Extended reading notes
Core claim
The paper's central claim is that the high-dimensional liquidity-provision game in a CLMM is payoff-equivalent to an atomic game in which each LP directly chooses liquidity on each tick-to-tick interval. For fee-sharing exponent $0<\alpha\le 1$, the atomic game has a unique Nash equilibrium; the map from original strategies to atomic liquidity is a twinship, so every equilibrium of the original game gives the same per-tick liquidity, budget use, and utility as this unique equilibrium. The paper further proves that the equilibrium follows waterfilling: LPs below a budget threshold exhaust their budgets at a common per-range level, while richer LPs invest equal amounts and leave budget unused. Empirically, fitting the model to four Uniswap v3 pools shows stable-pool LPs behave near equilibrium, while risky-pool LPs deviate; against static rivals, switching to the inert-game equilibrium raises median daily utility by about $116 (0.009% median daily ROI).
Load-bearing premise
The load-bearing premise is that the fee paid in each price range is a fixed external number, unaffected by how much liquidity LPs put there; if deeper liquidity changes trading volume or fees, the model's utility function, uniqueness proof, and counterfactual gains all lose their grip.
Editorial extensions
If this is right
- For fee-sharing exponents $0<\alpha\le 1$, equilibrium strategy computation scales linearly in the number of ticks rather than quadratically, making game-theoretic advice practical for real contracts.
- At equilibrium, LPs below a budget threshold spend their full budget, while richer LPs spend a common amount and leave budget idle; equal-budget LPs adopt identical strategies.
- The twinship result pins down the per-tick liquidity profile, budget usage, and utility of every Nash equilibrium of the original game, resolving the multiplicity of the original game.
- In stable pools, the model's equilibrium matches actual LP actions closely, while in risky pools it does not; this supports using the model to detect suboptimal liquidity provision in volatile markets.
- An LP who adopts the inert-game equilibrium while rivals keep their current strategies can improve median daily returns by $116 (0.009% median daily ROI) in risky pools.
Reading between the lines
- If fee rewards are allowed to depend endogenously on total liquidity, uniqueness and waterfilling need not survive; a natural extension is a volume-as-function-of-liquidity model, which could be tested by regressing per-range fees on lagged liquidity.
- The structural result transfers beyond CLMMs: any proportional-sharing resource allocation with one budget constraint per agent and concave per-range returns may inherit the same waterfilling equilibrium, so the theorem could be stated in that generality.
- The $116/day counterfactual is measured against static rivals; if all LPs update to the inert equilibrium, the gains should dissipate, so the number is an upper bound on the value of strategic updating rather than a persistent arbitrage.
- A testable prediction of the paper's story is that in risky pools, LPs with lower information latency should use narrower ranges and update more often; pool-level data after infrastructure changes could confirm this.
Signed reviews
Editorial analysis
A structured set of objections, weighed in public.
Referee Report
Summary. This paper models strategic liquidity provision in concentrated-liquidity market makers (CLMMs) as a non-cooperative game. Each liquidity provider (LP) chooses liquidity amounts across price ranges subject to a dollar budget, earns a share of per-range trading fees, and bears an expected impermanent-loss cost. The first main result (Thm. 3.5) shows that the original game, whose action space is quadratic in the number of ticks, is payoff-equivalent (a 'twin game') to an atomic game in which each LP chooses liquidity only over adjacent-tick ranges, so Nash equilibria of the two games correspond. The second main result (Thm. 3.3) proves that for 0<alpha<=1 the atomic game has a unique Nash equilibrium, characterized by a waterfilling pattern (Prop. 3.6) and budget dominance (Prop. 3.7): low-budget LPs exhaust their budgets while rich LPs spend equal amounts on active ranges. Empirically, the model is instantiated on five Uniswap v3 pools (one stable, four risky) over 182 daily periods. The authors find that stable-pool LPs' actual positions overlap substantially with the computed Nash equilibrium, whereas risky-pool LPs use fewer and wider price ranges than the equilibrium suggests, and that a strategy computed from a 7-day-history 'inert game' (I_NE) improves median daily utility by $116 (a 0.009% increase in median daily ROI) relative to ground-truth actions.
Significance. The theoretical contribution is substantial and, conditional on its stated assumptions, appears sound. The twinship theorem is proved under weak conditions on the fee-sharing rule (App. C.1), and the uniqueness proof via Rosen's diagonal strict concavity (App. C.5) is detailed and, as far as I can verify, correct for the constant-fee atomic game; the waterfilling and budget-dominance characterizations follow from the KKT conditions. The reduction from a quadratic to a linear action space is clean and practically meaningful. The empirical part is transparent by the standards of this literature: the data-cleaning pipeline is described in detail, a public repository is provided, and the main modeling assumptions (constant per-range fees, the price-shift calibration, per-pool expansion factors) are explicitly stated rather than hidden. The empirical findings are falsifiable and informative: with the caveat that the headline gains are conditional on the model assumptions, the paper demonstrates that simple data-driven equilibrium strategies can improve LP returns in risky pools while stable-pool LPs play close to equilibrium.
major comments (4)
- [Sec. 3.1 (Eq. 3.3), Sec. 4.1.3, App. C.5 (Thm. C.5)] The uniqueness theorem (Thm. 3.3), the waterfilling characterization (Prop. 3.6), and budget dominance (Prop. 3.7) are proved only for the constant-fee atomic game in which f_m does not depend on the total liquidity kappa_m. If fee rewards respond to liquidity depth, the Hessian in Thm. C.5 acquires terms in f'_m(kappa_m) and f''_m(kappa_m), and the diagonal-strict-concavity argument used to apply Rosen's theorem no longer yields negative definiteness; the twinship result (Thm. 3.5 / Thm. C.1) survives endogenous fees, but the claimed uniqueness of the atomic liquidity histogram, budget usage, and utilities across original-game equilibria rests on the constant-fee assumption. Because Sec. 4.1.3 instantiates the games with fixed observed fees, the computed unique equilibrium and the $116 / 0.009% counterfactual are predictions of a model that assumes fee generation is unaffected by LP liquidity choices. Please state this scope limitation at the point where Thm. 3.3 is invoked for the empirical analysis, and add a robustness check under a simple endogenous-fee specification, e.g., f_m(kappa_m) = f_m^0 (kappa_m / kappa_m^0)^beta for a small set of beta values, to show whether the qualitative findings survive.
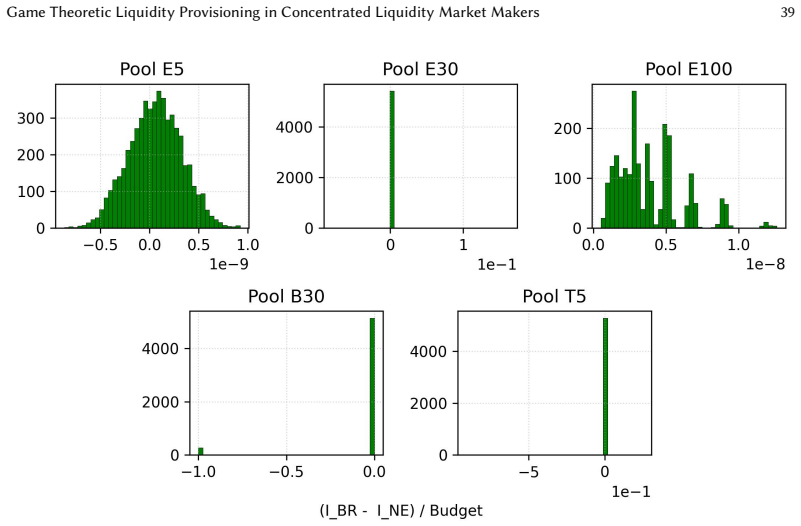
- [App. E.3 (Tab. 6), Sec. 4.3 (Finding 4)] The headline improvement of $116 in median daily utility (0.009% median daily ROI) is computed using per-pool expansion factors E (Tab. 6) that are chosen by maximizing the I_BR-versus-GT utility and overlap advantage on the same evaluation data used to report the gain (App. E.3, Fig. 12). This is in-sample selection of a free parameter, so the reported numbers are an optimistic fit rather than an out-of-sample prediction. Please either select E on a training window and evaluate on a holdout window, or report the headline statistic across a grid of E values (including E=1 and a single common E for all pools), and adjust the abstract and Finding 4 so that they do not present the $116 / 0.009% figure as model-free.
- [Sec. 4.1.4, Eq. (4.2)] The shifted dollar prices in Eq. (4.2) are an ad hoc calibration introduced to guarantee tau-hat >= 0, and they change the impermanent-loss term in every utility evaluation. Fig. 14 bounds the resulting relative error in token prices (below 1%), but the utility differences compared in Findings 2-4 are of order 0.01% of budget (Tab. 9), so a small distortion in the loss term could be material for the sign or magnitude of the reported gaps. Please report the sensitivity of the headline utility differences to the calibration choice (e.g., replacing the symmetric shift with the zero-capping alternative mentioned in the text, or perturbing the shift by plausible amounts), and quantify how the $116 gap changes.
- [Sec. 4.1.1, Eq. (4.3)] Setting each player's budget equal to their observed total investment for the day means the GT strategy always exhausts the budget by construction, so the 'unused budget' bucket in the overlap metric (Eq. 4.3) is empty for GT and the NE-GT overlap partly reflects this normalization rather than genuine budget constraints. Please clarify whether any GT player leaves budget unused, and discuss how the computed NE would change if budgets were instead estimated from the LP's capital available at the start of the day, consistently with the inertial-game budget estimation described in Sec. 4.3.
minor comments (6)
- [App. C.5 (Thm. C.5)] In the negative-definiteness computation, the displayed equality preceding '-alpha Sum_k K^alpha_{m,k}[...]' omits the non-negative chi_m terms; the inequality direction is unaffected, but the sign should be '<=' rather than '='.
- [Sec. 1 vs. Sec. 3.4] The contribution list in Sec. 1 refers to the waterfilling result as 'Thm. 3.6', while the statement in Sec. 3.4 is labeled Prop. 3.6; the numbering of this result should be aligned between the introduction and the body.
- [App. E.2] The sentence 'when we observe f_m > 0 but f^P_m for some price range m' is missing the condition '= 0', and for the E100 pool 390 of 833 ranges are uncovered, so the non-player liquidity share chi_m cannot be estimated for nearly half of that pool's ranges; please state explicitly how these ranges enter the game instances.
- [Sec. 4.3 (Finding 4), Tabs. 8-9] The headline figures of $116 median and $222 mean daily utility improvement are not directly traceable to the per-pool statistics in Tabs. 8 and 9 (e.g., the E5 median difference is $150 and the E30 mean difference is $813); please specify the aggregation (pooled observations versus average of per-pool means) used to obtain $116 and $222.
- [Abstract] The abstract contains a typo: 'Automated marker makers' should read 'Automated market makers'.
- [Prop. 3.8] The proposition title contains typos: 'Positive liqidity at eqilibrium' should read 'Positive liquidity at equilibrium'.
Circularity Check
Theoretical chain is self-contained, but the headline inert-game utility gain is partly in-sample: the expansion factor E is chosen per pool to maximize the same utility/overlap advantages later reported as findings.
-
fitted input called prediction
[App. E.3 (Expansion Factor in Inert Game); reported in §4.3, Finding 4]
"To determine the hyper-parameter𝐸, we evaluate the effect of𝐸 on utility advantage over ground truth (GT) and overlap advantage with GT over Nash equilibrium (NE). ... These curves motivate our final choice of𝐸 for each pool in Tab. 6."
Finding 4 reports that “the Nash equilibrium strategy of the inert game (i.e., I_NE) has up to $116 higher daily median utility than GT” and that I_NE has higher overlap with GT than NE (Finding 3). But the inert game's only free parameter E is selected per pool on the same data by maximizing I_BR's utility advantage over GT and overlap advantage over NE, and the paper states I_BR “shows an extremely high proximity to I_NE” (Fig. 13). Thus the reported improvement is essentially the value of the selection objective used to choose E, not an independent out-of-sample prediction; the $116/0.009% gain is in-sample and forced by the construction of the inert game's price range (t/E, Et).
full rationale
The theoretical derivation chain is self-contained: twinship (Thm 3.5), uniqueness (Thm 3.3), waterfilling (Prop 3.6), and budget dominance (Prop 3.7) follow from stated assumptions (constant f_m, weights (C.7)) using standard external results such as Rosen's theorem, with no load-bearing self-citation or imported uniqueness. The constant-fee assumption is a real modeling limitation—uniqueness would not follow if f_m depended on total liquidity—but that is an assumption-sensitivity concern, not circularity. The clear circular step is confined to the empirical section: the inert game's expansion factor E is tuned per pool to maximize utility/overlap advantage over GT on the same data, and the same advantages are then reported as findings. This makes the headline empirical gain partly in-sample, while the central game-theoretic results retain independent content.
Assumptions & free parameters
free parameters (3)
- Expansion factor E (per pool) =
3 (B30), 2 (E100), 1.65 (E30), 2 (E5), 1 (T5)
- Fluctuation parameter r (reactive game) =
1.1
- Price shift (p_bar_X, p_bar_Y) =
p_bar_X = sqrt(p_X p_Y q), p_bar_Y = sqrt(p_X p_Y / q)
assumptions (6)
- domain assumption Price process is stationary ergodic with known distribution π
- domain assumption Per-range fees f_m are exogenous constants
- domain assumption Impermanent loss is linear in liquidity and is the only cost
- ad hoc to paper Price shift calibration (4.2) yields valid dollar values
- standard math Rosen's diagonal strict concavity theorem
- standard math KKT conditions are necessary and sufficient
Cite this review
Pith. "Pith review of Game Theoretic Liquidity Provisioning in Concentrated Liquidity Market Makers." pith.science (2026). https://pith.science/paper/O2UZNAEP
@misc{pith2026241110399,
  author       = {Pith},
  title        = {Pith review of: Game Theoretic Liquidity Provisioning in Concentrated Liquidity Market Makers},
  year         = {2026},
  howpublished = {\url{https://pith.science/paper/O2UZNAEP}},
  note         = {Machine review of arXiv:2411.10399}
}
abstract
Automated marker makers (AMMs) are a class of decentralized exchanges that enable the automated trading of digital assets. They accept deposits of digital tokens from liquidity providers (LPs); tokens can be used by traders to execute trades, which generate fees for the investing LPs. The distinguishing feature of AMMs is that trade prices are determined algorithmically, unlike classical limit order books. Concentrated liquidity market makers (CLMMs) are a major class of AMMs that offer liquidity providers flexibility to decide not only \emph{how much} liquidity to provide, but \emph{in what ranges of prices} they want the liquidity to be used. This flexibility can complicate strategic planning, since fee rewards are shared among LPs. We formulate and analyze a game theoretic model to study the incentives of LPs in CLMMs. Our main results show that while our original formulation admits multiple Nash equilibria and has complexity quadratic in the number of price ticks in the contract, it can be reduced to a game with a unique Nash equilibrium whose complexity is only linear. We further show that the Nash equilibrium of this simplified game follows a waterfilling strategy, in which low-budget LPs use up their full budget, but rich LPs do not. Finally, by fitting our game model to real-world CLMMs, we observe that in liquidity pools with risky assets, LPs adopt investment strategies far from the Nash equilibrium. Under price uncertainty, they generally invest in fewer and wider price ranges than our analysis suggests, with lower-frequency liquidity updates. We show that across several pools, by updating their strategy to more closely match the Nash equilibrium of our game, LPs can improve their median daily returns by \$116, which corresponds to an increase of 0.009\% in median daily return on investment.
Figures


Figures from the paper (11 more)




Reference graph
Works this paper leans on
-
[1]
Don’t let mev slip: The costs of swapping on the uniswap protocol, 2024
Austin Adams, Benjamin Y Chan, Sarit Markovich, and Xin Wan. Don’t let mev slip: The costs of swapping on the uniswap protocol, 2024
work page 2024
- [2]
-
[3]
Hayden Adams, Noah Zinsmeister, Moody Salem, River Keefer, and Dan Robinson. Uniswap v3 core. Tech. rep., Uniswap, Tech. Rep., 2021. , Vol. 1, No. 1, Article . Publication date: November 2024. 22 Weizhao Tang, Rachid El-Azouzi, Cheng Han Lee, Ethan Chan, and Giulia Fanti
work page 2021
-
[4]
Allium - enterprise blockchain data platform
Allium. Allium - enterprise blockchain data platform. https://www.allium.so/. (Accessed on 10/04/2024)
work page 2024
-
[5]
When does the tail wag the dog? curvature and market making
Guillermo Angeris, Tarun Chitra, and Alex Evans. When does the tail wag the dog? curvature and market making. 2022
work page 2022
-
[6]
Liquidity provision by automated market makers
Jun Aoyagi. Liquidity provision by automated market makers. A vailable at SSRN 3674178, 2020
work page 2020
-
[7]
Balancer. Balancer docs (v2). https://docs.balancer.fi/. Accessed on Sep 15, 2024
work page 2024
-
[8]
Balancer. Balancer docs (v3). https://docs-v3.balancer.fi/. Accessed on Sep 15, 2024
work page 2024
Show all 52 references
-
[9]
Uniswap liquidity provision: An online learning approach, 2023
Yogev Bar-On and Yishay Mansour. Uniswap liquidity provision: An online learning approach, 2023
2023
-
[10]
Dex specs: A mean-field approach to defi currency exchanges, 2024
Erhan Bayraktar, Asaf Cohen, and April Nellis. Dex specs: A mean-field approach to defi currency exchanges, 2024
2024
-
[11]
Relaxation techniques and asynchronous algorithms for on-line computation of non-cooperative equilibria
Tamer Başar. Relaxation techniques and asynchronous algorithms for on-line computation of non-cooperative equilibria. Journal of Economic Dynamics and Control , 11(4):531–549, 1987
1987
-
[12]
An empirical study of market inefficiencies in uniswap and sushiswap, 2022
Jan Arvid Berg, Robin Fritsch, Lioba Heimbach, and Roger Wattenhofer. An empirical study of market inefficiencies in uniswap and sushiswap, 2022
2022
-
[13]
Reveal & track fact-checked data on the top dapps instantly
BitDegree. Reveal & track fact-checked data on the top dapps instantly. https://www.bitdegree.org/crypto-tracker/top- dapps, 2024. Accessed on Oct 1, 2024
2024
-
[14]
The adoption of blockchain-based decentralized exchanges
Agostino Capponi and Ruizhe Jia. The adoption of blockchain-based decentralized exchanges. arXiv preprint arXiv:2103.08842, 2021
2021 arXiv
-
[15]
Voudouris
Ioannis Caragiannis and Alexandros A. Voudouris. The efficiency of resource allocation mechanisms for budget- constrained users. In Proceedings of the 2018 ACM Conference on Economics and Computation , EC ’18, page 681–698, New York, NY, USA, 2018. Association for Computing Machinery
2018
-
[16]
The replicating portfolio of a constant product market
Joseph Clark. The replicating portfolio of a constant product market. A vailable at SSRN 3550601, 2020
2020
-
[17]
Top decentralized exchanges ranked by volume
CoinGecko. Top decentralized exchanges ranked by volume. https://www.coingecko.com/en/exchanges/decentralized. (Accessed on 09/30/2024)
2024
-
[18]
Top decentralized exchanges ranked by volume
CoinGecko. Top decentralized exchanges ranked by volume. https://www.coingecko.com/en/exchanges/decentralized,
-
[19]
Static replication of impermanent loss for concentrated liquidity provision in decentralised markets
Jun Deng, Hua Zong, and Yun Wang. Static replication of impermanent loss for concentrated liquidity provision in decentralised markets. Operations Research Letters, 51(3):206–211, 2023
2023
-
[20]
Stableswap - efficient mechanism for stablecoin liquidity
Michael Egorov. Stableswap - efficient mechanism for stablecoin liquidity. https://classic.curve.fi/files/stableswap- paper.pdf/. Accessed on Sep 15, 2024
2024
-
[21]
Presentation and publication: Loss and slippage in networks of automated market makers
Daniel Engel and Maurice Herlihy. Presentation and publication: Loss and slippage in networks of automated market makers. In 3rd International Conference on Blockchain Economics, Security and Protocols (Tokenomics 2021) . Schloss Dagstuhl-Leibniz-Zentrum für Informatik, 2022
2021
-
[22]
Rate control for communication networks: shadow prices, proportional fairness and stability
A K Maulloo F P Kelly and D K H Tan. Rate control for communication networks: shadow prices, proportional fairness and stability. Journal of the Operational Research Society , 49(3):237–252, 1998
1998
-
[23]
Marmolejo-Cossío, Ben Altschuler, He Sun, Xintong Wang, and David Parkes
Zhou Fan, Francisco J. Marmolejo-Cossío, Ben Altschuler, He Sun, Xintong Wang, and David Parkes. Differential liquidity provision in uniswap v3 and implications for contract design. In Proceedings of the Third ACM International Conference on AI in Finance , ICAIF ’22, page 9–1...
2022
-
[24]
Moroz, Michael Neuder, Rithvik Rao, and David C
Zhou Fan, Francisco Marmolejo-Cossío, Daniel J. Moroz, Michael Neuder, Rithvik Rao, and David C. Parkes. Strategic liquidity provision in uniswap v3, 2024
2024
-
[25]
Arrakis finance - decentralized market making infrastructure
Arrakis Finance. Arrakis finance - decentralized market making infrastructure. https://www.arrakis.finance/, 2024. Accessed on Oct 1, 2024
2024
-
[26]
The economics of automated market makers
Robin Frtisch, Samuel Käser, and Roger Wattenhofer. The economics of automated market makers. In Proceedings of the 4th ACM Conference on Advances in Financial Technologies , AFT ’22, page 102–110, New York, NY, USA, 2023. Association for Computing Machinery
2023
-
[27]
Finding the right curve: Optimal design of constant function market makers
Mohak Goyal, Geoffrey Ramseyer, Ashish Goel, and David Mazieres. Finding the right curve: Optimal design of constant function market makers. In Proceedings of the 24th ACM Conference on Economics and Computation , EC ’23, page 783–812, New York, NY, USA, 2023. Association for ...
2023
-
[28]
DeFi and the Future of Finance
Campbell R Harvey. DeFi and the Future of Finance . John Wiley & Sons, 2021
2021
-
[29]
Liquidity pool design on automated market makers, 2024
Xue Dong He, Chen Yang, and Yutian Zhou. Liquidity pool design on automated market makers, 2024
2024
-
[30]
Risks and returns of uniswap v3 liquidity providers
Lioba Heimbach, Eric Schertenleib, and Roger Wattenhofer. Risks and returns of uniswap v3 liquidity providers. AFT ’22, page 89–101, New York, NY, USA, 2023. Association for Computing Machinery
2023
-
[31]
Behavior of liquidity providers in decentralized exchanges
Lioba Heimbach, Ye Wang, and Roger Wattenhofer. Behavior of liquidity providers in decentralized exchanges. arXiv preprint arXiv:2105.13822, 2021
2021 arXiv
-
[32]
XRP Ledger Sees 80% Transaction Surge Driven By Micropayments » The Merkle News
Will Izuchukwu. XRP Ledger Sees 80% Transaction Surge Driven By Micropayments » The Merkle News. https: //themerkle.com/xrp-ledger-sees-80-transaction-surge-driven-by-micropayments/, 2024. (Accessed on 09/30/2024)
2024
-
[33]
Efficient liquidity providing via margin liquidity, 2022
Yeonwoo Jeong, Chanyoung Jeoung, Hosan Jeong, SangYoon Han, and Juntae Kim. Efficient liquidity providing via margin liquidity, 2022. , Vol. 1, No. 1, Article . Publication date: November 2024. Game Theoretic Liquidity Provisioning in Concentrated Liquidity Market Makers 23
2022
-
[34]
Tsitsiklis
Ramesh Johari and John N. Tsitsiklis. Efficiency loss in a network resource allocation game. Math. Oper. Res. , 29(3):407–435, August 2004
2004
-
[35]
Nicholas A. G. Johnson, Theo Diamandis, Alex Evans, Henry de Valence, and Guillermo Angeris. Concave pro-rata games. In Financial Cryptography and Data Security. FC 2023 International Workshops: Voting, CoDecFin, DeFi, WTSC, Bol, Brač, Croatia, May 5, 2023, Revised Selected Pa...
2023
-
[36]
Chapter 4: Non-cooperative Games , pages 22 – 33
John Nash Jr. Chapter 4: Non-cooperative Games , pages 22 – 33. Edward Elgar Publishing, Cheltenham, UK, 1996
1996
-
[37]
La and V
R.J. La and V. Anantharam. Charge-sensitive tcp and rate control in the internet. In Proceedings IEEE INFOCOM 2000. Conference on Computer Communications. Nineteenth Annual Joint Conference of the IEEE Computer and Communications Societies (Cat. No.00CH37064), volume 3, pages ...
2000
-
[38]
Unified approach for hedging impermanent loss of liquidity provision
Alexander Lipton, Vladimir Lucic, and Artur Sepp. Unified approach for hedging impermanent loss of liquidity provision. arXiv preprint arXiv:2407.05146, 2024
2024 arXiv
-
[39]
Impermanent loss in uniswap v3, 2021
Stefan Loesch, Nate Hindman, Mark B Richardson, and Nicholas Welch. Impermanent loss in uniswap v3, 2021
2021
-
[40]
Liquidity pools, sushiswap documentation
Masayoshi. Liquidity pools, sushiswap documentation. https://docs.sushi.com/docs/Products/Concepts/Liquidity% 20Pools. Accessed on Sep 15, 2024
2024
-
[41]
Automated market making and loss-versus-rebalancing
Jason Milionis, Ciamac C Moallemi, Tim Roughgarden, and Anthony Lee Zhang. Automated market making and loss-versus-rebalancing. arXiv preprint arXiv:2208.06046, 2022
2022 arXiv
-
[42]
Moallemi, Tim Roughgarden, and Anthony Lee Zhang
Jason Milionis, Ciamac C. Moallemi, Tim Roughgarden, and Anthony Lee Zhang. Automated market making and loss-versus-rebalancing, 2024
2024
-
[43]
Adaptive curves for optimally efficient market making
Viraj Nadkarni, Sanjeev Kulkarni, and Pramod Viswanath. Adaptive curves for optimally efficient market making. arXiv preprint arXiv:2406.13794, 2024
2024 arXiv
-
[44]
John F. Nash. Equilibrium points in <i>n</i>-person games.Proceedings of the National Academy of Sciences, 36(1):48–49, 1950
1950
-
[45]
Orca docs
Orca. Orca docs. https://docs.orca.so/. Accessed on Sep 15, 2024
2024
-
[46]
Pancakeswap docs
PancakeSwap. Pancakeswap docs. https://docs.pancakeswap.finance/. Accessed on Sep 15, 2024
2024
-
[47]
Existence and uniqueness of equilibrium points for concave n-person games
J Ben Rosen. Existence and uniqueness of equilibrium points for concave n-person games. Econometrica: Journal of the Econometric Society, pages 520–534, 1965
1965
-
[48]
Raydium protocol litepaper
Raydium Team. Raydium protocol litepaper. https://whitepaper.io/document/662/raydium-whitepaper. Accessed on Sep 15, 2024
2024
-
[49]
Equivalence of games in extensive form , volume 759
Frederick B Thompson. Equivalence of games in extensive form , volume 759. Rand Corporation, 1952
1952
-
[50]
Sok: Decentralized exchanges (dex) with automated market maker (amm) protocols
Jiahua Xu, Krzysztof Paruch, Simon Cousaert, and Yebo Feng. Sok: Decentralized exchanges (dex) with automated market maker (amm) protocols. ACM Comput. Surv., 55(11), feb 2023
2023
-
[51]
degree of freedom
Yuedong Xu, Zhujun Xiao, Tianyu Ni, Jessie Hui Wang, Xin Wang, and Eitan Altman. On the robustness of price- anticipating kelly mechanism. IEEE/ACM Transactions on Networking, 27(4):1558–1571, 2019. , Vol. 1, No. 1, Article . Publication date: November 2024. 24 Weizhao Tang, R...
2019
-
[2024]
Accessed on Oct 1, 2024
2024
Reviewed August 12, 2026 · model on record in the stance chip above.
Discussion (0). Continue with ORCID to comment.