REVIEW 4 major objections 5 minor 23 references
Integrated Machine Learning and Survival Analysis Modeling for Enhanced Chronic Kidney Disease Risk Stratification
T0 review · 4 major / 5 minor · reviewed 2026-08-12 · deepseek-v4-flash
Pith's one-line read Adding machine learning-selected predictors to the standard kidney failure risk equation improves prediction of chronic kidney disease progression, the paper reports.
desk verdict A usable but unconvincing incremental application of the SHAP-plus-Cox recipe to CKD; the reported gains are likely inflated by selection leakage and an undefined index date. read the letter →
The pith
A machine-rendered reading of the paper's core claim, the machinery that carries it, and where it could break.
The reading
What carries the argument
The carrying mechanism is a two-stage pipeline: a feature-selection stage and a survival-modeling stage. In the first stage, binary classifiers (logistic regression, decision tree, random forest, XGBoost, a fully connected network, and a residual network) are trained to predict CKD progression, and the 40 features with the highest mean absolute SHAP values are selected for each classifier. These features are unioned with the eight variables of the Kidney Failure Risk Equation (age, sex, estimated glomerular filtration rate, albumin-to-creatinine ratio, calcium, phosphorus, bicarbonate, and albumin). In the second stage, a Cox proportional hazards model is fit to the unioned feature set, and models are compared by concordance index and Brier score under five-fold cross-validation. SHAP, the Shapley-value approximation, is the object that converts model predictions into feature rankings; the Cox model converts selected features into time-dependent risk scores.
What would settle it
Recompute the five-fold evaluation with an explicit index date that freezes baseline labs and diagnoses before follow-up, and with SHAP feature ranking performed separately inside each training fold. If the logistic-regression-augmented Cox model no longer exceeds the baseline average C-index of 0.8820, or the XGBoost-augmented model no longer beats the baseline 5-year Brier score of 0.1120, the paper's central claim is falsified; an external primary-care CKD cohort with adjudicated progression dates would provide the same test.
Extended reading notes
Core claim
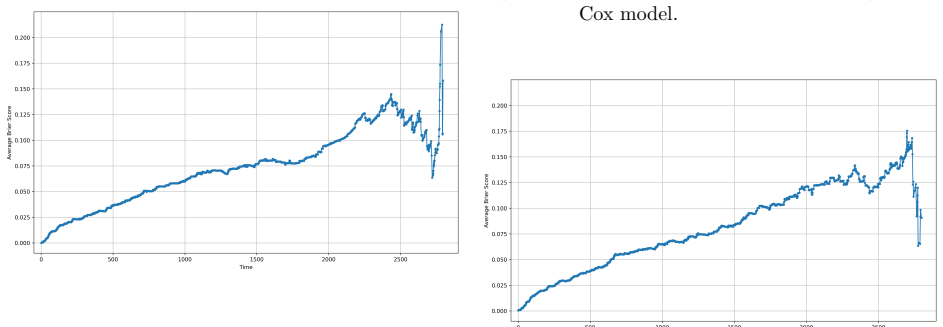
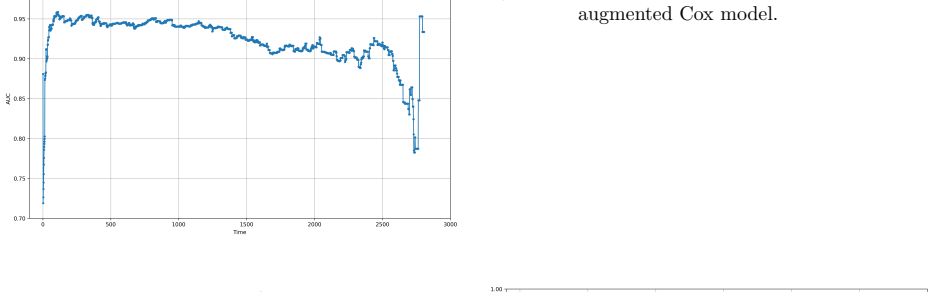
The central claim is that integrating machine-learning-derived predictors with Cox proportional hazards models improves prediction of CKD stage progression. The paper identifies blood markers such as mean corpuscular hemoglobin concentration, mean corpuscular hemoglobin, neutrophil and platelet counts, potassium, and cardiac comorbidity codes as candidate novel predictors, alongside expected markers such as creatinine values, renal dialysis status, and urea nitrogen. The claim is supported by consistent C-index, Brier score, and dynamic AUROC comparisons showing that the augmented models outperform the KFRE-8 baseline, with the best C-index from the logistic-regression-augmented model (0.8900 average) and the best 5-year Brier score from the XGBoost-augmented model (0.0801).
Load-bearing premise
The load-bearing premise is that all 1,373 feature values were recorded before the patient's CKD progression event and that SHAP feature ranking did not use outcome information from the held-out folds; the paper does not define an index date or nest selection inside the cross-validation loop, so if either condition fails, the reported C-index and Brier improvements are optimistic.
Editorial extensions
If this is right
- All six ML-augmented Cox models exceed the KFRE-8 baseline in average concordance index, so the gain is not tied to one particular classifier.
- The best calibration improvement is at the 5-year horizon, where the XGBoost-augmented model's Brier score drops from 0.1120 to 0.0801, implying more trustworthy long-term risk estimates.
- The SHAP rankings consistently place creatinine, dialysis status, and urea nitrogen at the top, which supports the clinical relevance of the standard KFRE variables.
- The paper's discussion identifies hematologic markers and cardiac comorbidity codes as candidate additions to CKD progression models, suggesting systemic and cardiovascular pathways meriting further study.
Reading between the lines
- Because the cohort comes from an emergency/critical-care setting and progression is defined by ICD-9 diagnosis codes, an external validation in an outpatient primary-care cohort with adjudicated progression dates is the natural next test.
- The paper does not specify an index date separating baseline feature collection from follow-up, nor does it nest SHAP feature selection inside the cross-validation folds; re-running the analysis with selection performed separately in each training fold would reveal how much of the reported gain is real discrimination versus selection optimism.
- A sharper benchmark than KFRE-8 alone would be a penalized Cox model trained on all 1,373 raw features; that comparison would isolate the benefit of SHAP-based feature selection from the benefit of having more covariates.
- If the hematologic markers replicate externally, they may reflect nutritional or inflammatory pathways in CKD progression rather than direct kidney mechanisms, a hypothesis the paper does not test.
Editorial analysis
A structured set of objections, weighed in public.
Referee Report
Summary. The paper proposes a pipeline in which binary machine-learning classifiers are trained on a CKD-progression outcome, SHAP values from these classifiers are used to select the top 40 features per model, the selected features are unioned with the KFRE-8 features, and Cox proportional hazards models are fitted on the resulting feature set to predict CKD stage progression in the MIMIC-IV cohort. The authors report that the augmented Cox models outperform a KFRE-8-only baseline, with the LR-augmented model reaching an average C-index of 0.8900 versus 0.8820 for baseline and the XGBoost-augmented model achieving a 5-year Brier score of 0.0801 versus 0.1120 for baseline.
Significance. The application area is clinically relevant, and the idea of combining ML-based feature screening with classical survival models is reasonable and builds on prior work. If the reported improvements were valid, the identified features would merit further investigation. The manuscript also ships code and uses a public dataset, which supports reproducibility. However, the current evaluation is compromised by temporal leakage and selection leakage, so the numerical claims are not supported as presented. The limitations section itself acknowledges the need for external validation and warns that features may proxy unmodeled processes, consistent with the concerns raised below.
major comments (4)
- [§3.1, Tables 9–14] No index date is defined for the survival analysis. Progression is defined as an advanced CKD stage diagnosed after an earlier less-severe stage, but no baseline time is specified at which all predictor features must have been measured. The selected feature sets include time-indexed variables such as Creatininelast, UreaNitrogenlast, Protein/CreatinineRatiolast, CholesterolTotalfirst, and Renal dialysis status. In a Cox model (Appendix F) covariates must be measured at time zero; if any of these values were recorded after the progression event, the model uses future information, which inflates the C-index and lowers the Brier score. The authors should define a baseline (e.g., the first CKD diagnosis) and truncate all measurements at that date, then re-run the analysis.
- [§3.2.2, §3.3] Feature selection is performed on the full dataset before the Cox cross-validation. Section 3.2.2 describes a single 'final feature set' selected by SHAP, and Section 3.3 then applies five-fold cross-validation to the Cox model. This means the test-fold outcomes can influence which features are selected, giving optimistically biased performance estimates. The SHAP selection, the Bayesian hyperparameter optimization of the classifiers, and the choice of the Cox penalizer (0.0007) must be nested inside the cross-validation loop to obtain unbiased estimates.
- [§3.2.1, §3.3] The feature-selection classifiers are trained on the same binary progression outcome and the same cohort that is later used to evaluate the Cox models. This creates circularity: the selected predictors are chosen by models that already have access to the outcome, and the Cox improvement is therefore partly by construction. The authors should demonstrate added predictive value through a properly nested internal validation, or report external validation, which they already identify as necessary in Section 5.
- [Tables 6, 7] The reported improvements are small and are presented without any measure of uncertainty or significance testing. The average C-index difference between the LR-augmented and baseline models is 0.008, and Table 6 reports standard deviations of 0.0092 and 0.0082, respectively; similarly, the best 5-year Brier score gain is 0.032. Without confidence intervals, bootstrap estimates, or paired significance tests, the observed differences cannot be distinguished from noise. The authors should provide such tests, especially because six augmented models are compared against one baseline.
minor comments (5)
- [§3.1] The text contains a typo: 'descibed' should be 'described', and the MIMIC-IV size is written as '364,627 thousand medical records', which is unclear; likely '364,627' patients is intended.
- [Appendix E] The word 'coaliton' should be 'coalition'.
- [Tables 9–14] The table headers read 'F eatures' with an extra space; this should be 'Features'.
- [Appendix J, Figures 13–14] Figure 13 is captioned 'FCNN-augmented Cox model' and Figure 14 'ResNet-augmented Cox model', but these duplicates appear after Figures 10 and 11 already show FCNN and ResNet. The captions or figure numbering appear to be mislabeled and should be corrected.
- [§3.1, Table 7] The median follow-up is 111.5 days, yet Brier scores are reported at 5 years. The authors should clarify how 5-year predictions are obtained from a cohort with such short observed follow-up and whether censoring is properly accounted for in the Brier score.
Circularity Check
Augmented Cox gains are partly by construction: the added features were selected on the same CKD progression outcome and then evaluated on the same cohort, with no index date ensuring the features precede the event.
-
fitted input called prediction
[Sections 3.1, 3.2.2, and 3.3 (outcome definition, feature selection, Cox fitting)]
"we define a binary variable to indicate CKD progression, deemed observed if a patient is diagnosed with a more advanced CKD stage at any time after an earlier diagnosis of a less severe stage... For each binary classifier, we identified the 40 features with the highest mean absolute Shapley values. The union of these top features, along with those defined in KFRE-8, was then selected as the final feature set. The data for the final feature set obtained from each binary classifier were used to train the CPHMs."
The binary classifiers used for SHAP-based selection were trained to predict the same binary CKD progression outcome that defines the CPHM event. The final feature set is therefore a function of the outcome labels in this cohort. The CPHM is then fitted and five-fold cross-validated on this same cohort, with a single 'final feature set' chosen before the Cox evaluation. Because feature selection is not nested inside the Cox cross-validation, the validation folds' outcomes influenced which features were tested, so the reported C-index and Brier-score improvements of the augmented Cox models over KFRE-8 are partly a refit of outcome-selected inputs rather than an independent predictive test.
full rationale
The central circular step is outcome-dependent feature selection followed by same-cohort evaluation. The ML models are trained on the binary progression label, SHAP identifies the features most associated with that label, and those features are then entered into a Cox model that is evaluated on the same patients; the augmented model's gain over the KFRE-8 baseline is therefore partly guaranteed by construction rather than by external predictive content. This is not full definitional circularity because the Cox model still estimates survival coefficients and could in principle fail to improve, but the feature-selection protocol removes the independence needed to call the gain a clean prediction. No load-bearing self-citation chain is present: Liu et al. (2023) is a methodological template, not a uniqueness theorem, and the KFRE features are external clinical inputs. Separately, the paper never defines an index date or feature-measurement window, so features such as 'Creatininelast' and 'Renal dialysis status' could be measured after the progression event; that is a serious lookahead-leakage correctness risk rather than a definitional circularity, and it further undermines the reported improvements. The score of 6 reflects the partial circularity of the main predictive claim, not a full reduction of the Cox model to its inputs.
Assumptions & free parameters
free parameters (4)
- Cox penalizer =
0.0007
- Number of top SHAP features per model =
40
- ML model hyperparameters =
See Tables 3 and 4
- Binary classifier threshold tau =
Not reported (assumed default 0.5)
assumptions (5)
- domain assumption CKD progression is accurately identified by ICD-9 diagnosis codes in MIMIC-IV.
- domain assumption Predictor features are measured before the progression event.
- domain assumption Cox proportional hazards assumption holds for the augmented models.
- ad hoc to paper SHAP values from binary classifiers trained on the outcome are valid guides for selecting time-to-event predictors.
- domain assumption Censoring is independent of the outcome (non-informative censoring).
Cite this review
Pith. "Pith review of Integrated Machine Learning and Survival Analysis Modeling for Enhanced Chronic Kidney Disease Risk Stratification." pith.science (2026). https://pith.science/paper/DZIXGGDG
@misc{pith2026241110754,
  author       = {Pith},
  title        = {Pith review of: Integrated Machine Learning and Survival Analysis Modeling for Enhanced Chronic Kidney Disease Risk Stratification},
  year         = {2026},
  howpublished = {\url{https://pith.science/paper/DZIXGGDG}},
  note         = {Machine review of arXiv:2411.10754}
}
read the original abstract
Chronic kidney disease (CKD) is a significant public health challenge, often progressing to end-stage renal disease (ESRD) if not detected and managed early. Early intervention, warranted by silent disease progression, can significantly reduce associated morbidity, mortality, and financial burden. In this study, we propose a novel approach to modeling CKD progression using a combination of machine learning techniques and classical statistical models. Building on the work of Liu et al. (2023), we evaluate linear models, tree-based methods, and deep learning models to extract novel predictors for CKD progression, with feature importance assessed using Shapley values. These newly identified predictors, integrated with established clinical features from the Kidney Failure Risk Equation, are then applied within the framework of Cox proportional hazards models to predict CKD progression.
Figures


Figures from the paper (14 more)





Reference graph
Works this paper leans on
-
[1]
Machine learning to predict end stage kidney disease in chronic kidney disease
Qiong Bai, Chunyan Su, Wen Tang, and Yike Li. Machine learning to predict end stage kidney disease in chronic kidney disease. Scientific Reports, 12 0 (1): 0 8377, 2022. doi:10.1038/s41598-022-12316-z
-
[2]
Random forests
Leo Breiman. Random forests. Machine learning, 45 0 (1): 0 5--32, 2001
2001
-
[3]
Classification and regression trees
Leo Breiman, Jerome Friedman, Charles J Stone, and Richard A Olshen. Classification and regression trees. Wadsworth International Group, 1984
work page 1984
-
[4]
Verification of forecasts expressed in terms of probability
Glenn W Brier. Verification of forecasts expressed in terms of probability. Monthly weather review, 78 0 (1): 0 1--3, 1950
1950
-
[5]
Xgboost: A scalable tree boosting system
Tianqi Chen and Carlos Guestrin. Xgboost: A scalable tree boosting system. In Proceedings of the 22nd ACM SIGKDD International Conference on Knowledge Discovery and Data Mining, KDD '16, pages 785--794, New York, NY, USA, 2016. Association for Computing Machinery. ISBN 9781450342322. doi:10.1145/2939672.2939785. URL https://doi.org/10.1145/2939672.2939785
arXiv 2016
-
[6]
D. R. Cox. Regression models and life-tables. Journal of the Royal Statistical Society: Series B (Methodological), 34 0 (2): 0 187--220, 1972. ISSN 0035-9246. doi:10.1111/j.2517-6161.1972.tb00899.x. URL https://doi.org/10.1111/j.2517-6161.1972.tb00899.x
arXiv 1972
-
[7]
Kidney failure and the kidney failure risk equations (kfre): What you need to know
National Kidney Foundation. Kidney failure and the kidney failure risk equations (kfre): What you need to know. https://www.kidney.org/content/kidney-failure-and-kidney-failure-risk-equations-kfre-what-you-need-to-know, June 2023. Accessed: 2024-01-08
work page 2023
-
[8]
Evaluating the yield of medical tests
Frank E Harrell, Robert M Califf, David B Pryor, Kerry L Lee, and Robert A Rosati. Evaluating the yield of medical tests. Jama, 247 0 (18): 0 2543--2546, 1982
1982
Show all 23 references
-
[9]
Deep residual learning for image recognition
Kaiming He, Xiangyu Zhang, Shaoqing Ren, and Jian Sun. Deep residual learning for image recognition. In Proceedings of the IEEE Conference on Computer Vision and Pattern Recognition (CVPR), pages 770--778, June 2016. doi:10.1109/CVPR.2016.90
2016 doi
-
[10]
Hosmer, Stanley Lemeshow, and Rodney X
David W. Hosmer, Stanley Lemeshow, and Rodney X. Sturdivant. Applied Logistic Regression. John Wiley & Sons, Hoboken, New Jersey, 3rd edition, 2013. ISBN 978-0470582473. doi:10.1002/9781118548387
2013 doi
-
[11]
Alistair E. W. Johnson, Tom J. Pollard, Lu Shen, and Li wei H. Lehman. Mimic-iv documentation, 2024. URL https://mimic.mit.edu/docs/iv/. Accessed: 2024-08-08
2024
-
[12]
Chronic kidney disease
Kamyar Kalantar-Zadeh, Tazeen H Jafar, Dorothea Nitsch, Brendon L Neuen, and Vlado Perkovic. Chronic kidney disease. The lancet, 398 0 (10302): 0 786--802, 2021
2021
-
[13]
Estimating the financial cost of chronic kidney disease to the nhs in england
Marion Kerr, Benjamin Bray, James Medcalf, Donal J O'Donoghue, and Beverley Matthews. Estimating the financial cost of chronic kidney disease to the nhs in england. Nephrology Dialysis Transplantation, 27 0 (suppl\_3): 0 iii73--iii80, 2012
2012
-
[14]
Deep learning
Yann LeCun, Yoshua Bengio, and Geoffrey Hinton. Deep learning. Nature, 521 0 (7553): 0 436--444, May 2015. doi:10.1038/nature14539
2015 doi
-
[15]
Combining machine learning with cox models to identify predictors for incident post-menopausal breast cancer in the uk biobank
Xiaonan Liu, Davide Morelli, Thomas J Littlejohns, David A Clifton, and Lei Clifton. Combining machine learning with cox models to identify predictors for incident post-menopausal breast cancer in the uk biobank. Scientific Reports, 13 0 (1): 0 9221, 2023. doi:10.1038/s41598-0...
2023 doi
-
[16]
Lundberg and Su-In Lee
Scott M. Lundberg and Su-In Lee. A unified approach to interpreting model predictions, 2017. URL https://shap.readthedocs.io/. Accessed: 2024-08-08
2017
-
[17]
Lundberg, Gabriel Erion, Hugh Chen, Alex DeGrave, Jordan M
Scott M. Lundberg, Gabriel Erion, Hugh Chen, Alex DeGrave, Jordan M. Prutkin, Bala Nair, Ronit Katz, Jonathan Himmelfarb, Nisha Bansal, and Su-In Lee. From local explanations to global understanding with explainable ai for trees. Nature Machine Intelligence, 2 0 (1): 0 2522--5...
2020
-
[18]
Major, David Shepherd, Jonathan F
Rupert W. Major, David Shepherd, Jonathan F. Medcalf, Gang Xu, Laura J. Gray, and Nigel J. Brunskill. The kidney failure risk equation for prediction of end stage renal disease in uk primary care: An external validation and clinical impact projection cohort study. PLOS Medicin...
2019 doi
-
[19]
The explanation game: Explaining machine learning models using shapley values
Luke Merrick and Ankur Taly. The explanation game: Explaining machine learning models using shapley values. In Machine Learning and Knowledge Extraction: 4th IFIP TC 5, TC 12, WG 8.4, WG 8.9, WG 12.9 International Cross-Domain Conference, CD-MAKE 2020, Dublin, Ireland, August ...
2020
-
[20]
A value for n-person games
Lloyd S Shapley. A value for n-person games. Contributions to the Theory of Games, 2, 1953
1953
-
[21]
Multinational assessment of accuracy of equations for predicting risk of kidney failure: a meta-analysis
Navdeep Tangri, Morgan E Grams, Andrew S Levey, Josef Coresh, Lawrence J Appel, Brad C Astor, Gabriel Chodick, Allan J Collins, Ognjenka Djurdjev, C Raina Elley, et al. Multinational assessment of accuracy of equations for predicting risk of kidney failure: a meta-analysis. Ja...
2016
-
[22]
Comparison and development of machine learning tools in the prediction of chronic kidney disease progression
Jing Xiao, Ruifeng Ding, Xiulin Xu, Haochen Guan, Xinhui Feng, Tao Sun, Sibo Zhu, and Zhibin Ye. Comparison and development of machine learning tools in the prediction of chronic kidney disease progression. Journal of Translational Medicine, 17 0 (1): 0 119, 2019. doi:10.1186/...
2019 doi
-
[23]
Nomogram predicting the risk of three-year chronic kidney disease adverse outcomes among east asian patients with ckd
Huizhen Ye, Youyuan Chen, Peiyi Ye, Yu Zhang, Xiaoyi Liu, Guanqing Xiao, Zhe Zhang, Yaozhong Kong, and Gehao Liang. Nomogram predicting the risk of three-year chronic kidney disease adverse outcomes among east asian patients with ckd. BMC Nephrology, 22 0 (1): 0 322, 2021. doi...
2021 doi
Reviewed August 12, 2026 · model on record in the stance chip above.
Discussion (0). Continue with ORCID to comment.