REVIEW 4 major objections 3 minor 27 references
Dynamics of phagocytosis through interplay of forces
T0 review · 4 major / 3 minor · reviewed 2026-08-12 · deepseek-v4-flash
Pith's one-line read A minimal two-force model of bacteria and phagocytes yields three regimes—bacterial clearance, bacterial takeover with phagocyte trapping, and bistability—controlled by the attraction-to-repulsion ratio.
desk verdict First multi-agent phagocytosis model with a real phase diagram, but the reproduction rule is inverted (effective rate 0.01 vs stated 0.99) and the quantitative results need a redo. read the letter →
The pith
A machine-rendered reading of the paper's core claim, the machinery that carries it, and where it could break.
The reading
What carries the argument
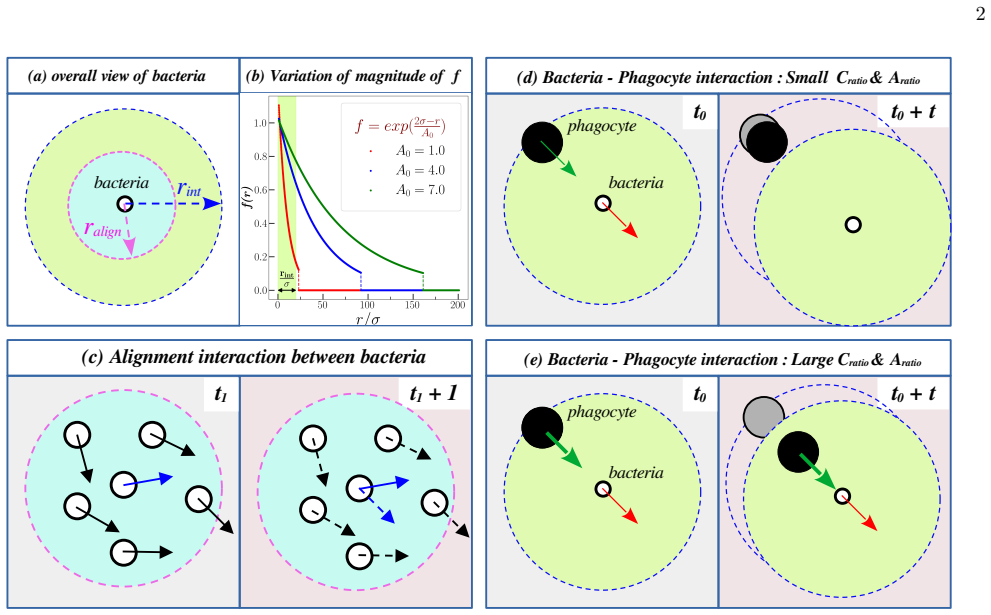
The load-bearing mechanism is the pair of exponential inter-species forces: a bacterium feels a repulsion $f(r,A_0) = \exp((\sigma_i+\sigma_j-|r_{ij}|)/A_0)$ away from nearby phagocytes, while a phagocyte feels an attraction $f_1(r)$ with decay scale $A_1$ toward nearby bacteria, with an attraction strength $C_{att}(1-\lambda\rho_2)$ and a receptor-layer engulfment term. Their competition is encoded in $C_{ratio} = C_{att}/C_{rep}$ and $A_{ratio} = A_1/A_0$, the control parameters scanned across the phase diagram. Around this core, bacteria align with neighbors under a density-dependent speed $(1-\lambda_1\rho_1)$ that promotes clustering, reproduce only when a uniform random number exceeds $P_{rep}$, and are removed when they enter the phagocyte receptor layer. The statistical observables of the paper, cluster-size distributions and phagocyte mean-square displacement, are what carry the identification of the three regimes.
What would settle it
Re-run the simulation with the reproduction condition changed to reproduce when a uniform random number is below 0.99, keeping everything else fixed, and compare the phase diagram, the bistable window, and the log-normal time distributions; a large shift or loss of the bistable regime would show that the central claim depends on the inverted reproduction rule.
Extended reading notes
Core claim
On the paper's own terms, the central discovery is a phase diagram in the plane of $C_{ratio}$ (attraction strength over repulsion strength) and $A_{ratio}$ (attraction decay range over repulsion decay range). When attraction dominates, phagocytes engulf bacteria faster than bacteria reproduce, the bacterial fraction $f = (n_{b,0} - n_b(t))/n_{b,0}$ stays positive, the cluster-size distribution decays algebraically, and phagocyte motion crosses from ballistic to subdiffusive. When repulsion dominates, bacteria evade engulfment, reproduce past the initial count, form clusters with an exponential tail and a plateau at intermediate sizes, and phagocytes become trapped, their mean-square displacement saturating. Between the two regimes, the probability $P_+$ of a positive $f$ takes intermediate values, with $P_+$ and $P_-$ both nonzero and roughly equal near the boundary, which the paper identifies as bistability. The paper also reports that times to bacterial collapse and to fivefold growth are log-normally distributed, with the mean collapse time decreasing as attraction strength increases.
Load-bearing premise
The entire phase boundary rests on an effective per-step bacteria reproduction rate of 1 percent, because the rule reproduces only when a uniform random number exceeds 0.99 even though the paper calls 0.99 the reproduction probability; if that rate was intended to be 99 percent, the reported balance between reproduction and engulfment would shift.
Editorial extensions
If this is right
- In attraction-dominated regimes, the bacterial population falls to a small remnant and phagocyte motion becomes subdiffusive rather than diffusive or saturated.
- In repulsion-dominated regimes, bacteria multiply to at least five times their initial count, form large clusters, and trap phagocytes so that phagocyte mean-square displacement saturates.
- Near the phase boundary, identical parameter sets produce both bacterial clearance and bacterial takeover in different simulation runs, so the system is bistable rather than sharply transitioning.
- The distributions of times to bacterial extinction and to fivefold bacterial growth are log-normal, and the mean extinction time shrinks as the attraction-to-repulsion strength ratio grows.
Reading between the lines
- If the two-force competition is generic, similar phase diagrams might appear in other active predator–prey or immune-clearance contexts, where changing only the ratio of interaction strengths could switch a system between clearance, escape, and coexistence.
- The reported bistability implies history dependence: a transient pulse that temporarily strengthens attraction could push a boundary system from bacterial takeover into clearance, a prediction that could be tested by adding controlled chemoattractant pulses to the simulation or experiment.
- Because the reproduction rule inverts the stated probability (a uniform random number must exceed $P_{rep}=0.99$, giving a 1% per-step reproduction rate), the specific phase-boundary locations likely depend on this effective rate; what may survive is the qualitative three-regime structure, not the exact $C_{ratio}$ and $A_{ratio}$ values.
Signed reviews
Editorial analysis
A structured set of objections, weighed in public.
Referee Report
Summary. The paper presents a minimalist agent-based model of multi-agent phagocytosis in which bacteria are self-propelled disks that reproduce at a fixed rate and are repelled by nearby phagocytes, while phagocytes are passive disks attracted to bacteria. The authors map a phase diagram in the relative strength and range of attraction vs repulsion (Cratio and Aratio), quantify the probability that bacterial number decreases (f>0), and identify a bistable region between a phagocytosis-dominated regime (bacteria depleted) and a reproduction-dominated regime (bacteria grow and trap phagocytes). They further analyze bacterial cluster-size distributions and phagocyte mean-square displacement. The central claim is that the balance between bacterial reproduction and phagocytic engulfment is governed by the two opposing forces, with a smooth transition through a bistable window.
Significance. If the results are correct, the paper offers a simple, computationally tractable framework for a biologically relevant multi-agent process, with falsifiable predictions about phase behavior, cluster statistics, and phagocyte trapping. The study uses a large number of independent runs (600-1000) and reports qualitative systematics across parameter space. However, the reported reproduction rule is implemented as a 1% per-step probability rather than the stated 99%, and the assignments of f>0 and f<0 regimes are inconsistent across sections; these issues materially affect the quantitative and even qualitative interpretation of the results. The central two-regime/bistability picture may be defensible after correction, but the current manuscript requires substantial revision.
major comments (4)
- [Section II, reproduction rules (i)-(ii)] The reproduction rule is implemented as: a bacterium reproduces when a uniform random number r satisfies r > Prep, and the text states Prep = 0.99. Since r is uniform on [0,1], the actual per-step reproduction probability is P(r > 0.99) = 0.01, not 0.99. This is a factor of 100 discrepancy. The phase diagram in Fig. 2(a), the P1/P2 curves in Figs. 3-4, and the claimed balance between reproduction and engulfment are all computed with this effective rate, yet the text presents 0.99 as the reproduction probability. The authors should either change the rule to r < Prep or restate the model as having a 0.01 reproduction probability; in either case, a systematic sensitivity check on Prep is needed before the quantitative phase boundaries can be trusted.
- [Sections III, 'Cluster size distributions' and 'Dynamic of Phagocytes', and Fig. 5-6 captions] The assignment of f>0 and f<0 phases is internally inconsistent. The phase-diagram description says that small Cratio and Aratio give f<0 (bacteria grow) and large values give f>0 (depletion). Yet in the later analysis the text assigns Cratio values 3.5, 4.0, 4.5 to the f>0 phase and 8.0, 8.5, 9.0 to the f<0 phase, and then describes trapping and cluster growth for the 'f<0' values. This swaps the labels and contradicts the phase diagram. For example, the caption of Fig. 6 states that Cratio = 8.0, 8.5, 9.0 are in the f<0 region, but the phase diagram would place these in the f>0 (depletion) region. This makes the interpretation of the cluster-size distributions and the MSD curves ambiguous and must be corrected consistently throughout the text and figures.
- [Section III, 'Phase Diagram' and 'Bi-stability'] No error bars or confidence intervals are provided for the probabilities P+, P1, and P2, nor for the fitted exponents α (Fig. 5) and β (Fig. 6), nor for the log-normal fit parameters in Figs. 3(b) and 4(b). For P+ with 800 runs, the standard error is at most about 1.8%, which is essential for assessing whether intermediate P+ values near the boundary represent genuine bistability or simply statistical uncertainty. Similarly, the log-normal fits are shown without goodness-of-fit measures, so the claim that the passage-time distributions are log-normal is not yet supported.
- [Section III, 'Phase Diagram'] The text refers to 'the phase diagram shown in FIG.2(a)' and mentions a colorbar representing P+, but the caption of Fig. 2 describes (a) as a plot of nb(t) vs. t. The actual phase diagram (a heatmap over Cratio and Aratio) is not clearly identified in any figure. This mismatch between text and figure needs to be resolved, either by correcting the citation or by adding the missing phase diagram.
minor comments (3)
- [Throughout] There are numerous typographical errors that obscure the meaning: 'balletic' should be 'ballistic' (Section III, MSD discussion); 'summery' should be 'summary' (Section IV); 'accordence' should be 'accordance'; 'the behavior of the behavior of the system' appears in the Fig. 2 caption; and 'the parameters in the f > 0 and f > 0 regime are equivalent' should read f>0 and f<0.
- [Section III, 'Dynamic of Phagocytes'] The sentence 'In this regime the parameters in the f > 0 and f > 0 regime are equivalent' is likely a typo and should refer to the two different regimes. Also, the inset of Fig. 6 is described as showing nin(t) vs. t, but the figure caption says the inset is in the same frame; the reference to 'FIG.6(a)' is not consistent.
- [Section III, 'Bi-stability'] The definition of f as (nb,0 - nb)/nb,0 means f>0 corresponds to a decrease in bacterial number, but the text sometimes uses 'f > 0' to mean 'positive phagocytosis' and at other times discusses 'f > 0' as the growth phase. This usage should be made uniform.
Circularity Check
No circularity; simulation outcomes are not fitted to or defined by the results they purport to show, though a reproduction-rate inversion is a separate correctness concern.
full rationale
The paper's derivation chain runs from the equations of motion (Eqs. 1–9) to the phase diagram, P1/P2, cluster-size distributions, and phagocyte MSD. No parameter is fitted to the quantities presented as results: P+, P1, P2, tau1, tau2, alpha, and beta are computed from independent simulation runs, and the log-normal fits are descriptive, not used to 'predict' the fitted quantities. No load-bearing self-citation is present; the references to the authors' prior work (e.g., Refs. 10, 12–15, 17, 19, 20) are background citations and do not supply a uniqueness theorem or an ansatz that forces the reported phase behavior. The phase behavior is partly anticipated by the control parameters, since Cratio = Catt/Crep and Aratio = A1/A0 directly encode the relative strength and decay of the two opposing forces, and the abstract's statement that the balance is 'governed by the interplay of the two opposing forces' is a description of the model rather than a fitted prediction. The bistable window, first-passage-time statistics, trapping, and sub-diffusive crossover are emergent and are not equal to the inputs by construction. The reproduction rule is implemented as 'r > Prep' with Prep = 0.99, which effectively gives a per-step reproduction probability of 0.01 while the text calls Prep the reproduction probability; this is a genuine implementation/labeling defect that shifts the quantitative phase boundary, but it is not circularity because the reproduction rate is an input parameter, not a quantity the paper claims to derive or predict. The internal f>0/f<0 label swaps in the cluster-size and MSD sections complicate interpretation but do not constitute a reduction of a claimed result to its own input. Overall, the central claims are simulation outcomes with independent content, so no significant circularity is found.
Assumptions & free parameters
free parameters (9)
- Cratio = Catt/Crep =
Scanned 2.0 to 9.0; boundary near 5.5-6.5 for Aratio=6
- Aratio = A1/A0 =
6.0 and 7.0
- lambda (density-dependent attraction reduction) =
0.50 (0.20 and 0.40 also tested)
- lambda1 (alignment density feedback coefficient) =
Not specified
- Prep (reproduction threshold) =
0.99 (effective rate 0.01)
- eta (noise amplitude) =
0.01
- Ccore (hardcore force strength) =
30.0
- v0 (bacterial self-propulsion speed) =
0.1
- D (phagocyte diffusivity) =
0.001
assumptions (4)
- domain assumption Bacteria are self-propelled disks that align with neighbors within range Rb and reduce speed with local density.
- ad hoc to paper Inter-species forces are exponential: bacterial repulsion f(r)=exp((sigma_i+sigma_j-r)/A0) and phagocyte attraction f1(r) with cutoff at 0.1 f(0,A1), with receptor-layer engulfment when |r_ij| < sigma_p+r_rec.
- domain assumption Bacteria reproduce at a fixed per-step rate with no natural death; phagocytes never die or lose function.
- standard math Overdamped position updates with additive noise capture the dynamics at the simulated time scale.
Cite this review
Pith. "Pith review of Dynamics of phagocytosis through interplay of forces." pith.science (2026). https://pith.science/paper/H272WBW3
@misc{pith2026241112466,
  author       = {Pith},
  title        = {Pith review of: Dynamics of phagocytosis through interplay of forces},
  year         = {2026},
  howpublished = {\url{https://pith.science/paper/H272WBW3}},
  note         = {Machine review of arXiv:2411.12466}
}
read the original abstract
Phagocytosis is the process by which cells, which are 5 to 10 times larger than the particle size, engulf particles, holding substantial importance in various biological contexts ranging from the nutrient uptake of unicellular organisms to immune system of humans, animals etc. While the previous studies focused primarily on the mechanism of phagocytosis, in this study we have a taken a different route by studying the dynamics of the phagocytes in a system consisting of many bacteria and a small number of phagocytes. We put forward a minimalist framework that models bacteria and phagocytes as active and passive circular disks, respectively. The interactions are governed by directional forces: phagocytes are attracted toward bacteria, while bacteria experience a repulsive force in proximity to phagocytes. Bacteria are capable of reproduction at a fixed rate, and the balance between bacterial reproduction and phagocytic engulfment is governed by the interplay of the two opposing forces. In attraction dominated regimes, bacterial populations decrease rapidly, while in repulsion dominated regimes, bacterial clusters grow and impede phagocytes, often resulting in phagocyte trapping. Conversely, in attraction-dominated scenarios, only a few bacteria remain at later times, rendering the motion of the phagocytes diffusive. Further, the transition between the two regimes occurs through a regime of bi-stability. Our study further describes the dynamics of both species using the tools of statistical analysis, offering insights into the internal dynamics of this system.
Figures


Figures from the paper (3 more)


Reference graph
Works this paper leans on
-
[1]
Vicsek, A
T. Vicsek, A. Czir´ ok, E. Ben-Jacob, I. Cohen, and O. Shochet, Novel type of phase transition in a system of self-driven particles, Physical review letters 75, 1226 (1995)
1995
-
[2]
Bechinger, R
C. Bechinger, R. Di Leonardo, H. L¨ owen, C. Reichhardt, G. Volpe, and G. Volpe, Active particles in complex and crowded environments, Reviews of modern physics 88, 045006 (2016)
2016
- [3]
-
[4]
Vicsek and A
T. Vicsek and A. Zafeiris, Collective motion, Physics re- ports 517, 71 (2012)
2012
-
[5]
Toner, Y
J. Toner, Y. Tu, and S. Ramaswamy, Hydrodynamics and phases of flocks, Annals of Physics 318, 170 (2005)
2005
-
[6]
M. C. Marchetti, J.-F. Joanny, S. Ramaswamy, T. B. Liverpool, J. Prost, M. Rao, and R. A. Simha, Hydrody- namics of soft active matter, Reviews of modern physics 85, 1143 (2013)
2013
-
[7]
Ramaswamy, Active matter, Journal of Statistical Me- chanics: Theory and Experiment 2017, 054002 (2017)
S. Ramaswamy, Active matter, Journal of Statistical Me- chanics: Theory and Experiment 2017, 054002 (2017)
2017
-
[8]
M. Das, C. F. Schmidt, and M. Murrell, Introduction to active matter, Soft Matter 16, 7185 (2020)
2020
Show all 27 references
-
[9]
Toner, Birth, death, and flight: A theory of malthusian flocks, Physical review letters 108, 088102 (2012)
J. Toner, Birth, death, and flight: A theory of malthusian flocks, Physical review letters 108, 088102 (2012)
2012
-
[10]
P. K. Mishra and S. Mishra, Active polar flock with birth and death, Physics of Fluids 34 (2022)
2022
-
[11]
A. P. Jena and B. S. Mishra, Ordering kinetics and steady state of malthusian flock, Physics of Fluids 35 (2023)
2023
-
[12]
Jena and S
P. Jena and S. Mishra, Spatio-temporal patterns in grow- ing bacterial suspensions: Impact of growth dynamics, arXiv preprint arXiv:2408.00403 (2024)
2024 arXiv
-
[13]
P. S. Mondal, P. K. Mishra, T. Vicsek, and S. Mishra, Dynamical swirl structures powered by microswimmers in active nematics, arXiv preprint arXiv:2407.05861 (2024)
2024 arXiv
-
[14]
P. K. Mishra, A. Puitandy, and S. Mishra, Directional cues affect the collective behaviour of self-propelled par- ticles in one dimension, Europhysics Letters 147, 67001 (2024)
2024
-
[15]
P. B. Sampat and S. Mishra, Polar swimmers induce sev- eral phases in active nematics, Physical Review E 104, 024130 (2021)
2021
-
[16]
S. R. McCandlish, A. Baskaran, and M. F. Hagan, Spon- taneous segregation of self-propelled particles with differ- ent motilities, Soft Matter 8, 2527 (2012)
2012
-
[17]
J. P. Singh, S. Kumar, and S. Mishra, Bond disorder en- hances the information transfer in the polar flock, Journal of Statistical Mechanics: Theory and Experiment 2021, 083217 (2021)
2021
-
[18]
Chepizhko, E
O. Chepizhko, E. G. Altmann, and F. Peruani, Optimal noise maximizes collective motion in heterogeneous me- dia, Physical review letters 110, 238101 (2013)
2013
-
[19]
R. Das, M. Kumar, and S. Mishra, Polar flock in the presence of random quenched rotators, Physical Review E 98, 060602 (2018)
2018
-
[20]
Dolai, A
P. Dolai, A. Simha, and S. Mishra, Phase separation in binary mixtures of active and passive particles, Soft Mat- ter 14, 6137 (2018)
2018
-
[21]
Uribe-Querol and C
E. Uribe-Querol and C. Rosales, Phagocytosis: our cur- rent understanding of a universal biological process, Fron- tiers in immunology 11, 1066 (2020)
2020
-
[22]
D. M. Richards and R. G. Endres, The mechanism of phagocytosis: two stages of engulfment, Biophysical jour- nal 107, 1542 (2014)
2014
-
[23]
Herant, V
M. Herant, V. Heinrich, and M. Dembo, Mechanics of neutrophil phagocytosis: experiments and quantitative models, Journal of cell science 119, 1903 (2006)
2006
-
[24]
R. K. Sadhu, S. R. Barger, S. Peniˇ c, A. Igliˇ c, M. Krendel, N. C. Gauthier, and N. S. Gov, A theoretical model of ef- ficient phagocytosis driven by curved membrane proteins and active cytoskeleton forces, Soft matter 19, 31 (2023)
2023
-
[25]
M. A. Hamed and A. A. Nepomnyashchy, Three- dimensional phase field model for actin-based cell mem- brane dynamics, Mathematical Modelling of Natural Phe- nomena 16, 56 (2021)
2021
-
[26]
Winkler, M
B. Winkler, M. A. Hamed, A. A. Nepomnyashchy, and F. Ziebert, Physical phase field model for phagocytosis, New Journal of Physics 26, 013029 (2024)
2024
-
[27]
D. Paul, S. Achouri, Y.-Z. Yoon, J. Herre, C. E. Bryant, and P. Cicuta, Phagocytosis dynamics depends on target shape, Biophysical journal 105, 1143 (2013)
2013
Reviewed August 12, 2026 · model on record in the stance chip above.
Discussion (0). Continue with ORCID to comment.