REVIEW 3 major objections 5 minor 44 references
Starkiller: subtracting stars and other sources from IFU spectroscopic data through forward modeling
T0 review · 3 major / 5 minor · reviewed 2026-08-12 · deepseek-v4-flash
Pith's one-line read Starkiller forward-models every catalog source in an integral-field spectrograph's field of view and subtracts the simulated scene, so single exposures of crowded, trailed, or satellite-struck datacubes become usable for science.
desk verdict A genuinely useful open-source tool for forward-modeling subtractive cleaning of IFU datacubes, whose headline '90% removal' claim is stronger than the in-sample evidence supports. read the letter →
The pith
A machine-rendered reading of the paper's core claim, the machinery that carries it, and where it could break.
The reading
What carries the argument
The carrying mechanism is the synthetic scene: a simulated datacube built at ten times the data's spatial resolution by convolving a PSF with each catalog source's position, multiplying by that star's best-match model spectrum, rescaling the flux to the Gaia G-band magnitude (converted from Vega to AB with a +0.118 mag offset calibrated on DA white dwarfs), and reddening the result with an extinction grid. Three PSF models are offered—Moffat, Gaussian, and a data PSF formed by normalizing and averaging the trails of isolated calibration stars—and the data PSF is what captures the seeing variability recorded along a streak, which analytic profiles miss. Spectral matching uses the Pearson correlation coefficient between the treated observed spectrum and every reddened model, deliberately avoiding $\chi^2$ so that flux normalization never enters the match. A final wavelength-dependent flux correction, built from the median model-to-observation flux ratio of well-correlated calibration sources, absorbs MUSE calibration trends. Satellite streaks get their own pathway: they are detected with Canny edge detection and a Hough line transform, then subtracted using the stellar PSF parameters stretched into a line, with the spectrum extracted by PSF photometry because satellite SEDs cannot be forward-modeled.
What would settle it
Take a MUSE datacube whose field contains stars with independently known spectra (for instance from the MUSE-specific stellar library or archival high-resolution surveys), run starkiller, and measure the residual flux at each star's position: the more-than-90% flux-removal claim fails if stars whose true spectra are absent from the model grid leave residuals that scale with brightness. A second, more immediate check is the extinction output, since the paper already notes that its NGC 6563 $E(B-V)$ values run about twice the Schlafly & Finkbeiner dust map for that region; comparing per-star starkiller extinctions against spectroscopic or multi-band dust measurements across several fields would directly test whether the extinction grid is compensating for model mismatch.
Extended reading notes
Core claim
On the paper's own terms, the discovery is that a stacked stellar scene constructed almost entirely from external information—Gaia DR3 positions and G-band magnitudes for every source in the field, model stellar spectra chosen by Pearson correlation against the datacube, a Fitzpatrick (1999) extinction law with $R_V=3.1$ applied over a grid of $E(B-V)$ values, and a PSF that can be trailed or built directly from the averaged streaks of calibration stars—can be subtracted from an IFU datacube to expose the extended emission underneath. The deliberate design choice is that the scene is scaled by the catalog, not by the datacube, so the stellar models are not biased by a foreground coma or nebula; the data are used only for shape comparison and PSF determination. The paper reports residuals below 10% for the nebula field, about 5% for trailed stars when the data PSF is used versus roughly 10% for analytic Moffat or Gaussian profiles, and a successful satellite subtraction whose corrected blazar spectrum matches an uncontaminated follow-up observation. As a by-product, starkiller returns for every catalog star a spectral classification, a relative velocity from Gaussian fits to H$\beta$, H$\alpha$, Na D, and the Ca II triplet, and a line-of-sight extinction value.
Load-bearing premise
The load-bearing premise is that some member of the finite grid of stellar atmosphere models, reddened by a single Fitzpatrick (1999) extinction law with $R_V=3.1$ and scaled to Gaia G-band photometry, can reproduce what each catalog star actually looks like across 4000–9300 Å; the paper itself states that subtraction quality depends heavily on how well the spectral models fit, and warns that if the library is insufficient, extinction may be used to reshape poorly matched spectra.
Editorial extensions
If this is right
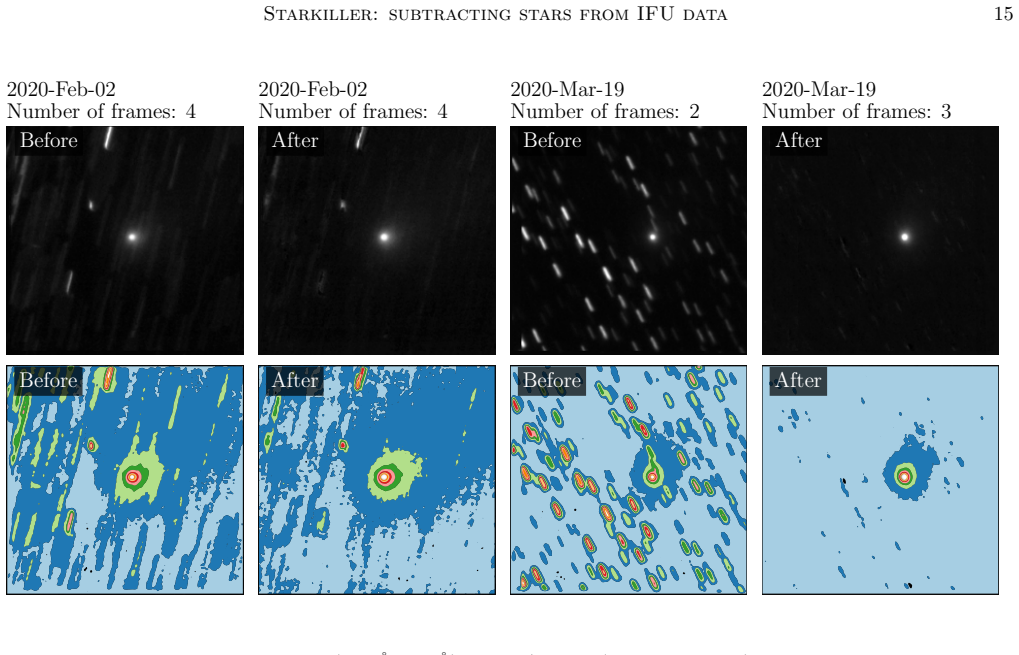
- Exposures previously rejected—crowded fields within about 10 degrees of the Galactic plane and datacubes with satellite strikes—can be recovered for science; of 51 MUSE exposures of 2I/Borisov, 27 needed starkiller and 4 were rescued from rejection.
- IFU difference imaging becomes possible from a single exposure, with no reference cube, because the reference is synthesized from the catalog and the model libraries.
- Moving-target science near the Galactic plane becomes feasible: the Solar System community can use IFUs to observe comets and asteroids in dense stellar fields that observation programs previously avoided.
- The same machinery doubles as an instrument diagnostic, since the flux-correction curve independently checks the datacube's flux calibration against Gaia photometry, and the per-star $E(B-V)$ values give a rapid independent extinction estimate for cluster fields.
- Residual stellar PSFs left after subtraction can flag variable sources, carrying standard difference-imaging practice into IFU data.
Reading between the lines
- Because the scene is scaled by the catalog rather than by the data, running starkiller across many archival MUSE fields would expose any slow wavelength-dependent drift in the instrument's flux calibration, turning the flux-correction curve into a long-term diagnostic the paper only sketches.
- The paper's own NGC 6563 result—fitted $E(B-V)$ values about twice the Schlafly & Finkbeiner dust-map estimate—suggests the extinction grid is absorbing model mismatches; a testable extension is to fit $R_V$ as a free parameter or to use Gaia BP/RP photometry to break the degeneracy between spectral type and reddening.
- The data PSF idea—averaging the streaks of calibration stars as the PSF template—is portable beyond MUSE and beyond spectroscopy, and could sharpen trailed-source subtraction in any survey that tracks non-sidereal targets.
- The satellite mode extracts clean reflectance spectra, and the finding that the satellite spectrum needs extra atmospheric extinction beyond the pipeline's correction suggests a practical route to measuring the line-of-sight airmass of satellites, which could feed brightness-prediction models for observatories.
Editorial analysis
A structured set of objections, weighed in public.
Referee Report
Summary. The paper presents starkiller, an open-source Python package that forward-models and subtracts catalogued stellar sources (and satellite streaks) from IFU datacubes. It uses Gaia DR3 positions and G-band magnitudes to scale stellar atmosphere model spectra, fits a trailed PSF (with a data-driven PSF option), matches spectral templates under a Fitzpatrick extinction grid, and constructs a synthetic scene that is subtracted from the datacube. The method is demonstrated on VLT/MUSE data of the interstellar comet 2I/Borisov, the Didymos system after the DART impact, the planetary nebula NGC 6563, and a satellite-contaminated observation of the blazar J0141-5427. The paper also claims that the package simultaneously provides stellar spectral classification, relative velocity, and line-of-sight extinction, and that it removes more than 90% of stellar flux in most cases.
Significance. The core idea is timely and useful: an IFU-specific synthetic difference-imaging tool that works for both sidereal and non-sidereal data, including trailed sources and satellite streaks, would make dense-field and satellite-affected IFU observations usable for science. The independent Gaia-based flux scaling is a genuine external anchor, and the data-PSF construction for trailed sources is an effective practical solution to seeing variability along streaks. The package is open source and the demonstrations use real, varied MUSE datasets. However, the headline quantitative claim of >90% flux removal is currently supported only by in-sample residuals, and the secondary products (relative velocity, extinction) are either explicitly not fully implemented or are shown to be in tension with external dust maps. The significance of the paper would be substantially higher if the subtraction claim were validated out-of-sample and the abstract were aligned with the actual capabilities.
major comments (3)
- [§4.4, with §3.6 and Figs. 5, 10, 16] The claim that starkiller is 'effective at removing more than 90% of the stellar flux in most cases' is not established by the evidence presented. The quoted residuals (5% for the two trailed stars in Fig. 5, 6% and 7% for the sidereal stars in Fig. 16, <10% for NGC 6563 in §3.7) are measured after the same datacube was used to select the per-source spectral template and E(B-V) via correlation (§3.5) and to construct the global flux correction spline from the same calibration sources (§3.6). This is an in-sample measure: a star whose true spectrum is not in the model grid, or whose extinction law differs from the single Fitzpatrick (1999) R_V=3.1 law, can be fit with a degraded model that the flux correction partially absorbs, and the reported residual will not reflect the true model-mismatch error. The paper itself warns in §4.1 that 'if the input stellar atmosphere library is insufficient, starkiller may be using extinction as a tool to reshape poorly matched spectra to improve the correlation,' and in §4.4 that subtraction quality 'depends heavily on how well the spectral models fit.' To support the population-level claim, the authors should provide out-of-sample validation: for example, withhold a subset of calibration sources from the flux correction and report their residuals, inject synthetic stars with spectra outside the library, or report residuals for sources not used in any fit step. Without such a test, the >90% figure cannot be taken as a statement about the general population of stars starkiller is intended to remove.
- [Abstract and §5, versus §3.5.1] The abstract and conclusion state that starkiller 'simultaneously provides stellar spectral classification, relative velocity, and line-of-sight extinction,' but §3.5.1 says the velocity routine is 'not currently fully implemented in starkiller' and is only effective for stars with prominent A–K features. No validation against known radial velocities or Gaia RVS is presented, and the example in Fig. 7 shows line-to-line scatter (e.g., Hβ: −61±23 km/s; Hα: −51±5 km/s; Na D: −32±4 km/s) whose error-weighted average is quoted without discussion of the inconsistencies. This claim should either be removed from the abstract and conclusion, or the routine should be completed and validated before publication.
- [§4.1 and Fig. 14] The paper's own analysis shows that the starkiller E(B-V) values for NGC 6563 are about twice the Schlafly & Finkbeiner (2011) dust map value (median ~0.5 mag versus 0.2271 mag), and the authors state that 'the reliability of extinction values generated by starkiller' requires further investigation. Since the abstract lists line-of-sight extinction as a primary product, the current manuscript does not support that claim. The abstract and conclusion should be qualified to state that the extinction estimates are preliminary and should not be used for scientific inference until validated, particularly given the known degeneracy between spectral type and reddening in template matching.
minor comments (5)
- [Abstract and §3.5] The phrase 'using the catalog for positions and fluxes to scale stellar models, independent of the datacube' is only partially true: the initial flux scaling is indeed independent, but the per-source E(B-V), the spectral template choice, and the global flux correction of §3.6 all depend on the datacube. This should be clarified to avoid overstating the independence.
- [§3.5, first paragraph] Typo: 'spetcra' should be 'spectra'.
- [Appendix B and §3.7] The pipeline name is spelled inconsistently: 'PampelMUSE' in the main text and 'PempelMUSE' in the Appendix B title and text. Please use a single spelling.
- [Figs. 5 and 16] The caption states 'Total residual = X%' but does not define whether this is the sum of absolute residuals divided by total counts, or another metric, and no uncertainty is given. Please define the residual metric and, ideally, provide a measure of scatter across the spatial cutout or across wavelength.
- [§4.2 and Fig. 15] The satellite spectrum fit uses a solar spectrum with a multi-component atmospheric extinction model (aerosols, Rayleigh, ozone). The authors should note the degeneracies in this fit (e.g., aerosol parameter correlations) and that this is a single example, not a general validation of satellite spectral extraction.
Circularity Check
Starkiller's headline '>90% stellar flux removal' is supported by residuals measured on the same stars that supplied the fitted spectral templates, extinction values, data PSF, and global flux correction; the reported performance is therefore in-sample, not an out-of-sample prediction.
-
fitted input called prediction
[Section 3.6 (Flux correction), with the performance claim in Section 4.4]
"We generate a wavelength-dependent flux correction by averaging the flux ratios of all sources with correlation coefficients > 0.9. We further restrict the calibration sources to be brighter than the user-defined magnitude limit, to limit the influence of bad matches and noise on the flux correction. ... Dividing all model spectra by this flux correction brings them into closer alignment with the MUSE spectra."
The flux correction C(lambda) is a smoothed average of Model/MUSE flux ratios over the bright, high-correlation calibration sources. After dividing every model by C, any calibration source whose ratio lies near the median has a residual that vanishes by construction. The reported '<10%' residuals (Figs. 5, 10, 16) and the 'more than 90% of stellar flux removed' statement in Sec. 4.4 are therefore measured on the same stars used to build C. A wavelength-dependent error common to all calibration stars is absorbed into C and is invisible in the final residual.
-
fitted input called prediction
[Section 3.5 (Spectral matching), with the caveat in Section 4.1 and the performance claim in Section 4.4]
"For every template spectrum we create an extinction grid by applying the Fitzpatrick (1999) extinction model with RV = 3.1 over the range 0 ≤ E(B−V) ≤ 4 in steps of 0.01 using the extinction (Barbary 2016) and PySynphot (STScI Development Team 2013) packages. We then calculate the correlation of the extracted spectra with the grid of reddened models. The model spectrum with the highest correlation is then used to represent the source, and re-scaled to match the catalog magnitudes."
The spectral template and E(B-V) are chosen by maximizing Pearson correlation against the extracted spectrum of the very star that is later subtracted. The reported residual for that star measures how well the best-fit reddened library spectrum reproduces the star it was fitted to, not how well the method predicts independent stars. The paper itself warns in Sec. 4.1 that 'if the input stellar atmosphere library is insufficient, starkiller may be using extinction as a tool to reshape poorly matched spectra to improve the correlation', so the fitted extinction can absorb model mismatch and the '>90%' figure does not bound errors from non-library stars.
1 more flagged steps
-
fitted input called prediction
[Section 3.4 (PSF modeling)]
"we instead create a data PSF: we normalize and average together the trails of all calibration stars in the data cube."
The data PSF used to construct the synthetic scene is literally the average of the calibration star trails, and the same stars are then used to measure subtraction residuals. For any calibration star closely resembling the average trail, the residual is small by construction. The paper acknowledges the resulting bias: 'In cases where there are few suitable calibration stars, the data PSF may be biased to those stars, and therefore not a fair representation of all sources.' Thus the residual statistics on calibration stars overstate the expected performance on fainter, crowded, or non-representative sources.
full rationale
The core algorithm does have genuinely independent inputs: Gaia DR3 supplies positions and G-band magnitudes, and the absolute flux scale of each model is set externally via G_AB = G_Vega + 0.118 rather than by the datacube. The satellite removal also has one external check, since the cleaned blazar spectrum is compared with a later uncontaminated observation in Sec. 4.2. However, the quantitative performance claim 'effective at removing more than 90% of the stellar flux in most cases' (Sec. 4.4) is supported by figures whose residuals are in-sample: the data PSF is built from the calibration stars, the spectral type and E(B-V) are optimized by correlation with each star's own extracted spectrum, and a global flux correction is derived from the same bright high-correlation sources and divided back into their models before the residual is measured. For a source near the median correction, the corrected model agrees with the observed spectrum by construction, so 'residual <10%' is a fit statistic, not an independent prediction. The paper's own cautions that extinction can be used to reshape poorly matched spectra (Sec. 4.1) and that subtraction quality depends heavily on model fit (Sec. 4.4) reinforce that the headline success rate is not yet established for the full population of stars Starkiller is designed to remove. The self-citations to Deam et al. (2024, in preparation) and Ridden-Harper et al. (2024) are not load-bearing for the central algorithm, so the circularity is partial rather than total.
Assumptions & free parameters
free parameters (5)
- Gaia G AB magnitude offset =
+0.118 mag
- Per-source E(B-V) =
0 to 4 in steps of 0.01
- Flux correction spline =
Savitzky-Golay window 625 Å, polynomial order 3
- PSF and trail parameters =
e.g., trail length 98 spaxels for 2019-12-31 data
- Satellite atmospheric extinction fit =
tau=0.69, a=1.61, Rayleigh 8609 mbar, Ozone 257 DU
assumptions (5)
- domain assumption Stellar atmosphere model libraries (CK, MARCS, PoWR, ESO/Pickles) adequately represent the true spectra of all catalog stars in the field.
- domain assumption The Fitzpatrick (1999) extinction law with R_V=3.1 describes the actual extinction toward every star in the field.
- domain assumption A single, wavelength-independent PSF (from the median stack over all wavelengths) is representative of all sources in the cube.
- domain assumption Gaia DR3 positions and G magnitudes are accurate and the catalog is complete enough for the relevant sources.
- domain assumption The MUSE WCS error can be corrected by a linear shift plus rotation.
Cite this review
Pith. "Pith review of Starkiller: subtracting stars and other sources from IFU spectroscopic data through forward modeling." pith.science (2026). https://pith.science/paper/VUFXRBSF
@misc{pith2026241114705,
  author       = {Pith},
  title        = {Pith review of: Starkiller: subtracting stars and other sources from IFU spectroscopic data through forward modeling},
  year         = {2026},
  howpublished = {\url{https://pith.science/paper/VUFXRBSF}},
  note         = {Machine review of arXiv:2411.14705}
}
read the original abstract
We present starkiller, an open-source Python package for forward-modeling flux retrieval from integral field unit spectrograph (IFU) datacubes. Starkiller simultaneously provides stellar spectral classification, relative velocity, and line-of-sight extinction for all sources in a catalog, alongside a source-subtracted datacube. It performs synthetic difference imaging by simulating all catalog sources in the field of view, using the catalog for positions and fluxes to scale stellar models, independent of the datacube. This differencing method is particularly powerful for subtracting both point-sources and trailed or even streaked sources from extended astronomical objects. We demonstrate starkiller's effectiveness in improving observations of extended sources in dense stellar fields for VLT/MUSE observations of comets, asteroids and nebulae. We also show that starkiller can treat satellite-impacted VLT/MUSE observations. The package could be applied to tasks as varied as dust extinction in clusters and stellar variability; the stellar modeling using Gaia fluxes is provided as a standalone function. The techniques can be expanded to imagers and to other IFUs.
Figures


Figures from the paper (14 more)




Reference graph
Works this paper leans on
-
[1]
Astropy Collaboration, Robitaille, T. P., Tollerud, E. J., et al. 2013, A&A, 558, A33, doi: 10.1051/0004-6361/201322068 Astropy Collaboration, Price-Whelan, A. M., Sip˝ ocz, B. M., et al. 2018, AJ, 156, 123, doi: 10.3847/1538-3881/aabc4f Astropy Collaboration, Price-Whelan, A. M., Lim, P. L., et al. 2022, ApJ, 935, 167, doi: 10.3847/1538-4357/ac7c74
-
[2]
2023, ApJ, 951, 78, doi: 10.3847/1538-4357/acd333
Axelrod, T., Saha, A., Matheson, T., et al. 2023, ApJ, 951, 78, doi: 10.3847/1538-4357/acd333
-
[3]
2023, A&A, 674, A32, doi: 10.1051/0004-6361/202243790
Babusiaux, C., Fabricius, C., Khanna, S., et al. 2023, A&A, 674, A32, doi: 10.1051/0004-6361/202243790
-
[4]
Shepherd, M. 2016, MPDAF: MUSE Python Data Analysis Framework, Astrophysics Source Code Library, record ascl:1611.003. http://ascl.net/1611.003
work page 2016
-
[5]
2010, Society of Photo-Optical Instrumentation Engineers (SPIE) Conference Series, Vol
Bacon, R., Accardo, M., Adjali, L., et al. 2010, Society of Photo-Optical Instrumentation Engineers (SPIE) Conference Series, Vol. 7735, The MUSE second-generation VLT instrument, 773508, doi: 10.1117/12.856027
-
[6]
Ballard, D. H. 1981, Pattern Recognition, 13, 111, doi: 10.1016/0031-3203(81)90009-1
-
[7]
T., Opitom, C., Fitzsimmons, A., et al
Bannister, M. T., Opitom, C., Fitzsimmons, A., et al. 2020, arXiv e-prints, arXiv:2001.11605, doi: 10.48550/arXiv.2001.11605
-
[8]
2016, Extinction V0.3.0, Zenodo, doi: 10.5281/zenodo.804967
Barbary, K. 2016, Extinction V0.3.0, Zenodo, doi: 10.5281/zenodo.804967
Show all 44 references
-
[9]
2024, PSJ, 5, 240, doi: 10.3847/PSJ/ad76ab
Battle, A., Reddy, V., Furfaro, R., & Campbell, T. 2024, PSJ, 5, 240, doi: 10.3847/PSJ/ad76ab
2024 doi
-
[10]
M., & Venn, K
Bialek, S., Lucatello, S., Fabbro, S., Yi, K. M., & Venn, K. A. 2023, MNRAS, 524, 529, doi: 10.1093/mnras/stad1889 B¨ oker, T., Arribas, S., L¨ utzgendorf, N., et al. 2022, A&A, 661, A82, doi: 10.1051/0004-6361/202142589
2023 doi
-
[11]
2023, astropy/photutils: 1.8.0, 1.8.0, Zenodo, doi: 10.5281/zenodo.7946442
Bradley, L. 2023, astropy/photutils: 1.8.0, 1.8.0, Zenodo, doi: 10.5281/zenodo.7946442
2023 doi
-
[12]
2000, Dr
Bradski, G. 2000, Dr. Dobb’s Journal of Software Tools
2000
-
[13]
2014, pyExtinction: Atmospheric extinction, Astrophysics Source Code Library, record ascl:1403.002
Buton, C., & Copin, Y. 2014, pyExtinction: Atmospheric extinction, Astrophysics Source Code Library, record ascl:1403.002
2014
-
[14]
1986, IEEE Transactions on Pattern Analysis and Machine Intelligence, PAMI-8, 679, doi: 10.1109/TPAMI.1986.4767851
Canny, J. 1986, IEEE Transactions on Pattern Analysis and Machine Intelligence, PAMI-8, 679, doi: 10.1109/TPAMI.1986.4767851
1986
-
[15]
Castelli, F., & Kurucz, R. L. 2003, in Modelling of Stellar Atmospheres, ed. N. Piskunov, W. W. Weiss, & D. F
2003
- [16]
-
[17]
T., & Opitom, C
Deam, S., Bannister, M. T., & Opitom, C. 2024, in preparation
2024
-
[18]
2010, Ap&SS, 327, 245, doi: 10.1007/s10509-010-0335-9 Starkiller: subtracting stars from IFU data 21
Dopita, M., Rhee, J., Farage, C., et al. 2010, Ap&SS, 327, 245, doi: 10.1007/s10509-010-0335-9 Starkiller: subtracting stars from IFU data 21
2010 doi
-
[19]
O., & Hart, P
Duda, R. O., & Hart, P. E. 1972, Communications of the ACM, 15, 11
1972
-
[20]
2023, Science, 382, 150, doi: 10.1126/science.adi4639
Falle, A., Wright, E., Boley, A., & Byers, M. 2023, Science, 382, 150, doi: 10.1126/science.adi4639
2023 doi
-
[21]
Fitzpatrick, E. L. 1999, PASP, 111, 63, doi: 10.1086/316293
1999 doi
-
[22]
E., et al
Fraser, W., Alexandersen, M., Schwamb, M. E., et al. 2016, AJ, 151, 158, doi: 10.3847/0004-6256/151/6/158 Gaia Collaboration, Prusti, T., de Bruijne, J. H. J., et al. 2016, A&A, 595, A1, doi: 10.1051/0004-6361/201629272 Gaia Collaboration, Vallenari, A., Brown, A. G. A., et al...
2016 doi
-
[23]
M., Brasseur, C
Ginsburg, A., Sip˝ ocz, B. M., Brasseur, C. E., et al. 2019, AJ, 157, 98, doi: 10.3847/1538-3881/aafc33
2019 doi
-
[24]
2008, A&A, 486, 951, doi: 10.1051/0004-6361:200809724
Gustafsson, B., Edvardsson, B., Eriksson, K., et al. 2008, A&A, 486, 951, doi: 10.1051/0004-6361:200809724
2008 doi
-
[25]
R., & Moehler, S
Hainaut, O. R., & Moehler, S. 2024, A&A, 683, A147, doi: 10.1051/0004-6361/202348249
2024 doi
-
[26]
2019, A&A, 621, A85, doi: 10.1051/0004-6361/201833787
Hainich, R., Ramachandran, V., Shenar, T., et al. 2019, A&A, 621, A85, doi: 10.1051/0004-6361/201833787
2019 doi
-
[27]
R., Millman, K
Harris, C. R., Millman, K. J., van der Walt, S. J., et al. 2020, Nature, 585, 357, doi: 10.1038/s41586-020-2649-2
2020 doi
-
[28]
Hough, P. V. 1962, Method and means for recognizing complex patterns, Google Patents
1962
-
[29]
Hunter, J. D. 2007, Computing in Science and Engineering, 9, 90, doi: 10.1109/MCSE.2007.55
2007 doi
-
[30]
D., Rieke, M
Ivanov, V. D., Rieke, M. J., Engelbracht, C. W., et al. 2004, ApJS, 151, 387, doi: 10.1086/381752
2004 doi
-
[31]
Kamann, S., Wisotzki, L., & Roth, M. M. 2013, A&A, 549, A71, doi: 10.1051/0004-6361/201220476
2013 doi
-
[32]
2023, ApJL, 959, L12, doi: 10.3847/2041-8213/ad0fdd Micha lowski, M
Kareta, T., Thomas, C., Li, J.-Y., et al. 2023, ApJL, 959, L12, doi: 10.3847/2041-8213/ad0fdd Micha lowski, M. J., Kami´ nski, K., Kami´ nska, M. K., &
2023 doi
-
[33]
2021, Nature Astronomy, 5, 995, doi: 10.1038/s41550-021-01472-3
Wnuk, E. 2021, Nature Astronomy, 5, 995, doi: 10.1038/s41550-021-01472-3
2021 doi
-
[34]
2024, PSJ, 5, 35, doi: 10.3847/PSJ/ad0e74
Moskovitz, N., Thomas, C., Pravec, P., et al. 2024, PSJ, 5, 35, doi: 10.3847/PSJ/ad0e74
2024 doi
-
[35]
P., Opitom, C., Snodgrass, C., et al
Murphy, B. P., Opitom, C., Snodgrass, C., et al. 2023, PSJ, 4, 238, doi: 10.3847/PSJ/ad0a87
2023 doi
-
[36]
2019, ApJS, 241, 20, doi: 10.3847/1538-4365/ab0557
Narayan, G., Matheson, T., Saha, A., et al. 2019, ApJS, 241, 20, doi: 10.3847/1538-4365/ab0557
2019 doi
-
[37]
2023, A&A, 671, L11, doi: 10.1051/0004-6361/202345960
Opitom, C., Murphy, B., Snodgrass, C., et al. 2023, A&A, 671, L11, doi: 10.1051/0004-6361/202345960
2023 doi
-
[38]
Pickles, A. J. 1998, PASP, 110, 863, doi: 10.1086/316197
1998 doi
-
[39]
2024, Starkiller: subtracting stars and other sources from IFU spectroscopic data through forward modeling, 1.0, Zenodo, doi: 10.5281/zenodo.14189823
Nordlander, T. 2024, Starkiller: subtracting stars and other sources from IFU spectroscopic data through forward modeling, 1.0, Zenodo, doi: 10.5281/zenodo.14189823
2024 doi
-
[40]
F., & Finkbeiner, D
Schlafly, E. F., & Finkbeiner, D. P. 2011, ApJ, 737, 103, doi: 10.1088/0004-637X/737/2/103
2011 doi
-
[41]
A., Wong, M
Simon, A. A., Wong, M. H., Sromovsky, L. A., Fletcher, L. N., & Fry, P. M. 2022, Remote Sensing, 14, 1518, doi: 10.3390/rs14061518 STScI Development Team. 2013, pysynphot: Synthetic photometry software package, Astrophysics Source Code Library, record ascl:1303.023. http://asc...
2022 doi
-
[42]
E., et al
Virtanen, P., Gommers, R., Oliphant, T. E., et al. 2020, Nature Methods, 17, 261, doi: 10.1038/s41592-019-0686-2
2020 doi
-
[43]
2020, Dark & Quiet Skies I (2020), Dark & Quiet Skies I (2020), Report of the conference held 5-9 October, 2020., doi: 10.5281/zenodo.5898785 —
Walker, C., Di Pippo, S., Aub´ e, M., et al. 2020, Dark & Quiet Skies I (2020), Dark & Quiet Skies I (2020), Report of the conference held 5-9 October, 2020., doi: 10.5281/zenodo.5898785 —. 2021, Dark & Quiet Skies II (2021), Dark & Quiet Skies II (2021), Report of the confere...
2020 doi
-
[44]
M., Palsa, R., Streicher, O., et al
Weilbacher, P. M., Palsa, R., Streicher, O., et al. 2020, A&A, 641, A28, doi: 10.1051/0004-6361/202037855 Wes McKinney. 2010, in Proceedings of the 9th Python in Science Conference, ed. St´ efan van der Walt & Jarrod Millman, 56 – 61, doi: 10.25080/Majora-92bf1922-00a
2020 doi
Reviewed August 12, 2026 · model on record in the stance chip above.
Discussion (0). Continue with ORCID to comment.