REVIEW 4 major objections 6 minor 30 references
AI-Driven Real-Time Monitoring of Ground-Nesting Birds: A Case Study on Curlew Detection Using YOLOv10
T0 review · 4 major / 6 minor · reviewed 2026-08-12 · deepseek-v4-flash
Pith's one-line read A real-time camera-trap system using YOLOv10 detects adult curlews and chicks with 90–96% F1 scores in a Welsh field trial.
desk verdict A genuinely deployed YOLOv10 curlew detector with plausible training metrics, but the field-performance claims rely on an undocumented labeling protocol and threshold; a conditional accept after revision. read the letter →
The pith
A machine-rendered reading of the paper's core claim, the machinery that carries it, and where it could break.
The reading
What carries the argument
The load-bearing mechanism is YOLOv10x, a single-stage, anchor-free object detector that predicts bounding boxes and class probabilities in one pass using a CSPDarknet backbone and a Path Aggregation Network for multi-scale feature fusion. The model was pre-trained on MS COCO and fine-tuned via transfer learning on 38,740 tagged images spanning 26 UK species and objects, then exported to ONNX and served behind a GPU inference server so that camera-trap images uploaded over 3/4G are classified in real time. This combination of single-stage detection, transfer learning, and platform integration is what lets the system deliver species-level classifications without manual triage.
What would settle it
Have independent experts re-annotate all 1,072 trial images without seeing the model's outputs, then recompute the confusion matrices for adult curlews and chicks; if the expert labels add missed individuals or false-positive background objects, the reported sensitivities (90.56%, 92.35%) and 100% specificity will not reproduce.
Extended reading notes
Core claim
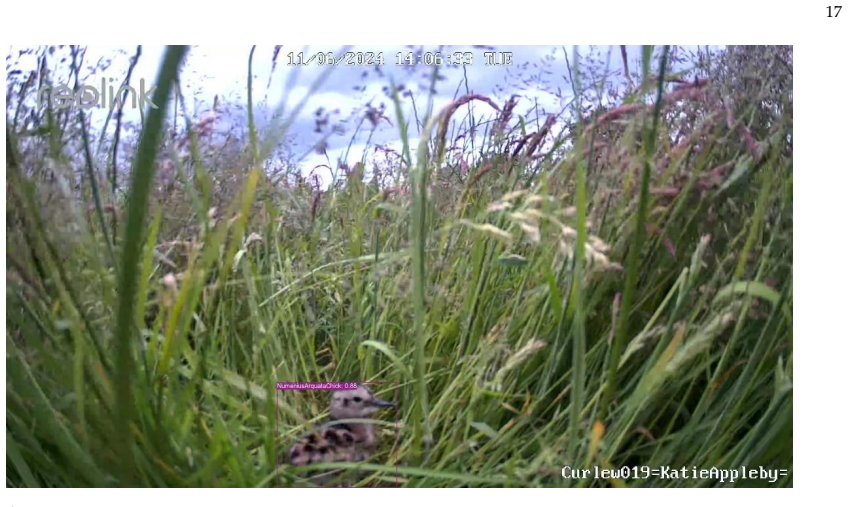
The central claim is that a single-stage YOLOv10x detector, fine-tuned on a 26-class UK species dataset, can be embedded in a real-time camera-trap pipeline and reliably detect and classify Eurasian curlews (Numenius arquata) and their chicks under field conditions. The model processes images transmitted by 3/4G cellular cameras through the Conservation AI platform; during the trial, 1,072 images from 11 Welsh nesting sites were classified automatically. The paper reports per-class inference metrics of 93.41% accuracy, 100% precision, 90.56% sensitivity, 100% specificity, and a 95.05% F1 score for adult curlews, and 97.51% accuracy, 100% precision, 92.35% sensitivity, 100% specificity, and a 96.03% F1 score for chicks, with domestic sheep also detected at 100% across all metrics. It also reports that the system filtered irrelevant images with 98.28% accuracy, reducing the manual review burden.
Load-bearing premise
The field-performance numbers assume that the 1,072 deployment images were labelled with accurate ground truth independently of what the model predicted, but the paper does not describe who created those labels, how they were verified, or how true negatives and missed detections were counted.
Editorial extensions
If this is right
- If the reported performance holds, curlew conservation teams can receive near-real-time alerts when an adult or chick appears at a nest, enabling faster anti-predator or habitat interventions.
- Automated filtering of blank and irrelevant images (98.28% accurate in the trial) cuts the manual-review workload that currently delays camera-trap analysis.
- The same 26-class model and pipeline can be extended to monitor other ground-nesting birds and mammals without retraining the full system from scratch.
- The authors state that the deployment provides a platform for a longitudinal curlew nesting-season survey in 2025, which would test whether the detection metrics translate into measurable conservation outcomes.
Reading between the lines
- Because the trial ran for roughly six weeks at 11 sites in one region, the reported 100% specificity and high sensitivities are estimates for that deployment window; broader seasons and habitats could introduce new false positives or missed chicks that the current numbers do not capture.
- The confusion between adult curlews and common pheasants suggests that visually similar ground-nesting birds may need class-specific training data or a hierarchical classifier before the system can be trusted for multi-species monitoring.
- The same real-time alert architecture could be pointed at predators such as foxes, badgers, or corvids, turning a detection system into an early-warning system for predation risk rather than only a presence/absence logger.
- If paired with standardized camera-placement guidelines, citizen-deployed cameras could scale this approach across the curlew's range; the paper itself notes that camera placement strongly affected chick detections.
Editorial analysis
A structured set of objections, weighed in public.
Referee Report
Summary. The paper reports a real-time camera-trap monitoring pipeline for Eurasian curlews (Numenius arquata) and their chicks, built around a custom fine-tuned YOLOv10x detector integrated with the Conservation AI platform. The model was trained on 38,740 images spanning 26 UK species/objects and reports a held-out test mAP of 0.976. The deployment study at 11 nesting sites in Wales over May–June 2024 analyzed 1,072 images, reporting for adult curlews a sensitivity of 90.56%, specificity of 100%, and F1-score of 95.05%, and for chicks a sensitivity of 92.35%, specificity of 100%, and F1-score of 96.03%. The paper claims the system provides timely, scalable conservation monitoring, with the main contribution being the integration of a high-accuracy detector into a real-time pipeline and its field evaluation.
Significance. If the field-performance claims are correct, the work is practically valuable: it would demonstrate that a deployed YOLOv10-based pipeline can detect adult curlews and chicks in real-world camera-trap imagery with high sensitivity and no false positives over a six-week trial, which is directly relevant to curlew conservation and similar ground-nesting bird monitoring. The training component is standard but solid, with a respectable mAP and clear reporting of hyperparameters and augmentation settings. The main significance hinges on the auditability of the deployment evaluation; as presented, the central field metrics rest on an undocumented ground-truth process for the 1,072 inference images, and on unstated decisions about confidence thresholds and metric aggregation. The paper does not release data or code, which further limits independent verification, though the protocol itself could be clarified in a revision.
major comments (4)
- [Section 3.2 and Table 1] The ground-truth labeling of the 1,072 deployment images is not described. The paper specifies how training data were tagged (Section 2.2) but is silent on who labeled the field images, whether labels were independently verified, how false negatives were found (e.g., whether every image was reviewed by a human), and how true negatives were defined at image level versus object level. The acknowledgment that Rachel Chalmers tagged 'all the data' does not clarify her role in the deployment evaluation. Without this protocol, the reported sensitivity and specificity for curlews and chicks in Table 1 cannot be audited, so this is a load-bearing omission for the paper's central claim.
- [Section 2.7/Figure 12 and Section 3.2.1/Table 1] The inference confidence threshold used to produce Table 1 is never reported. The F1-confidence curve in Figure 12 shows a peak at a confidence threshold of 0.387, but the text never states that this threshold (or any other) was applied during the deployment. Since precision, recall, and specificity are threshold-dependent, the reader cannot reproduce the reported metrics or assess whether the chosen threshold was selected post hoc. Please state the exact threshold used and, if possible, report metrics across a range of thresholds for the deployment data.
- [Section 3.2.1, Table 1, and Table 2] The reported overall accuracy (91.23%) and average F1-score (58.88%) are inconsistent with the three-class Table 1. The text says 'individual class accuracies ranging from 93.41% to 100% and an overall accuracy of 91.23% (Table 1)', but the average of the three displayed accuracies is approximately 96.97%, not 91.23%. The paper also states that Common pheasant had zero true instances yet contributed false positives, and that some classes were 'discontinued from the analysis'. Table 2, which should provide the full confusion matrix, appears empty or incomplete in the manuscript. Please clarify which classes were included in the averaged metrics, how accuracy was aggregated (micro vs. macro average, image-level vs. object-level), and provide the complete confusion matrix with counts for all classes.
- [Discussion (Section 4) and Section 3.2] The paper acknowledges in the Discussion that 'Not all camera trap installations in the study adhered to these guidelines, consequently some misdetections were observed' regarding camera placement, yet the quantitative impact of these misdetections is not reflected in the reported metrics. This is not necessarily an error, but it raises a question about whether Table 1's sensitivity values include all deployment images or only a subset from well-placed cameras. Please specify whether any images or sites were excluded from the evaluation, and if so, how the exclusion decision was made.
minor comments (6)
- [Section 2.6] The paragraph beginning 'The end-to-end inferencing pipeline as shown in Figure 6...' is repeated verbatim within the same subsection; one copy should be deleted.
- [Section 2] Section numbering is inconsistent: what appears to be Section 2.1 is labeled '3.1. Data Collection and Description', and Section 2.7 is labeled '3.8. Evaluation Metrics Inference'. Please renumber all sections consistently.
- [Section 2.2 and Section 2.4] The text says 'The dataset used in this study comprised a total of 38,740 image files' but later says 'In total, 38,740 objects were tagged across the dataset.' These are different quantities; please clarify whether 38,740 refers to images, annotated objects, or both.
- [Abstract and Section 4] The claim that the system 'filter[s] out blank images triggered by moving vegetation' with an accuracy of 98.28% appears only in the Discussion and is not supported by any results section or table; please either provide the supporting data or remove the specific number.
- [Throughout] There are multiple typographical errors, including 'du e' in the abstract and 'Northan goshawk' in the species list. Please perform a careful proofreading pass.
- [Table 2] Table 2's caption says 'The diagonal number indicates the TP for each of the classes', but the actual matrix contents are not visible in the manuscript. Please include the full matrix with row and column labels.
Circularity Check
No significant circularity: the reported metrics are measured outcomes of a supervised detector, not derived from the model's own outputs by construction.
full rationale
The paper's claimed derivation is a standard supervised training and evaluation chain. The YOLOv10x model is trained on 38,740 hand-tagged images split into 80/10/10 sets, test-split performance (mAP 0.976 at IoU 0.5) is measured on held-out images, and the deployment metrics in Table 1 are computed from TP/FP/TN/FN counts on 1,072 trial images using the standard definitions in Eqs. 7-10. No fitted parameter is renamed as a prediction: the reported F1 values are recomputed from the reported precision and sensitivity values, and specificity reaches 100% because no false positives were recorded for those classes. The self-citations in Refs. 14 and 26 describe the authors' prior bird-classification work and the Conservation AI platform, but they do not carry the load of the central performance claim; no uniqueness theorem or ansatz is imported from those works. The paper's genuine weakness is auditability, not circularity: the labeling and verification protocol for the 1,072 inference images and the confidence threshold used at deployment are not reported, and the reported overall accuracy (91.23%) and average F1 (58.88%) imply unlisted classes beyond Table 1. These are correctness and reproducibility concerns, not evidence that the results reduce by construction to their inputs. I therefore find no significant circularity.
Assumptions & free parameters
free parameters (7)
- YOLOv10x learned weights =
not released
- Inference confidence threshold =
not reported; F1-Confidence curve peaks at 0.387 on validation
- Learning rate =
0.01
- Batch size =
256
- Image size =
640 pixels
- Momentum =
0.937
- Augmentation coefficients =
hsv_h=0.015, hsv_s=0.7, hsv_v=0.4, fliplr=0.5, translate=0.1, scale=0.5, erasing=0.4
assumptions (4)
- domain assumption The 38,740 training images were annotated with correct bounding boxes and class labels.
- domain assumption The 1,072 inference images received accurate ground-truth labels independent of the model's predictions.
- domain assumption Pre-training on MS COCO provides a useful feature initialization for camera-trap wildlife detection after fine-tuning.
- domain assumption The random 80/10/10 split at image level prevents data leakage and the test set represents the deployment distribution.
Cite this review
Pith. "Pith review of AI-Driven Real-Time Monitoring of Ground-Nesting Birds: A Case Study on Curlew Detection Using YOLOv10." pith.science (2026). https://pith.science/paper/BR3AJXPD
@misc{pith2026241115263,
  author       = {Pith},
  title        = {Pith review of: AI-Driven Real-Time Monitoring of Ground-Nesting Birds: A Case Study on Curlew Detection Using YOLOv10},
  year         = {2026},
  howpublished = {\url{https://pith.science/paper/BR3AJXPD}},
  note         = {Machine review of arXiv:2411.15263}
}
read the original abstract
Effective monitoring of wildlife is critical for assessing biodiversity and ecosystem health, as declines in key species often signal significant environmental changes. Birds, particularly ground-nesting species, serve as important ecological indicators due to their sensitivity to environmental pressures. Camera traps have become indispensable tools for monitoring nesting bird populations, enabling data collection across diverse habitats. However, the manual processing and analysis of such data are resource-intensive, often delaying the delivery of actionable conservation insights. This study presents an AI-driven approach for real-time species detection, focusing on the curlew (Numenius arquata), a ground-nesting bird experiencing significant population declines. A custom-trained YOLOv10 model was developed to detect and classify curlews and their chicks using 3/4G-enabled cameras linked to the Conservation AI platform. The system processes camera trap data in real-time, significantly enhancing monitoring efficiency. Across 11 nesting sites in Wales, the model achieved high performance, with a sensitivity of 90.56%, specificity of 100%, and F1-score of 95.05% for curlew detections, and a sensitivity of 92.35%, specificity of 100%, and F1-score of 96.03% for curlew chick detections. These results demonstrate the capability of AI-driven monitoring systems to deliver accurate, timely data for biodiversity assessments, facilitating early conservation interventions and advancing the use of technology in ecological research.
Figures


Figures from the paper (13 more)



Reference graph
Works this paper leans on
- [1]
-
[2]
Reducing nest predation of ground -nesting birds through conditioned food aversion,
J. Tobajas, E. Descalzo, R. Mateo, and P. Ferreras, “Reducing nest predation of ground -nesting birds through conditioned food aversion,” Biol Conserv , vol. 242, p. 108405, Feb. 2020, doi: 10.1016/j.biocon.2020.108405
-
[3]
M. Roodbergen, B. van der Werf, and H. Hoetker, “Revealing the contributions of reproduction and survival to the Europe-wide decline in meadow birds: Review and meta-analysis,” J Ornithol, vol. 153, no. 1, pp. 53–74, Jan. 2012, doi: 10.1007/s10336-011-0733-y. 19
-
[4]
C. Bravo, O. Pays, M. Sarasa, and V. Bretagnolle, “Revisiting an old question: Which predators eat eggs of ground-nesting birds in farmland landscapes?,” Science of The Total Environment, vol. 744, p. 140895, Nov. 2020, doi: 10.1016/j.scitotenv.2020.140895
-
[5]
Ecosystem Services Provided by Birds,
C. J. Whelan, D. G. Wenny, and R. J. Marquis, “Ecosystem Services Provided by Birds,” Ann N Y Acad Sci, vol. 1134, no. 1, pp. 25–60, Jun. 2008, doi: 10.1196/annals.1439.003
-
[6]
Bird - mediated effects of pest control services on crop productivity: a global synthesis,
P. Díaz -Siefer, N. Olmos -Moya, F. E. Fontúrbel, B. Lavandero, R. A. Pozo, and J. L. Celis -Diez, “Bird - mediated effects of pest control services on crop productivity: a global synthesis,” J Pest Sci (2004), vol. 95, no. 2, pp. 567–576, Mar. 2022, doi: 10.1007/s10340-021-01438-4
-
[7]
P. Bocher et al., “Home ranges and hatching success of threatened Eurasian curlew in north-eastern Europe relates to habitat type: Natural vs. agricultural landscapes,” Glob Ecol Conserv, vol. 50, p. e02851, 2024, doi: https://doi.org/10.1016/j.gecco.2024.e02851
-
[8]
D. S. Viana, S. Santoro, R. C. Soriguer, and J. Figuerola, “A synthesis of Eurasian Curlew ( Numenius arquata arquata ) demography and population viability to inform its management,” Ibis, vol. 165, no. 3, pp. 767–780, Jul. 2023, doi: 10.1111/ibi.13184
Show all 30 references
-
[9]
Nest survival of threatened Eurasian Curlew ( Numenius arquata ) breeding at low densities across a human‐modified landscape,
H. Ewing, S. Franks, J. Smart, N. Burton, and J. A. Gill, “Nest survival of threatened Eurasian Curlew ( Numenius arquata ) breeding at low densities across a human‐modified landscape,” Ibis, vol. 165, no. 3, pp. 753–766, Jul. 2023, doi: 10.1111/ibi.13180
2023 doi
-
[10]
Protecting wild bird nests against predators: A systematic review and meta‐analysis of non‐lethal methods,
D. Gautschi, A. Čulina, R. Heinsohn, D. Stojanovic, and R. Crates, “Protecting wild bird nests against predators: A systematic review and meta‐analysis of non‐lethal methods,” Journal of Applied Ecology , vol. 61, no. 6, pp. 1187–1198, Jun. 2024, doi: 10.1111/1365-2664.14619
2024
-
[11]
Camera Traps in Animal Ecology,
T. O’Brien, “Camera Traps in Animal Ecology,” 2011, pp. 71–96. doi: 10.1007/978-4-431-99495-4_6
2011 doi
-
[12]
Snap happy: camera traps are an effective sampling tool when compared with alternative methods,
O. R. Wearn and P. Glover -Kapfer, “Snap happy: camera traps are an effective sampling tool when compared with alternative methods,” R Soc Open Sci, vol. 6, no. 3, p. 181748, 2019, doi: 10.1098/rsos.181748
2019 doi
-
[13]
Software to facilitate and streamline camera trap data management: A review,
S. Young, J. Rode‐Margono, and R. Amin, “Software to facilitate and streamline camera trap data management: A review,” Ecol Evol, vol. 8, no. 19, pp. 9947–9957, Oct. 2018, doi: 10.1002/ece3.4464
2018 doi
-
[14]
Removing Human Bottlenecks in Bird Classification Using Camera Trap Images and Deep Learning,
C. Chalmers et al., “Removing Human Bottlenecks in Bird Classification Using Camera Trap Images and Deep Learning,” Remote Sens (Basel), vol. 15, no. 10, p. 2638, May 2023, doi: 10.3390/rs15102638
2023 doi
-
[15]
An evaluation of platforms for processing camera -trap data using artificial intelligence,
J. Vélez et al., “An evaluation of platforms for processing camera -trap data using artificial intelligence,” Methods Ecol Evol, vol. 14, no. 2, pp. 459–477, 2023, doi: https://doi.org/10.1111/2041-210X.14044
2023 doi
-
[16]
Automatically identifying, counting, and describing wild animals in camera - trap images with deep learning,
M. S. Norouzzadeh et al., “Automatically identifying, counting, and describing wild animals in camera - trap images with deep learning,” Proceedings of the National Academy of Sciences, vol. 115, no. 25, pp. E5716– E5725, 2018
2018
-
[17]
Scaling‐up camera traps: monitoring the planet’s biodiversity with networks of remote sensors,
R. Steenweg et al., “Scaling‐up camera traps: monitoring the planet’s biodiversity with networks of remote sensors,” Front Ecol Environ, vol. 15, no. 1, pp. 26–34, Feb. 2017, doi: 10.1002/fee.1448
2017 doi
-
[18]
Efficient pipeline for camera trap image review,
S. Beery, D. Morris, and S. Yang, “Efficient pipeline for camera trap image review,” arXiv preprint arXiv:1907.06772, 2019
1907 arXiv
-
[19]
Pytorch -Wildlife: A Collaborative Deep Learning Framework for Conservation,
A. Hernandez, Z. Miao, L. Vargas, R. Dodhia, and J. Lavista, “Pytorch -Wildlife: A Collaborative Deep Learning Framework for Conservation,” arXiv preprint arXiv:2405.12930, 2024
2024 arXiv
-
[20]
Wildlife Insights: A Platform to Maximize the Potential of Camera Trap and Other Passive Sensor Wildlife Data for the Planet,
J. A. Ahumada et al., “Wildlife Insights: A Platform to Maximize the Potential of Camera Trap and Other Passive Sensor Wildlife Data for the Planet,” Environ Conserv , vol. 47, no. 1, pp. 1 –6, Mar. 2020, doi: 10.1017/S0376892919000298
2020 doi
-
[21]
The inaturalist species classification and detection dataset,
G. Van Horn et al., “The inaturalist species classification and detection dataset,” in Proceedings of the IEEE conference on computer vision and pattern recognition, 2018, pp. 8769–8778
2018
-
[22]
Snapshot Serengeti, high - frequency annotated camera trap images of 40 mammalian species in an African savanna,
A. Swanson, M. Kosmala, C. Lintott, R. Simpson, A. Smith, and C. Packer, “Snapshot Serengeti, high - frequency annotated camera trap images of 40 mammalian species in an African savanna,” Sci Data, vol. 2, no. 1, p. 150026, Jun. 2015, doi: 10.1038/sdata.2015.26
2015 doi
-
[23]
Model generalization in deep learning applications for land cover mapping,
L. Hu, C. Robinson, and B. Dilkina, “Model generalization in deep learning applications for land cover mapping,” arXiv preprint arXiv:2008.10351, 2020
2008 arXiv
-
[24]
Bringing back the context: Camera trap species identification as link prediction on multimodal knowledge graphs,
V. Pahuja et al. , “Bringing back the context: Camera trap species identification as link prediction on multimodal knowledge graphs,” arXiv preprint arXiv:2401.00608, 2023
2023 arXiv
-
[25]
Camera trapping —Advancing the technology,
W.-M. Wong and S. Kachel, “Camera trapping —Advancing the technology,” in Snow Leopards, Elsevier, 2024, pp. 415–428. doi: 10.1016/B978-0-323-85775-8.00018-2
2024 doi
-
[26]
Harnessing Artificial Intelligence for Wildlife Conservation,
P. Fergus, C. Chalmers, S. Longmore, and S. Wich, “Harnessing Artificial Intelligence for Wildlife Conservation,” arXiv preprint arXiv:2409.10523, 2024. 20
2024 arXiv
-
[27]
Yolov10: Real-time end-to-end object detection,
A. Wang et al., “Yolov10: Real-time end-to-end object detection,” arXiv preprint arXiv:2405.14458, 2024
2024 arXiv
-
[28]
Large scale fine-grained categorization and domain- specific transfer learning,
Y. Cui, Y. Song, C. Sun, A. Howard, and S. Belongie, “Large scale fine-grained categorization and domain- specific transfer learning,” in Proceedings of the IEEE conference on computer vision and pattern recognition , 2018, pp. 4109–4118
2018
-
[29]
Targeted transfer learning to improve performance in small medical physics datasets,
M. Romero, Y. Interian, T. Solberg, and G. Valdes, “Targeted transfer learning to improve performance in small medical physics datasets,” Med Phys, vol. 47, no. 12, pp. 6246–6256, 2020
2020
-
[30]
Optimizing High-Throughput Inference on Graph Neural Networks at Shared Computing Facilities with the NVIDIA Triton Inference Server,
C. Savard et al., “Optimizing High-Throughput Inference on Graph Neural Networks at Shared Computing Facilities with the NVIDIA Triton Inference Server,” Comput Softw Big Sci, vol. 8, no. 1, p. 14, Dec. 2024, doi: 10.1007/s41781-024-00123-2
2024 doi
Reviewed August 12, 2026 · model on record in the stance chip above.
Discussion (0). Continue with ORCID to comment.