REVIEW 4 major objections 4 minor 72 references
Feature-interactive Siamese graph encoder-based image analysis to predict STAS from histopathology images in lung cancer
T0 review · 4 major / 4 minor · reviewed 2026-08-12 · deepseek-v4-flash
Pith's one-line read A feature-interactive Siamese graph encoder, VERN, predicts spread through air spaces (STAS) in lung cancer whole-slide images, reporting an internal AUC of 0.9215 and frozen- and paraffin-section test AUCs of 0.8275 and 0.8829.
desk verdict A solid first WSI-level STAS prediction model with genuine external validation, but the internal split needs to be patient-level before the headline AUC is taken at face value. read the letter →
The pith
A machine-rendered reading of the paper's core claim, the machinery that carries it, and where it could break.
The reading
What carries the argument
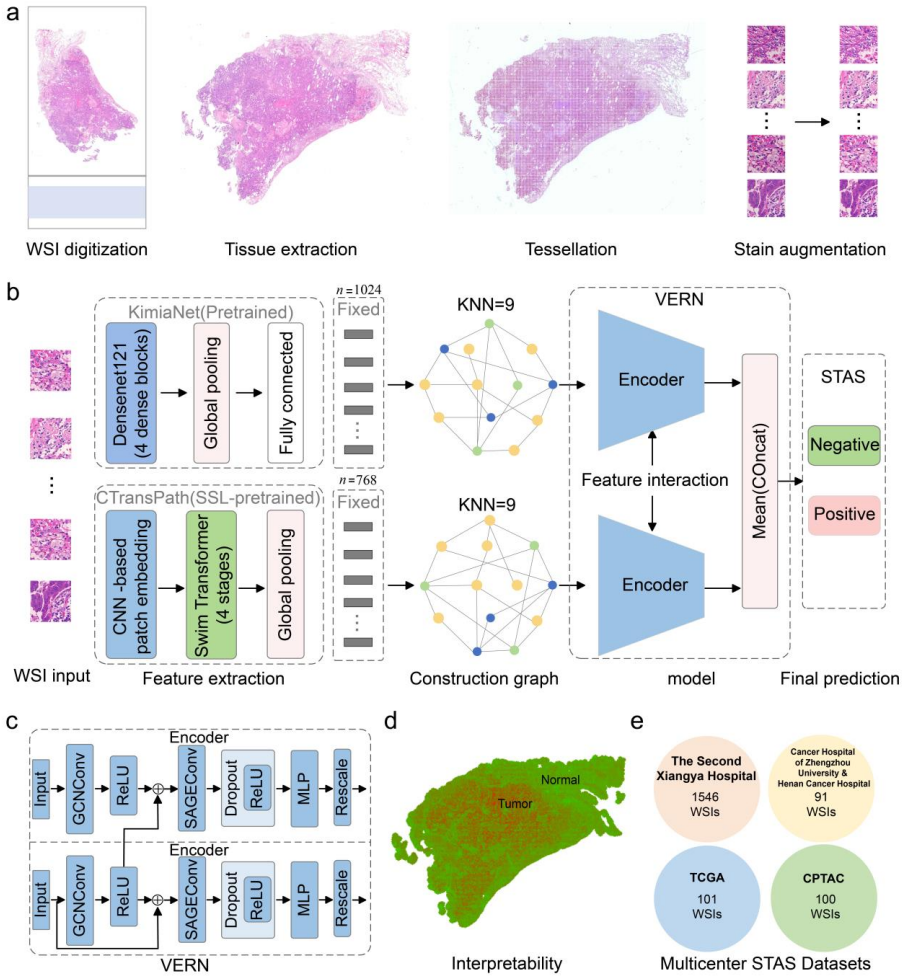
The load-bearing object is VERN itself, a feature-interactive Siamese graph encoder. Each whole-slide image is converted into a spatial topological graph: patches become nodes, patch features come from two pretrained extractors (1024- and 768-dimensional), and a K-nearest-neighbor rule (K=9) draws edges between nearby patches, so the graph encodes where tissue structures sit relative to one another. VERN then runs two symmetric encoder branches, each a sequence of GCNConv, SAGEConv, ReLU, Dropout, MLP and Rescale layers; the branches share weights and exchange information through cross-graph message passing, and a skip connection carries the original input forward. The two branch outputs are concatenated and averaged for the slide-level STAS prediction, and per-patch attention contributions are normalized and mapped back onto the slide as heatmaps.
What would settle it
Re-run the five-fold cross-validation with all slides grouped by patient before splitting, so no patient appears in both training and test folds, and compare the resulting AUC with the reported 0.9215; a large drop would show the model was exploiting patient-specific slide artifacts rather than STAS biology.
Extended reading notes
Core claim
On the paper's own terms, the discovery is that STAS—a pattern in which tumor cells spread through alveolar air spaces beyond the main tumor—can be predicted from whole-slide histopathology images at the slide level, and that representing the slide as a spatial graph is what makes this work. The authors report an internal validation AUC of 0.9215, frozen-section and paraffin-section test AUCs of 0.8275 and 0.8829, and external cohort AUCs in the range of roughly 0.70 to 0.92. They also report that VERN outperforms five multiple instance learning baselines under the same five-fold cross-validation protocol. The paper frames this as the first whole-slide-image-level STAS prediction method and as a possible intraoperative aid, since frozen-section STAS is clinically important but hard for pathologists to detect.
Load-bearing premise
The load-bearing premise is that all slides from the same patient stayed in the same training or test split—if a patient's frozen and paraffin slides were allowed to straddle the split, the model could be recognizing patient-specific slide artifacts rather than STAS itself, which would inflate the reported AUCs.
Editorial extensions
If this is right
- If VERN's accuracy holds, intraoperative frozen-section review gains a rapid second reader that could cut missed STAS cases before the surgeon chooses resection extent.
- The per-patch attention maps give pathologists a concrete region to re-check, namely the tumor edge and peritumoral air spaces, rather than scanning the entire slide.
- The graph representation is the claimed reason for the gains, so future whole-slide classifiers for other spatially distributed patterns could adopt the same encoder.
- Because the model was trained on both frozen and paraffin sections, its frozen-section predictions benefit from paraffin-derived prior knowledge, a training strategy that could be reused elsewhere.
Reading between the lines
- The paper does not report an ablation that replaces the K-nearest-neighbor spatial graph with random edges; such an ablation would directly test whether spatial topology, rather than the extra parameters alone, drives the improvement over multiple instance learning baselines.
- Because each patient contributed multiple slides, a patient-level fusion rule (any slide positive implies STAS) and a patient-level AUC would make the clinical utility figures more interpretable; the paper mentions the rule but does not evaluate it.
- The same architecture could be transferred to other histopathology tasks where spread or adjacency matters, such as lymphovascular invasion or perineural invasion, provided a similar frozen-plus-paraffin training set is available.
- An external reader study comparing VERN against multiple pathologists on the same slides would place the reported AUCs in a clinical context; the paper compares with literature numbers rather than a head-to-head reader study.
Editorial analysis
A structured set of objections, weighed in public.
Referee Report
Summary. The paper proposes VERN, a feature-interactive Siamese graph encoder for predicting spread through air spaces (STAS) from lung cancer whole-slide images. The authors constructed a single-cohort dataset of 1,546 frozen and paraffin-embedded sections from 356 patients, trained VERN with five-fold cross-validation, and report an internal AUC of 0.9215 (best fold; average 0.8683), plus AUCs of 0.8275 and 0.8829 on frozen and paraffin test sections. They also validate on 356 single-cohort slides and on external slides from Zhengzhou/Henan Cancer Hospital, TCGA, and CPTAC, and provide an open web platform. The central claim is that VERN achieves clinical-grade STAS prediction and outperforms existing multiple-instance learning baselines owing to its spatial graph construction.
Significance. If the reported results hold, this would be one of the first WSI-level STAS predictors and a potentially useful clinical decision-support tool, especially given the low sensitivity of frozen-section STAS assessment by pathologists. The work has clear strengths: it compares against five MIL baselines, provides interpretability heatmaps, publishes code and an online platform, and includes three external datasets. However, the significance is conditional on the internal evaluation being unbiased; the manuscript currently does not establish patient-level independence in the cross-validation split, and the headline number is the best of five folds rather than a central estimate.
major comments (4)
- [Methods: Clinical single cohort and multicenter data collection; Results (first paragraph)] The internal cross-validation split is described only at the slide level: 'the internal validation set, which includes both FSs and PSs, into five subsets.' The manuscript never states that all slides from a single patient were kept in the same fold. Since 1,546 slides come from 356 patients, with each patient contributing one FS and several PSs, a slide-level split can place slides from the same patient in both training and validation. This would let the model exploit patient-specific staining, scanning, or tissue-preparation signatures rather than learning generalizable STAS morphology, directly inflating the reported average AUC of 0.8683 and the best-fold AUC of 0.9215, and also biasing the comparison against MIL baselines. Please specify whether patient-level grouping was used, or re-run the cross-validation with patient-stratified folds and report the resulting performance.
- [Results, Figure 2 and Table 1] The abstract and Results highlight an AUC of 0.9215, but this is the best of five cross-validation folds; the average in-domain AUC reported in Table 1 and Figure 2c is 0.8683. Selecting the best fold as the headline performance overstates the expected prospective accuracy. Please report all five fold-level AUCs with confidence intervals, and state explicitly whether any model selection was performed across folds. If the best fold was chosen post hoc, the reported performance is optimistic.
- [Results: Single-cohort and multicenter STAS validation sets; Methods: Clinical single cohort and multicenter data…] The 356-slide 'single-cohort validation' is not an independent patient-level validation set. The Methods state that these are additional PSs from the same single cohort and that they 'had not been internally trained, verified, and tested,' but the same 356 patients contributed FSs and PSs used in internal training. If any slide from a patient was in the training set, then the patient's STAS status and slide characteristics are known to the model during training, so the AUC of 0.9181 in Figure 4a reflects within-patient correlation and cannot be cited as evidence of generalizability. Please either restrict this validation to patients entirely excluded from training or reframe it as a within-cohort slide-type test, and rely on the truly external datasets for generalization claims.
- [Methods: Clinical single cohort and multicenter data collection] The external TCGA and CPTAC labels were assigned by two pathologists, but the manuscript reports no inter-observer agreement (e.g., Cohen's kappa), no description of the labeling protocol's blinding, and no verification against a reference standard. Given that STAS diagnosis is known to be subjective and that even intraoperative frozen-section assessment has moderate agreement, the reliability of these external labels is load-bearing for the external AUCs (0.7029 and 0.7555). Please report the labeling procedure in detail, including the criteria used, whether disagreements were adjudicated, and the inter-observer agreement.
minor comments (4)
- [Figure 2a caption] The caption reads 'with the diagonal line showing the in-domain test results'; in an ROC plot the diagonal line is chance-level performance, not the test results. Please clarify what the diagonal line represents.
- [Abstract and Results] The terms 'histopathological images,' 'slides,' and 'sections' are used interchangeably; please standardize terminology (e.g., 'whole-slide images' vs. 'patches') to avoid confusion about the evaluation unit.
- [Methods: Experimental setup and implementation details] The grid search is described only as tuning 'learning rate, regularization strength, and batch size,' but only the learning rate and optimizer settings are reported. Please list the ranges considered and the final hyperparameter values for reproducibility.
- [Results, Table 1] The table header contains 'PRC' in the caption text, but the table reports AUC and other metrics. Please ensure metric abbreviations are defined consistently (e.g., use AUROC and AUPRC).
Circularity Check
No circularity found: VERN's STAS predictions are evaluated on held-out internal and external data, and no claim reduces to its inputs by construction.
full rationale
The paper is an empirical deep-learning study rather than a theoretical derivation chain. VERN is a GCN/SAGE-style graph encoder applied to KNN spatial graphs built from KimiaNet and CTransPath patch embeddings, and STAS predictions are measured on a held-out internal test set (40 FSs and 100 PSs), a single-cohort validation set of 356 PSs, two external hospital slide sets (91 slides), and TCGA/CPTAC external sets (101 and 100 slides). None of the model equations (Eq. 1, Eq. 2) defines the STAS label in terms of the model's own output, and no parameter is fitted to the test or external datasets and then relabeled as a prediction. Reporting the best cross-validation fold (AUC 0.9215) alongside the five-fold average (0.8683) is a reporting or selection concern, not a circularity; similarly, the absence of an explicit statement that all slides from a patient were kept in the same split is a potential leakage or optimism concern, but the paper does not exhibit an equation-level or definitional reduction of the target into the inputs. There is no load-bearing self-citation chain: the cited methods are standard public architectures (GCN, SAGE, MIL baselines) and externally validated benchmarks, and no uniqueness theorem or prior author result is invoked to force the choice of VERN. Because the central claim is supported by held-out and external evaluation and is not equivalent to its inputs by construction, the appropriate circularity score is 0.
Assumptions & free parameters
free parameters (5)
- KNN neighborhood size K =
9
- Dropout rate =
0.2
- Learning rate and RMSprop alpha =
0.001 and 0.9
- Training epochs =
200
- Patch size and magnification =
512x512 pixels at 20x
assumptions (4)
- domain assumption STAS status can be determined from H&E whole-slide images and the labels assigned by two pathologists are accurate ground truth.
- domain assumption K-nearest neighbor graphs on patch coordinates capture the spatial relationship between the main tumor and STAS that is needed for classification.
- domain assumption A single slide-level label is valid even though STAS is a focal pattern, and averaging patch-level contributions yields a meaningful slide-level prediction.
- domain assumption Pretrained KimiaNet and CTransPath features transfer to this STAS prediction task.
Cite this review
Pith. "Pith review of Feature-interactive Siamese graph encoder-based image analysis to predict STAS from histopathology images in lung cancer." pith.science (2026). https://pith.science/paper/IISQVLO5
@misc{pith2026241115274,
  author       = {Pith},
  title        = {Pith review of: Feature-interactive Siamese graph encoder-based image analysis to predict STAS from histopathology images in lung cancer},
  year         = {2026},
  howpublished = {\url{https://pith.science/paper/IISQVLO5}},
  note         = {Machine review of arXiv:2411.15274}
}
read the original abstract
Spread through air spaces (STAS) is a distinct invasion pattern in lung cancer, crucial for prognosis assessment and guiding surgical decisions. Histopathology is the gold standard for STAS detection, yet traditional methods are subjective, time-consuming, and prone to misdiagnosis, limiting large-scale applications. We present VERN, an image analysis model utilizing a feature-interactive Siamese graph encoder to predict STAS from lung cancer histopathological images. VERN captures spatial topological features with feature sharing and skip connections to enhance model training. Using 1,546 histopathology slides, we built a large single-cohort STAS lung cancer dataset. VERN achieved an AUC of 0.9215 in internal validation and AUCs of 0.8275 and 0.8829 in frozen and paraffin-embedded test sections, respectively, demonstrating clinical-grade performance. Validated on a single-cohort and three external datasets, VERN showed robust predictive performance and generalizability, providing an open platform (http://plr.20210706.xyz:5000/) to enhance STAS diagnosis efficiency and accuracy.
Figures


Figures from the paper (1 more)

Reference graph
Works this paper leans on
-
[1]
M. L. Onozato et al., “Tumor islands in resected early -stage lung adenocarcinomas are associated with unique clinicopathologic and molecular characteristics and worse prognosis,” The American journal of surgical pathology, vol. 37, no. 2, pp. 287 –294, 2013
work page 2013
-
[2]
K. Kadota et al. , “Tumor spread through air spaces is an important pattern of invasion and impacts the frequency and location of recurrences after limited resection for small stage I lung adenocarcinomas,” Journal of Thoracic Oncology, vol. 10, no. 5, pp. 806 –814, 2015
work page 2015
-
[3]
Prognostic impact of intra -alveolar tumor spread in pulmonary adenocarcinoma,
A. Warth et al. , “Prognostic impact of intra -alveolar tumor spread in pulmonary adenocarcinoma,” The American journal of surgical pathology , vol. 39, no. 6, pp. 793 –801, 2015
work page 2015
-
[4]
M. Chae et al. , “Prognostic significance of tumor spread through air spaces in patients with stage IA part -solid lung adenocarcinoma after sublobar resection,” Lung Cancer, vol. 152, pp. 21–26, Feb. 2021, doi: 10.1016/j.lungcan.2020.12.001
-
[5]
T. Eguchi et al., “Lobectomy is associated with better outcomes than sublobar resection in spread through air spaces (ST AS)- positive T1 lung adenocarcinoma: a propensity score–matched analysis,” Journal of thoracic oncology, vol. 14, no. 1, pp. 87– 98, 2019
work page 2019
-
[6]
S. Shiono and N. Yanagawa, “Spread through air spaces is a predictive factor of recurrence and a prognostic factor in stage I lung adenocarcinoma,” Interactive cardiovascular and thoracic surgery , vol. 23, no. 4, pp. 567 –572, 2016
work page 2016
-
[7]
C. Dai et al. , “Tumor spread through air spaces affects the recurrence and overall survival in patients with lung adenocarcinoma> 2 to 3 cm,” Journal of thoracic oncology, vol. 12, no. 7, pp. 1052 –1060, 2017
work page 2017
-
[8]
Pathological prognostic factors of recurrence in early stage lung adenocarcinoma,
E. Yi, M. Bae, S. Cho, J. Chung, S. Jheon, and K. Kim, “Pathological prognostic factors of recurrence in early stage lung adenocarcinoma,” ANZ journal of surgery, vol. 88, no. 4, pp. 327 –331, 2018
work page 2018
Show all 72 references
-
[9]
Spread through air spaces is an independent predictor of recurrence in stage III (N2) lung adenocarcinoma,
Y. Terada et al., “Spread through air spaces is an independent predictor of recurrence in stage III (N2) lung adenocarcinoma,” Interactive cardiovascular and thoracic surgery, vol. 29, no. 3, pp. 442 –448, 2019
2019
-
[10]
Analysis of recurrence in lung adenocarcinoma with spread through air spaces,
H. A. Khalil et al. , “Analysis of recurrence in lung adenocarcinoma with spread through air spaces,” The Journal of Thoracic and Cardiovascular Surgery, vol. 166, no. 5, pp. 1317 –1328, 2023
2023
-
[11]
STAS: New explorations and challenges for thoracic surgeons,
T. Xia, Q. Yuan, and S. Xing, “STAS: New explorations and challenges for thoracic surgeons,” Clinical and Translational Oncology , pp. 1 –11, 2024
2024
-
[12]
W . D. Travis et al., “The International Association for the Study of Lung Cancer (IASLC) Staging Project for Lung Cancer: Recommendation to Introduce Spread Through Air Spaces as a Histologic Descriptor in the Ninth Edition of the TNM Classification of Lung Cancer. Analysis o...
2024 doi
-
[13]
Prognostic significance of limited resection in pathologic stage I lung adenocarcinoma with spread through air spaces,
K. Xu et al., “Prognostic significance of limited resection in pathologic stage I lung adenocarcinoma with spread through air spaces,” Journal of Thoracic Disease, vol. 15, no. 9, p. 4795, 2023
2023
-
[14]
Colorimetric histology using plasmonically active microscope slides,
E. Balaur et al., “Colorimetric histology using plasmonically active microscope slides,” Nature, vol. 598, no. 7879, pp. 65– 71, Oct. 2021, doi: 10.1038/s41586 -021 -03835 -2
2021 doi
-
[15]
Deep learning outperformed 11 pathologists in the classification of histopathological melanoma images,
A. Hekler et al., “Deep learning outperformed 11 pathologists in the classification of histopathological melanoma images,” European Journal of Cancer, vol. 118, pp. 91–96, Sep. 2019, doi: 10.1016/j.ejca.2019.06.012
2019 doi
-
[16]
Pathology Visions 2020: Through the Prism of Innovation,
“Pathology Visions 2020: Through the Prism of Innovation,” Journal of Pathology Informatics , vol. 12, no. 1, p. 37, Jan. 2021, doi: 10.4103/2153 -3539.326643
2020
-
[17]
Pathology: the clinical description of human disease,
W . K. Funkhouser, “Pathology: the clinical description of human disease,” in Essential Concepts in Molecular Pathology, Elsevier, 2020, pp. 177 –190
2020
-
[18]
The NanoSuit method: a novel histological approach for examining paraffin sections in a nondestructive manner by correlative light and electron microscopy ,
H. Kawasaki et al., “The NanoSuit method: a novel histological approach for examining paraffin sections in a nondestructive manner by correlative light and electron microscopy ,” Laboratory Investigation, vol. 100, no. 1, pp. 161 –173, Jan. 2020, doi: 10.1038/s41374 -019 -0309 -7
2020 doi
-
[19]
The value of frozen section diagnosis of tumor spread through air spaces in small -sized (≤ 2 cm) non -small cell lung cancer,
Y. Ding et al., “The value of frozen section diagnosis of tumor spread through air spaces in small -sized (≤ 2 cm) non -small cell lung cancer,” World Journal of Surgical Oncology, vol. 21, no. 1, p. 195, Jul. 2023, doi: 10.1186/s12957-023 -03092 -9
2023 doi
-
[20]
H. Cao et al., “Prediction of Spread Through Air Spaces (ST AS) By Intraoperative Frozen Section for Patients with cT1N0M0 Invasive Lung Adenocarcinoma: A Multi-Center Observational Study (ECTOP -1016),” Annals of Surgery , pp. 10 –1097
-
[21]
Accuracy and reproducibility of intraoperative assessment on tumor spread through air spaces in stage 1 lung adenocarcinomas,
J. A. Villalba et al. , “Accuracy and reproducibility of intraoperative assessment on tumor spread through air spaces in stage 1 lung adenocarcinomas,” Journal of Thoracic Oncology , vol. 16, no. 4, pp. 619 –629, 2021
2021
-
[22]
Assessment of the feasibility of frozen sections for the detection of spread through air spaces (STAS) in pulmonary adenocarcinoma,
F. Zhou et al., “Assessment of the feasibility of frozen sections for the detection of spread through air spaces (STAS) in pulmonary adenocarcinoma,” Modern Pathology, vol. 35, no. 2, pp. 210 –217, 2022
2022
-
[23]
Artificial intelligence in radiology ,
A. Hosny, C. Parmar, J. Quackenbush, L. H. Schwartz, and H. J. W . L. Aerts, “Artificial intelligence in radiology ,” N at Rev Cancer, vol. 18, no. 8, pp. 500 –510, Aug. 2018, doi: 10.1038/s41568 -018 -0016 -5
2018 doi
-
[24]
Recent advances and applications of deep learning methods in materials science,
K. Choudhary et al., “Recent advances and applications of deep learning methods in materials science,” npj Computational Materials, vol. 8, no. 1, p. 59, Apr. 2022, doi: 10.1038/s41524- 022 -00734 -6
2022 doi
-
[25]
Semi - supervised training of deep convolutional neural networks with heterogeneous data and few local annotations: An experiment on prostate histopathology image classification,
N. Marini, S. Otálora, H. Müller, and M. Atzori, “Semi - supervised training of deep convolutional neural networks with heterogeneous data and few local annotations: An experiment on prostate histopathology image classification,” Medical Image Analysis , vol. 73, p. 102165, Oc...
2021
-
[26]
Classification and mutation prediction based on histopathology H&E images in liver cancer using deep learning,
M. Chen et al., “Classification and mutation prediction based on histopathology H&E images in liver cancer using deep learning,” npj Precis. Onc., vol. 4, no. 1, p. 14, Dec. 2020, doi: 10.1038/s41698 -020 -0120 -3
2020 doi
-
[27]
MIST: multiple instance learning network based on Swin Transformer for whole slide image classification of colorectal adenomas,
H. Cai et al., “MIST: multiple instance learning network based on Swin Transformer for whole slide image classification of colorectal adenomas,” The Journal of Pathology, vol. 259, no. 2, pp. 125 –135, 2023
2023
-
[28]
Deconv -transformer (DecT): A histopathological image classification model for breast cancer based on color deconvolution and transformer architecture,
Z. He et al., “Deconv -transformer (DecT): A histopathological image classification model for breast cancer based on color deconvolution and transformer architecture,” Information Sciences, vol. 608, pp. 1093 –1112, Aug. 2022, doi: 12 10.1016/j.ins.2022.06.091
2022 doi
-
[29]
Topological Tumor Graphs: A Graph - Based Spatial Model to Infer Stromal Recruitment for Immunosuppression in Melanoma Histology,
H. Failmezger, S. Muralidhar, A. Rullan, C. E. de Andrea, E. Sahai, and Y. Yuan, “Topological Tumor Graphs: A Graph - Based Spatial Model to Infer Stromal Recruitment for Immunosuppression in Melanoma Histology,” Cancer Research, vol. 80, no. 5, pp. 1199 –1209, Mar. 2020, doi:...
2020 doi
-
[31]
Integrating spatial gene expression and breast tumour morphology via deep learning,
B. He et al. , “Integrating spatial gene expression and breast tumour morphology via deep learning,” Nature Biomedical Engineering , vol. 4, no. 8, pp. 827 –834, Aug. 2020, doi: 10.1038/s41551 -020 -0578 -x
2020 doi
-
[32]
Attention -based deep multiple instance learning,
M. Ilse, J. Tomczak, and M. Welling, “Attention -based deep multiple instance learning,” presented at the International conference on machine learning, PMLR, 2018, pp. 2127–2136
2018
-
[33]
Dual-stream multiple instance learning network for whole slide image classification with self- supervised contrastive learning,
B. Li, Y. Li, and K. W . Eliceiri, “Dual-stream multiple instance learning network for whole slide image classification with self- supervised contrastive learning,” presented at the Proceedings of the IEEE/CVF conference on computer vision and pattern recognition, 2021, pp. 14...
2021
-
[34]
Transmil: Transformer based correlated multiple instance learning for whole slide image classification,
Z. Shao, H. Bian, Y. Chen, Y. Wang, J. Zhang, and X. Ji, “Transmil: Transformer based correlated multiple instance learning for whole slide image classification,” Advances in Neural Information Processing Systems , vol. 34, pp. 2136 – 2147, 2021
2021
-
[35]
DTFD-MIL: Double-Tier Feature Distillation Multiple Instance Learning for Histopathology Whole Slide Image Classification,
H. Zhang et al., “DTFD-MIL: Double-Tier Feature Distillation Multiple Instance Learning for Histopathology Whole Slide Image Classification,” in 2022 IEEE/CVF Conference on Computer Vision and Pattern Recognition (CVPR) , New Orleans, LA, USA: IEEE, Jun. 2022, pp. 18780 –18790...
2022
-
[36]
Interventional Bag Multi -Instance Learning On Whole -Slide Pathological Images,
T. Lin, Z. Yu, H. Hu, Y. Xu, and C. W . Chen, “Interventional Bag Multi -Instance Learning On Whole -Slide Pathological Images,” in 2023 IEEE/CVF Conference on Computer V ision and Pattern Recognition (CVPR), 2023, pp. 19830–19839. doi: 10.1109/CVPR52729.2023.01899
2023
-
[37]
Nuclear morphology is a deep learning biomarker of cellular senescence,
I. Heckenbach et al., “Nuclear morphology is a deep learning biomarker of cellular senescence,” Nature Aging, vol. 2, no. 8, pp. 742 –755, Aug. 2022, doi: 10.1038/s43587-022-00263 -3
2022 doi
-
[38]
A comprehensive overview and comparative analysis on deep learning models: CNN, RNN, LSTM, GRU,
F. M. Shiri, T. Perumal, N. Mustapha, and R. Mohamed, “A comprehensive overview and comparative analysis on deep learning models: CNN, RNN, LSTM, GRU,” arXiv preprint arXiv:2305.17473 , 2023
2023 arXiv
-
[39]
Gross specimen handling procedures do not impact the occurrence of spread through air spaces (STAS) in lung cancer,
J. Metovic et al., “Gross specimen handling procedures do not impact the occurrence of spread through air spaces (STAS) in lung cancer,” The American journal of surgical pathology, vol. 45, no. 2, pp. 215 –222, 2021
2021
-
[40]
Histopathological aspects of resected non -small cell lung cancer, with emphasis on spread through air spaces and collapsed adenocarcinoma in situ,
J. L. G. Blaauwgeers, “Histopathological aspects of resected non -small cell lung cancer, with emphasis on spread through air spaces and collapsed adenocarcinoma in situ,” 2023
2023
-
[41]
Graph learning considering dynamic structure and random structure,
H. Dong, H. Ma, Z. Du, Z. Zhou, H. Yang, and Z. W ang, “Graph learning considering dynamic structure and random structure,” Journal of King Saud University -Computer and Information Sciences , vol. 35, no. 7, p. 101633, 2023
2023
-
[42]
Gas exchange and ventilation– perfusion relationships in the lung,
J. Petersson and R. W . Glenny, “Gas exchange and ventilation– perfusion relationships in the lung,” European Respiratory Journal , vol. 44, no. 4, pp. 1023 –1041, 2014
2014
-
[43]
Global variations in lung cancer incidence by histological subtype in 2020: a population -based study ,
Y. Zhang et al., “Global variations in lung cancer incidence by histological subtype in 2020: a population -based study ,” The Lancet Oncology , vol. 24, no. 11, pp. 1206 –1218, 2023
2020
-
[44]
Prognostic impact of tumor spread through air spaces for T2aN0 stage IB non‐small cell lung cancer,
Z. Chen et al., “Prognostic impact of tumor spread through air spaces for T2aN0 stage IB non‐small cell lung cancer,” C ancer Medicine, vol. 12, no. 14, pp. 15246 –15255, 2023
2023
-
[45]
Correlation of tumor spread through air spaces and clinicopathological characteristics in surgically resected lung adenocarcinomas,
S.-Y. Hu et al., “Correlation of tumor spread through air spaces and clinicopathological characteristics in surgically resected lung adenocarcinomas,” Lung Cancer, vol. 126, pp. 189–193, 2018
2018
-
[46]
Relationship between MTA1 and spread through air space and their joint influence on prognosis of patients with stage I-III lung adenocarcinoma,
Y. Liu et al., “Relationship between MTA1 and spread through air space and their joint influence on prognosis of patients with stage I-III lung adenocarcinoma,” Lung cancer, vol. 124, pp. 211–218, 2018
2018
-
[47]
Genetic and clinicopathologic characteristics of lung adenocarcinoma with tumor spread through air spaces,
J. S. Lee, E. K. Kim, M. Kim, and H. S. Shim, “Genetic and clinicopathologic characteristics of lung adenocarcinoma with tumor spread through air spaces,” Lung Cancer, vol. 123, pp. 121 –126, 2018
2018
-
[48]
p53 immunohistochemistry is an accurate surrogate for TP53 mutational analysis in endometrial carcinoma biopsies,
N. Singh et al. , “p53 immunohistochemistry is an accurate surrogate for TP53 mutational analysis in endometrial carcinoma biopsies,” The Journal of Pathology, vol. 250, no. 3, pp. 336 –345, 2020
2020
-
[49]
Correlative assessment of p53 immunostaining patterns and TP53 mutation status by next - generation sequencing in high-grade endometrial carcinomas,
N. Matsumoto et al. , “Correlative assessment of p53 immunostaining patterns and TP53 mutation status by next - generation sequencing in high-grade endometrial carcinomas,” International Journal of Gynecological Pathology, vol. 42, no. 6, pp. 567 –575, 2023
2023
-
[50]
Concordance of ALK fusion gene - rearrangement between immunohistochemistry and next - generation sequencing,
K. Wakuda et al. , “Concordance of ALK fusion gene - rearrangement between immunohistochemistry and next - generation sequencing,” International Journal of Clinical Oncology , vol. 29, no. 2, pp. 96 –102, 2024
2024
-
[51]
Integration of clinicopathological and mutational data offers insight into lung cancer with tumor spread through air spaces,
Y. Tian et al. , “Integration of clinicopathological and mutational data offers insight into lung cancer with tumor spread through air spaces,” Annals of Translational Medicine, vol. 9, no. 12, 2021
2021
-
[52]
An individualized nomogram for predicting and validating spread through air space (STAS) in surgically resected lung adenocarcinoma: a single center retrospective analysis,
J. Wang, Y. Yao, D. Tang, and W . Gao, “An individualized nomogram for predicting and validating spread through air space (STAS) in surgically resected lung adenocarcinoma: a single center retrospective analysis,” Journal of Cardiothoracic Surgery , vol. 18, no. 1, p. 337, 2023
2023
-
[53]
Comprehensive analysis of spread through air spaces in lung adenocarcinoma and squamous cell carcinoma using the 8th edition AJCC/UICC staging system,
M. Jia, S. Yu, J. Yu, Y. Li, H. Gao, and P. -L. Sun, “Comprehensive analysis of spread through air spaces in lung adenocarcinoma and squamous cell carcinoma using the 8th edition AJCC/UICC staging system,” BMC cancer, vol. 20, pp. 1–11, 2020
2020
-
[54]
Spread through air spaces (STAS) is a predictor of poor outcome in atypical carcinoids of the lung,
S. Altinay et al. , “Spread through air spaces (STAS) is a predictor of poor outcome in atypical carcinoids of the lung,” Virchows Archiv, vol. 475, pp. 325 –334, 2019
2019
-
[55]
Dynamic monitoring of PD‐L1 and Ki67 in circulating tumor cells of metastatic non‐small cell lung cancer patients treated with pembrolizumab,
M. Spiliotaki et al., “Dynamic monitoring of PD‐L1 and Ki67 in circulating tumor cells of metastatic non‐small cell lung cancer patients treated with pembrolizumab,” Molecular Oncology , vol. 17, no. 5, pp. 792 –809, 2023
2023
-
[56]
Spectral imaging with deep learning,
L. Huang, R. Luo, X. Liu, and X. Hao, “Spectral imaging with deep learning,” Light: Science & Applications, vol. 1 1, no. 1, p. 61, 2022
2022
-
[57]
Fine-Tuning and training of densenet for histopathology image representation using TCGA diagnostic slides,
A. Riasatian et al., “Fine-Tuning and training of densenet for histopathology image representation using TCGA diagnostic slides,” Medical Image Analysis, vol. 70, p. 102032, 2021, doi: https://doi.org/10.1016/j.media.2021.102032
2021
-
[58]
Transformer-based unsupervised contrastive learning for histopathological image classification,
X. Wang et al., “Transformer-based unsupervised contrastive learning for histopathological image classification,” Medical Image Analysis , vol. 81, p. 102559, Oct. 2022, doi: 10.1016/j.media.2022.102559
2022
-
[59]
Densely Connected Convolutional Networks,
G. Huang, Z. Liu, L. Van Der Maaten, and K. Q. Weinber ger , “Densely Connected Convolutional Networks,” in 2017 IEEE Conference on Computer Vision and Pattern Recognition (CVPR), Honolulu, HI: IEEE, Jul. 2017, pp. 2261–2269. doi: 13 10.1109/CVPR.2017.243
2017 doi
-
[60]
Swin transformer: Hierarchical vision transformer using shifted windows,
Z. Liu et al. , “Swin transformer: Hierarchical vision transformer using shifted windows,” presented at the Proceedings of the IEEE/CVF International Conference on Computer Vision, 2021, pp. 10012 –10022
2021
-
[61]
A fuzzy k-nearest neighbor algorithm,
J. M. Keller, M. R. Gray, and J. A. Givens, “A fuzzy k-nearest neighbor algorithm,” IEEE transactions on systems, man, and cybernetics, no. 4, pp. 580 –585, 1985
1985
-
[62]
Pathomic Fusion: An Integrated Framework for Fusing Histopathology and Genomic Features for C ancer Diagnosis and Prognosis,
R. J. Chen et al., “Pathomic Fusion: An Integrated Framework for Fusing Histopathology and Genomic Features for C ancer Diagnosis and Prognosis,” IEEE Transactions on Medical Imaging , vol. 41, no. 4, pp. 757 –770, Apr. 2022, doi: 10.1109/TMI.2020.3021387
2022
-
[63]
Semi -supervised classification with graph convolutional networks,
T. N. Kipf and M. Welling, “Semi -supervised classification with graph convolutional networks,” arXiv preprint arXiv:1609.02907 , 2016
2016 arXiv
-
[64]
Inductive Representation Learning on Large Graphs,
W . L. Hamilton, R. Ying, and J. Leskovec, “Inductive Representation Learning on Large Graphs,” in Proceedings of the 31st International Conference on Neural Information Processing Systems, in NIPS’17. Red Hook, NY, USA: C urran Associates Inc., 2017, pp. 1025 –1035
2017
-
[65]
Deep Learning using Rectified Linear Units (ReLU),
A. F. Agarap, “Deep Learning using Rectified Linear Units (ReLU),” arXiv:1803.08375 [cs, stat], Feb. 2019, Accessed: Mar. 15, 2020. [Online]. Available: http://arxiv.org/abs/1803.08375
2019 arXiv
-
[66]
Local-aggregation graph networks,
J. Chang, L. Wang, G. Meng, Q. Zhang, S. Xiang, and C . Pan, “Local-aggregation graph networks,” IEEE Transactions on Pattern Analysis and Machine Intelligence, vol. 42, no. 1 1, pp. 2874 –2886, 2019
2019
-
[67]
Multilayer perceptron (MLP),
H. Taud and J. -F. Mas, “Multilayer perceptron (MLP),” Geomatic approaches for modeling land change scenarios, pp. 451 –455, 2018
2018
-
[68]
Prevalence of neural collapse during the terminal phase of deep learning training,
V. Papyan, X. Han, and D. L. Donoho, “Prevalence of neural collapse during the terminal phase of deep learning training,” Proceedings of the National Academy of Sciences, vol. 1 17, no. 40, pp. 24652 –24663, 2020
2020
-
[69]
Uctransnet: rethinking the skip connections in u -net from a channel-wise perspective with transformer,
H. Wang, P. Cao, J. Wang, and O. R. Zaiane, “Uctransnet: rethinking the skip connections in u -net from a channel-wise perspective with transformer,” presented at the Proceedings of the AAAI conference on artificial intelligence, 2022, pp. 2441– 2449
2022
-
[70]
Deep learning modelling techniques: current progress, applications, advantages, and challenges,
S. F. Ahmed et al. , “Deep learning modelling techniques: current progress, applications, advantages, and challenges,” Artificial Intelligence Review, vol. 56, no. 11, pp. 13521–13617, 2023
2023
-
[71]
A sufficient condition for convergences of adam and rmsprop,
F. Zou, L. Shen, Z. Jie, W . Zhang, and W . Liu, “A sufficient condition for convergences of adam and rmsprop,” presented at the Proceedings of the IEEE/CVF Conference on computer vision and pattern recognition, 2019, pp. 11127 –11135
2019
-
[72]
The advantages of the Matthews correlation coefficient (MCC) over F1 score and accuracy in binary classification evaluation,
D. Chicco and G. Jurman, “The advantages of the Matthews correlation coefficient (MCC) over F1 score and accuracy in binary classification evaluation,” BMC genomics, vol. 21, pp. 1–13, 2020
2020
-
[73]
Comparison of deep learning approaches to predict COVID-19 infection,
T. B. Alakus and I. Turkoglu, “Comparison of deep learning approaches to predict COVID-19 infection,” Chaos, Solitons & Fractals, vol. 140, p. 110120, 2020
2020
Reviewed August 12, 2026 · model on record in the stance chip above.
Discussion (0). Continue with ORCID to comment.