REVIEW 3 major objections 3 minor 82 references
Navigating the Effect of Parametrization for Dimensionality Reduction
T0 review · 3 major / 3 minor · reviewed 2026-08-12 · deepseek-v4-flash
Pith's one-line read Parametric DR blurs clusters; mining mid-near hard negatives restores them.
desk verdict Solid empirical study and a useful new parametric DR method, but the hard-negative explanation for the gain is not actually supported; the method itself likely survives, the diagnosis is shakier. read the letter →
The pith
A machine-rendered reading of the paper's core claim, the machinery that carries it, and where it could break.
The reading
What carries the argument
The load-bearing object is the decomposition of a neighborhood-embedding loss into an attractive nearest-neighbor term and a repulsive false-pair term, together with how a chosen loss family treats the repulsive term. The paper shows that in NEG-style losses (UMAP, PaCMAP) the repulsive contribution of each negative pair depends only on that pair, so when a negative pair drifts close the gradient is large; in NCE/InfoNCE losses (t-SNE, NCVis) each negative term is normalized against all pairs in the batch, which weakens the per-pair repulsive gradient under an MLP projector. A second mechanism is hard-negative mining via mid-near pairs: for each anchor, six points are sampled uniformly and the second-closest is kept, a pair the paper proves is a false negative with probability $O(1/n^2)$. The ParamRepulsor loss then applies explicit repulsive weights to mid-near and uniformly sampled pairs, so the projector learns to push apart clusters that a parametric model would otherwise leave blurred.
What would settle it
Track, during a ParamRepulsor training run, the average low-dimensional distance of mid-near pairs against uniformly sampled negative pairs; if mid-near pairs are not systematically closer in the embedding, Observation 4 fails and the hard-negative explanation for the method's gains collapses. A second check is to replace the mid-near sampler with a random sampler while keeping the same loss weights; if local-structure metrics stay high, the benefit comes from the loss, not from hard-negative mining.
Extended reading notes
Core claim
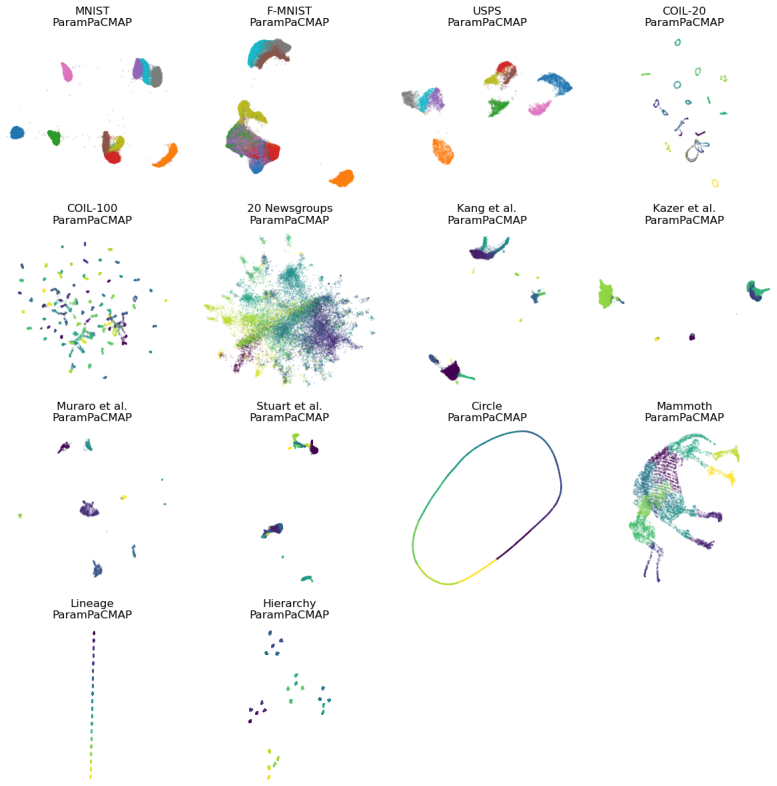
The paper's central discovery is that parametrization changes neighborhood embedding in a specific, diagnosable way: a neural-network projector preserves global inter-cluster geometry but systematically fails to separate points that are close in the embedding yet not true neighbors, producing blurred cluster boundaries. The cause, per the authors, is insufficient repulsion of negative pairs: NCE- and InfoNCE-style losses, used by parametric t-SNE and NCVis, dilute the gradient on any single negative pair because each negative term is normalized against all other pairs, whereas NEG-style losses (UMAP, PaCMAP) penalize each close negative pair directly and therefore survive parametrization better. To exploit this, ParamRepulsor replaces uniform negative sampling with mid-near hard-negative sampling—for each anchor, the second-closest among six uniformly drawn points—and adds a repulsive weight on those pairs. The authors prove that mid-near samples are almost never false negatives, with error probability decaying as $O(1/n^2)$, and argue that under a shallow parametrization high-dimensional closeness still correlates with low-dimensional closeness, so mid-near pairs are genuinely hard. On fourteen datasets, ParamRepulsor reports the highest or statistically tied local-structure scores among parametric methods, with global-structure metrics comparable to the best alternatives.
Load-bearing premise
The hard-negative mechanism rests on the claim that a shallow neural-network projector keeps high-dimensional distances correlated with low-dimensional ones, so that pairs selected as mid-near in the input space are actually close in the current embedding and hence genuinely hard; the paper supports this with a qualitative figure rather than a proof.
Editorial extensions
If this is right
- A practitioner switching from t-SNE or UMAP to a parametric version should expect cluster boundaries to blur; the paper says this is a systematic effect of parametrization, not a tuning problem.
- NEG-style losses such as those in UMAP and PaCMAP are the safer family for parametric DR, while NCE- and InfoNCE-style losses such as those in t-SNE and NCVis need extra repulsive machinery to retain local detail.
- Label-free hard-negative mining via mid-near pairs is a practical alternative to uniform negative sampling, with a false-negative probability that decays quadratically in dataset size.
- ParamRepulsor provides a genuine mapping from input to embedding, so unseen points can be projected directly, preserving the main practical advantage of parametric DR while matching non-parametric local structure on the reported benchmarks.
- On the reported datasets, ParamRepulsor posts the highest or statistically tied local-structure scores among parametric methods on most benchmarks, and its global-structure scores remain competitive.
Reading between the lines
- A natural extension not tested in the paper is to add mid-near repulsion to non-parametric UMAP or PaCMAP; if the mechanism is truly about hard negatives rather than parametrization, it should sharpen cluster boundaries there too.
- The paper's explanation implies a cheap diagnostic for parametrization damage: the ratio of mean far-pair distance to nearest-neighbor distance in the embedding, which parametric methods systematically lower; this ratio could be used to detect degraded local structure without labels.
- Because the false-negative bound improves as $O(1/n^2)$, ParamRepulsor's relative advantage over random negative sampling should grow on larger datasets, which is testable by measuring local-structure metrics on subsamples of a single large dataset.
- The hard-negative hypothesis predicts that deeper or convolutional projectors, which can break the correlation between input-space and embedding-space distances, may need a different repulsion schedule; the paper only studies shallow MLPs.
Editorial analysis
A structured set of objections, weighed in public.
Referee Report
Summary. The paper studies parametric neighborhood-embedding dimensionality reduction, arguing that parametric versions of t-SNE, UMAP, and PaCMAP preserve global structure but lose local detail, and that the deficit is explained by weak repulsion of negative pairs, with NEG-style losses adapting better to parametrization than NCE/InfoNCE losses. On this diagnosis it builds ParamRepulsor, a parametric PaCMAP variant that pre-selects 'mid-near' pairs as hard negatives and applies an additional repulsive force, and it reports local- and global-structure evaluations on 14 datasets with 10 seeds, significance tests, and released code. The paper also contains two theorems: an exact reformulation of PaCMAP's loss as generalized NEG (Theorem 3.1) and a false-negative probability calculation for mid-near sampling (Theorem 4.1).
Significance. The headline finding, if established, is practically important: many practitioners do treat parametric and non-parametric neighbor embeddings as interchangeable, and the paper's proposed remedy (strong repulsion of mid-near negatives) is simple and actionable. The manuscript has genuine strengths: it ships code and detailed implementation appendices; the experiments span 14 datasets with multiple seeds and t-tests; Theorem 3.1 is a clean, non-circular derivation; and Theorem 4.1 is a correct finite-population probability calculation showing that mid-near sampling avoids false negatives with high probability. The significance is currently conditional, however, because the method's central mechanistic explanation --- that the precomputed mid-near pairs are actually hard negatives in the evolving low-dimensional embedding --- rests on evidence from final embeddings only, not from training-time behavior.
major comments (3)
- [Section 4, Observation 4; Algorithms 1-2; Figure 3] The paper's central explanation for ParamRepulsor is that mid-near (MN) pairs constitute hard negatives, because 'shallow parametrization ... ensures that distances in the high-dimensional space remain correlated with those in the low-dimensional embedding.' The only direct evidence offered is Figure 3 (and Figure 22), which reports distances in the final embedding. Final proximity is not evidence of hardness at gradient time: a pair can remain close at convergence simply because its repulsive gradient is small or because it has not yet been separated. Moreover, the MN pairs are selected once before training (Algorithm 2, lines 2-8) and are never re-mined as the embedding evolves; a random Kaiming-initialized MLP (Appendix F) is not shown to preserve distance rankings at initialization. To support the 'hard negative mining' claim, the paper should provide training-time evidence --- for example, the rank correlation between high- and low-dimensional distances at several epochs, or the gradient norms contributed by MN vs. uniformly sampled FP pairs. Without such evidence, the observed gains could come from adding a strong repulsive term on a fixed set of mid-distance pairs rather than from focusing repulsion on hard negatives, which would collapse the paper's mechanistic diagnosis of the parametric deficit.
- [Section 3, Observation 2 and Figure 2] The claim that NEG-style losses are more adaptable to parametrization than NCE/InfoNCE losses is presented as a causal explanation, but the comparison is confounded by implementation differences beyond the loss family. P-UMAP and P-PaCMAP differ from P-ItSNE and P-NCVis in optimizer schedules, sampling procedures, and other implementation choices inherited from [17] and [18], and the paper does not report a controlled swap. For example, Table 1 shows P-NtSNE (a NEG variant) behaving more like P-ItSNE than like P-UMAP on several datasets, which suggests that loss family alone does not cleanly separate the methods. The paper should either (a) fix the projector, optimizer, batch size, and negative-sampling rule and vary only the loss functional, or (b) rephrase the observation as a correlation/hypothesis rather than a demonstrated cause. As written, the abstract's statement that 'the choice of loss function also has an impact' is not directly established by the experiments.
- [Section 5; Tables 1-5] The quantitative tables report only mean values with bold/italic significance flags; no standard deviations, standard errors, or confidence intervals are given. This matters because several headline comparisons are extremely small (e.g., Table 1, MNIST: P-PaCMAP 0.968 vs. P-REP 0.969; KANG: P-PaCMAP 0.960 vs. P-REP 0.961), and the reader cannot judge the magnitude or stability of the 'state-of-the-art' advantage. In addition, the abstract claims that parametric methods 'lose significant local details' relative to non-parametric counterparts and that ParamRepulsor approaches non-parametric performance, but Tables 1-5 contain no non-parametric baselines; Figure 2 provides qualitative support only. To make the central empirical claims fully supported, the paper should add error bars (or per-seed values) and include the leading non-parametric methods in the quantitative tables.
minor comments (3)
- [Appendix E, Theorem 4.1] The proof of Theorem 4.1 is internally consistent: when exactly one of the six requested samples falls in the 10-NN set, the selected second-closest sample cannot be that NN, so the event decomposition in Eqs. (19)-(24) is correct. The finite-n threshold n≈1330 stated in Corollary 4.2, however, is asserted without a derivation of the crossing point; it would be helpful to state the finite-n comparison in closed form or show it directly in Figure 21.
- [Section 5.1, Local Structure 1 and 2] The local-structure metrics are labeled k-NN accuracy and SVM accuracy, which evaluate class label separation in the embedding; this is a standard proxy, but the paper should note more explicitly that these measures reward cluster separability and therefore may not fully capture local manifold geometry.
- [Throughout] There are several typos and unclear passages: 'ParamRespulsor' in Section 5, 'nearest neighbors are10-nearest neighbors' missing a space, 'N N' with no space in Table 2, and the repeated phrase 'increasing the number of layers beyond increasing the number of layers beyond three' in Appendix A. These should be cleaned up in revision.
Circularity Check
No significant circularity: the central claims are supported by independent experiments and self-contained proofs, not by definitions or self-citation chains.
full rationale
The paper's main diagnostic claim, that parametric NE methods lose local structure because of weak repulsion on negative pairs, is an empirical comparison (Section 3, Observations 1-2) supported by quantitative metrics on multiple datasets; it does not reduce to a fitted parameter or a self-citation. Theorem 3.1 is an exact algebraic reformulation of PaCMAP's loss into generalized NEG form, with the proof in Appendix D deriving the q functions rather than assuming them; this is a mathematical equivalence, not a circular prediction. Theorem 4.1 and Corollary 4.2 are a combinatoric calculation of false-negative probability for mid-near sampling; the proof is self-contained and does not depend on ParamRepulsor's performance. The closest step to circularity is Observation 4, which asserts that shallow parametrization keeps high-dimensional and low-dimensional distances correlated, so mid-near pairs are 'hard negatives'; the evidence is Figure 3, showing final embedding distances. This is a plausible but imperfectly supported empirical assumption, not a derivation that assumes its own conclusion, and it does not make the method's benchmark results circular. The authors do build ParamRepulsor on their own prior PaCMAP work, but PaCMAP is an externally published method and the paper's contribution is the extension and the new repulsion mechanism, which is evaluated against independent baselines and benchmarks. The paper's limitations section candidly notes unresolved questions such as better evaluation metrics and architecture choice, further indicating that the claims are not forced by construction. No step satisfies the standard of exhibiting an equation or fitted value that is equivalent to the paper's own output by definition.
Assumptions & free parameters
free parameters (6)
- h (mid-near sampling pool size) =
6
- w_MN and w_FP (repulsive force weights) =
not reported numerically in the paper
- n_NB, n_MN, n_FP (pair counts per anchor) =
not fully reported; k-NN count inherited from PaCMAP
- Projector architecture and activation =
3 hidden layers of 100 units, SiLU for ParamRepulsor
- Optimization schedule =
batch size 1024, Adam beta=(0.9, 0.999); epochs and learning rate in code
- PaCMAP constants C1 and C2 =
10 and 1
assumptions (5)
- domain assumption A K-nearest-neighbor graph with Euclidean distances captures the local structure that DR should preserve.
- domain assumption The compared parametric implementations are faithful and comparable representatives of their loss families.
- ad hoc to paper Shallow parametrization keeps high-dimensional and low-dimensional distances correlated enough for mid-near pairs to be hard negatives.
- domain assumption Mid-near sampling can be modeled as drawing 6 points uniformly with replacement and taking the second closest.
- ad hoc to paper Loss-family differences, not other implementation differences, explain the parametric performance gap between NEG and NCE/InfoNCE methods.
Cite this review
Pith. "Pith review of Navigating the Effect of Parametrization for Dimensionality Reduction." pith.science (2026). https://pith.science/paper/467Z5B4G
@misc{pith2026241115894,
  author       = {Pith},
  title        = {Pith review of: Navigating the Effect of Parametrization for Dimensionality Reduction},
  year         = {2026},
  howpublished = {\url{https://pith.science/paper/467Z5B4G}},
  note         = {Machine review of arXiv:2411.15894}
}
read the original abstract
Parametric dimensionality reduction methods have gained prominence for their ability to generalize to unseen datasets, an advantage that traditional approaches typically lack. Despite their growing popularity, there remains a prevalent misconception among practitioners about the equivalence in performance between parametric and non-parametric methods. Here, we show that these methods are not equivalent -- parametric methods retain global structure but lose significant local details. To explain this, we provide evidence that parameterized approaches lack the ability to repulse negative pairs, and the choice of loss function also has an impact. Addressing these issues, we developed a new parametric method, ParamRepulsor, that incorporates Hard Negative Mining and a loss function that applies a strong repulsive force. This new method achieves state-of-the-art performance on local structure preservation for parametric methods without sacrificing the fidelity of global structural representation. Our code is available at https://github.com/hyhuang00/ParamRepulsor.
Figures


Figures from the paper (20 more)




Reference graph
Works this paper leans on
-
[17]
Sainburg, T., L. McInnes, T. Q. Gentner. Parametric UMAP embeddings for representation and semisupervised learning. Neural Computation, 33(11):2881–2907, 2021
work page 2021
-
[18]
Damrich, S., J. N. Böhm, F. A. Hamprecht, et al. From t-SNE to UMAP with contrastive learning. In International Conference on Learning Representations. 2023
work page 2023
-
[1]
Böhm, J. N., P. Berens, D. Kobak. Unsupervised visualization of image datasets using contrastive learning. In International Conference on Learning Representations. 2023
2023
-
[2]
Mu, J., S. Bhat, P. Viswanath. All-but-the-Top: Simple and Effective Postprocessing for Word Representations. In International Conference on Learning Representations. 2018
2018
- [3]
-
[4]
Cao, J., M. Spielmann, X. Qiu, et al. The single-cell transcriptional landscape of mammalian organogenesis. Nature, 566(7745):496–502, 2019. 10
work page 2019
-
[5]
Becht, E., L. McInnes, J. Healy, et al. Dimensionality reduction for visualizing single-cell data using UMAP. Nature Biotechnology, 37(1):38–44, 2019
work page 2019
-
[6]
Amezquita, R. A., A. T. Lun, E. Becht, et al. Orchestrating Single-Cell Analysis with Biocon- ductor. Nature Methods, 17(2):137–145, 2020
work page 2020
Show all 82 references
-
[7]
Dries, R., Q. Zhu, R. Dong, et al. Giotto: a toolbox for integrative analysis and visualization of spatial expression data. Genome Biology, 22:1–31, 2021
2021
-
[8]
Atitey, K., A. A. Motsinger-Reif, B. Anchang. Model-based evaluation of spatiotemporal data reduction methods with unknown ground truth through optimal visualization and interpretability metrics. Briefings in Bioinformatics, 25(1):bbad455, 2024
2024
-
[9]
Böhm, J. N., P. Berens, D. Kobak. Attraction-Repulsion Spectrum in Neighbor Embeddings. Journal of Machine Learning Research, 23(1):4118–4149, 2022
2022
-
[10]
van der Maaten, L., G. Hinton. Visualizing Data using t-SNE. Journal of Machine Learning Research, 9:2579–2605, 2008
2008
-
[11]
Tang, J., J. Liu, M. Zhang, et al. Visualizing Large-Scale and High-Dimensional Data. In Proceedings of the 25th International Conference on the World Wide Web, pages 287–297. 2016
2016
-
[12]
Healy, J
McInnes, L., J. Healy, J. Melville. UMAP: Uniform Manifold Approximation and Projection for Dimension Reduction. arXiv e-prints, arXiv:1802.03426, 2018
2018 arXiv
-
[13]
Huang, C
Wang, Y ., H. Huang, C. Rudin, et al. Understanding How Dimension Reduction Tools Work: An Empirical Approach to Deciphering t-SNE, UMAP, TriMAP, and PaCMAP for Data Visualization. Journal of Machine Learning Research, 22, 2021
2021
-
[14]
Github - lmcinnes/umap: Uniform Manifold Approximation and Projection (UMAP)
McInnes, Leland. Github - lmcinnes/umap: Uniform Manifold Approximation and Projection (UMAP). https://github.com/lmcinnes/umap, 2020
2020
-
[15]
Cortes, C
LeCun, Y ., C. Cortes, C. Burges. MNIST handwritten digit database. ATT Labs [Online]. Available: http://yann. lecun. com/exdb/mnist, 2, 2010
2010
-
[16]
Learning a Parametric Embedding by Preserving Local Structure
van der Maaten, L. Learning a Parametric Embedding by Preserving Local Structure. In Artificial Intelligence and Statistics, pages 384–391. PMLR, 2009
2009
-
[19]
Aggarwal, C. C., A. Hinneburg, D. A. Keim. On the Surprising Behavior of Distance Metrics in High Dimensional Space. In Database Theory—ICDT 2001: 8th International Conference London, UK, January 4–6, 2001 Proceedings 8, pages 420–434. Springer, 2001
2001
-
[20]
Hu, T., Z. Liu, F. Zhou, et al. Your Contrastive Learning is Secretly Doing Stochastic Neighbor Embedding. In International Conference on Learning Representations. 2023
2023
-
[21]
Hyvärinen
Gutmann, M., A. Hyvärinen. Noise-contrastive estimation: A new estimation principle for unnormalized statistical models. In Proceedings of the International Conference on Artificial Intelligence and Statistics, pages 297–304. 2010
2010
-
[22]
Oord, A. v. d., Y . Li, O. Vinyals. Representation Learning with Contrastive Predictive Coding. arXiv preprint arXiv:1807.03748, 2018
2018 arXiv
-
[23]
Sutskever, K
Mikolov, T., I. Sutskever, K. Chen, et al. Distributed Representations of Words and Phrases and their Compositionality. Advances in Neural Information Processing Systems, 26, 2013
2013
-
[24]
Artemenkov, A., M. Panov. Ncvis: Noise Contrastive Approach for Scalable Visualization. In Proceedings of The Web Conference, pages 2941–2947. 2020. 11
2020
-
[25]
Accelerating t-SNE using Tree-Based Algorithms
van der Maaten, L. Accelerating t-SNE using Tree-Based Algorithms. Journal of Machine Learning Research, 15:3221–3245, 2014
2014
-
[26]
Hong, Y .-C
Yeh, C.-H., C.-Y . Hong, Y .-C. Hsu, et al. Decoupled contrastive learning. In European Conference on Computer Vision, pages 668–684. Springer, 2022
2022
-
[27]
Understanding deep contrastive learning via coordinate-wise optimization.Advances in Neural Information Processing Systems, 35:19511–19522, 2022
Tian, Y . Understanding deep contrastive learning via coordinate-wise optimization.Advances in Neural Information Processing Systems, 35:19511–19522, 2022
2022
-
[28]
Kalenichenko, J
Schroff, F., D. Kalenichenko, J. Philbin. Facenet: A unified embedding for face recognition and clustering. In Proceedings of the IEEE Conference on Computer Vision and Pattern Recognition, pages 815–823. 2015
2015
-
[29]
Xiang, S
Oh Song, H., Y . Xiang, S. Jegelka, et al. Deep metric learning via lifted structured feature em- bedding. In Proceedings of the IEEE Conference on Computer Vision and Pattern Recognition, pages 4004–4012. 2016
2016
-
[30]
D., C.-Y
Robinson, J. D., C.-Y . Chuang, S. Sra, et al. Contrastive learning with hard negative samples. In International Conference on Learning Representations. 2020
2020
-
[31]
Robinson, Y .-C
Chuang, C.-Y ., J. Robinson, Y .-C. Lin, et al. Debiased contrastive learning.Advances in Neural Information Processing Systems, 33:8765–8775, 2020
2020
-
[32]
Rasul, R
Xiao, H., K. Rasul, R. V ollgraf. Fashion-MNIST: a Novel Image Dataset for Benchmarking Machine Learning Algorithms. arXiv preprint arXiv:1708.07747, 2017
2017 arXiv
-
[33]
Nene, S. A., S. K. Nayar, H. Murase. Columbia Object Image Library (coil-20). Tech. rep., Technical Report CUCS-005-96, 1996
1996
-
[34]
Columbia Object Image Library (coil-100)
—. Columbia Object Image Library (coil-100). Tech. rep., Technical Report CUCS-006-96, 1996
1996
-
[35]
Kang, H. M., M. Subramaniam, S. Targ, et al. Multiplexed droplet single-cell RNA-sequencing using natural genetic variation. Nature Biotechnology, 36(1):89, 2018
2018
-
[36]
Kazer, S. W., T. P. Aicher, D. M. Muema, et al. Integrated single-cell analysis of multicellular immune dynamics during hyperacute HIV-1 infection. Nature Medicine, 26(4):511–518, 2020
2020
-
[37]
Muraro, M. J., G. Dharmadhikari, D. Grün, et al. A single-cell transcriptome atlas of the human pancreas. Cell Systems, 3(4):385–394, 2016
2016
-
[38]
Butler, P
Stuart, T., A. Butler, P. Hoffman, et al. Comprehensive integration of single-cell data. Cell, 177(7):1888–1902, 2019
1902
-
[39]
Newsweeder: Learning to Filter Netnews
Lang, K. Newsweeder: Learning to Filter Netnews. In Proceedings of the International Conference on Machine Learning, pages 331–339. 1995
1995
-
[40]
Townes, F. W., S. C. Hicks, M. J. Aryee, et al. Feature selection and dimension reduction for single-cell rna-seq based on a multinomial model. Genome Biology, 20(1):1–16, 2019
2019
-
[41]
Mammuthus primigenius (blumbach)
The Smithsonian Institute. Mammuthus primigenius (blumbach). https://3d.si.edu/object/3d/mammuthus-primigenius-blumbach: 341c96cd-f967-4540-8ed1-d3fc56d31f12 , 2020
2020
-
[42]
Coenen, A., A. Pearce. Understanding UMAP. https://pair-code.github.io/ understanding-umap/, 2019
2019
-
[43]
Huang, H., Y . Wang, C. Rudin, et al. Towards a comprehensive evaluation of dimension reduction methods for transcriptomic data visualization. Communications Biology, 5(1):719, 2022
2022
-
[44]
Damrich, F
Nazari, P., S. Damrich, F. A. Hamprecht. Geometric autoencoders–what you see is what you decode. In Proceedings of International Conference on Machine Learning, pages 25834–25857. PMLR, 2023. 12
2023
-
[45]
Kiani, B. T., R. Balestriero, Y . Chen, et al. Joint Embedding Self-supervised Learning in the Kernel Regime. arXiv preprint arXiv:2209.14884, 2022
2022 arXiv
-
[46]
Balestriero, R., Y . LeCun. Contrastive and Non-Contrastive Self-Supervised Learning Recover Global and Local Spectral Embedding methods. Advances in Neural Information Processing Systems, 35:26671–26685, 2022
2022
-
[47]
Kobak, D., P. Berens. The art of using t-SNE for single-cell transcriptomics. Nature Communi- cation, 10:5416, 2019
2019
-
[48]
Amid, E., M. K. Warmuth. TriMAP: Large-scale Dimensionality Reduction Using Triplets. arXiv e-prints, arXiv:1910.00204, 2019
1910 arXiv
-
[49]
On lines and planes of closest fit to systems of points in space
Pearson, K. On lines and planes of closest fit to systems of points in space. Philosophical Magazine, 2(11):559–572, 1901
1901
-
[50]
Multidimensional scaling: I Theory and method
Torgerson, W. Multidimensional scaling: I Theory and method. Psychometrika, 17(4):401–419, 1952
1952
-
[51]
Lee, D. D., H. S. Seung. Learning the parts of objects by non-negative matrix factorization. Nature, 401(6755):788–791, 1999
1999
-
[52]
Tenenbaum, J. B., V . de Silva, J. C. Langford. A Global Geometric Framework for Nonlinear Dimensionality Reduction. Science, 290(5500):2319–2323, 2000
2000
-
[53]
Roweis, S. T., L. K. Saul. Nonlinear Dimensionality Reduction by Locally Linear Embedding. Science, 290(5500):2323–2326, 2000
2000
-
[54]
Belkin, M., P. Niyogi. Laplacian Eigenmaps and Spectral Techniques for Embedding and Clustering. In Advances in Neural Information Processing Systems, vol. 14, pages 585–591. MIT Press, 2001
2001
-
[55]
Girshick, A
Xie, J., R. Girshick, A. Farhadi. Unsupervised Deep Embedding for Clustering Analysis. In Proceedings of International Conference on Machine Learning, pages 478–487. PMLR, 2016
2016
-
[56]
Schulz, B
Gisbrecht, A., A. Schulz, B. Hammer. Parametric nonlinear dimensionality reduction using kernel t-SNE. Neurocomputing, 147:71–82, 2015
2015
-
[57]
Moor, M., M. Horn, B. Rieck, et al. Topological Autoencoders. In International Conference on Machine Learning, pages 7045–7054. PMLR, 2020
2020
-
[58]
Viégas, I
Wattenberg, M., F. Viégas, I. Johnson. How to use t-SNE effectively. Distill, 1(10):e2, 2016
2016
-
[59]
Belkina, A. C., C. O. Ciccolella, R. Anno, et al. Automated optimized parameters for t- distributed stochastic neighbor embedding improve visualization and analysis of large datasets. Nature Communications, 10(5415), 2019
2019
-
[60]
Cao, Y ., L. Wang. Automatic selection of t-SNE perplexity. arXiv preprint arXiv:1708.03229, 2017
2017 arXiv
-
[61]
Zhang, S
He, K., X. Zhang, S. Ren, et al. Deep Residual Learning for Image Recognition. In Proceedings of the IEEE Conference on Computer Vision and Pattern Recognition, pages 770–778. 2016
2016
-
[62]
Kingma, D. P., J. Ba. Adam: A Method for Stochastic Optimization. InInternational Conference on Learning Representations. 2015
2015
-
[63]
Hull, J. J. A database for handwritten text recognition research. IEEE Transactions on Pattern Analysis and Machine Intelligence, 16(5):550–554, 1994
1994
-
[64]
Varoquaux, A
Pedregosa, F., G. Varoquaux, A. Gramfort, et al. Scikit-learn: Machine learning in Python. Journal of Machine Learning Research, 12:2825–2830, 2011
2011
-
[65]
Zheng, G. X., J. M. Terry, P. Belgrader, et al. Massively parallel digital transcriptional profiling of single cells. Nature Communications, 8(1):1–12, 2017. 13 A Discussion on the Depth of of Neural Network Projector Figure 5: Effect of the number of layers on the MNIST datas...
2017
-
[66]
3” and “8
The circle is divided into ten arcs of the same length, and each point receives a label that represents the index of the arc it belongs to. Mammoth The mammoth dataset [ 42, 41] contains 10k points from a 3D woolly mammoth skeleton. Lineage The Gaussian Lineage dataset [5, 43]...
-
[67]
The dataset sizes are 1, 306, 127 and 2, 058, 652, respectively
and [4]. The dataset sizes are 1, 306, 127 and 2, 058, 652, respectively. The results are shown in Figure 23. We can see that ParamRepulsor outperforms ParamUMAP in terms of scalability. While ParamRepulsor is slower than ParamInfo-NC-t-SNE, the speed is still comparable in te...
-
[68]
Guidelines: • The answer NA means that the abstract and introduction do not include the claims made in the paper
Claims Question: Do the main claims made in the abstract and introduction accurately reflect the paper’s contributions and scope? Answer: [Yes] Justification: We provide detailed analysis and experimental results, both in main text as well as the appendix, to support the obser...
-
[69]
Limitations
Limitations Question: Does the paper discuss the limitations of the work performed by the authors? Answer: [Yes] Justification: We discussed limitation of our work in the discussion section and the appendix. Guidelines: • The answer NA means that the paper has no limitation wh...
-
[70]
Guidelines: • The answer NA means that the paper does not include theoretical results
Theory Assumptions and Proofs Question: For each theoretical result, does the paper provide the full set of assumptions and a complete (and correct) proof? 37 Answer: [Yes] Justification: Detailed proof is provided in the appendix. Guidelines: • The answer NA means that the pa...
-
[71]
Guidelines: • The answer NA means that the paper does not include experiments
Experimental Result Reproducibility Question: Does the paper fully disclose all the information needed to reproduce the main ex- perimental results of the paper to the extent that it affects the main claims and/or conclusions of the paper (regardless of whether the code and da...
-
[72]
Preprocessed datasets come from previously published work from others
Open access to data and code 38 Question: Does the paper provide open access to the data and code, with sufficient instruc- tions to faithfully reproduce the main experimental results, as described in supplemental material? Answer: [Yes] Justification: We provided our implemen...
-
[73]
Guidelines: • The answer NA means that the paper does not include experiments
Experimental Setting/Details Question: Does the paper specify all the training and test details (e.g., data splits, hyper- parameters, how they were chosen, type of optimizer, etc.) necessary to understand the results? Answer: [Yes] Justification: Experimental setting is discl...
-
[74]
Guidelines: • The answer NA means that the paper does not include experiments
Experiment Statistical Significance Question: Does the paper report error bars suitably and correctly defined or other appropriate information about the statistical significance of the experiments? Answer: [Yes] Justification: We conduct multiple rounds of experiments and perf...
-
[75]
Guidelines: • The answer NA means that the paper does not include experiments
Experiments Compute Resources Question: For each experiment, does the paper provide sufficient information on the com- puter resources (type of compute workers, memory, time of execution) needed to reproduce the experiments? Answer: [Yes] Justification: We provide compute reso...
-
[76]
Guidelines: • The answer NA means that the authors have not reviewed the NeurIPS Code of Ethics
Code Of Ethics Question: Does the research conducted in the paper conform, in every respect, with the NeurIPS Code of Ethics https://neurips.cc/public/EthicsGuidelines? Answer: [Yes] Justification: Experiments and research conducted conform with the NeurIPS code of ethics. Gui...
-
[77]
Guidelines: • The answer NA means that there is no societal impact of the work performed
Broader Impacts Question: Does the paper discuss both potential positive societal impacts and negative societal impacts of the work performed? Answer: [NA] Justification: There is no specific societal impact of the work. Guidelines: • The answer NA means that there is no socie...
-
[78]
Guidelines: • The answer NA means that the paper poses no such risks
Safeguards Question: Does the paper describe safeguards that have been put in place for responsible release of data or models that have a high risk for misuse (e.g., pretrained language models, image generators, or scraped datasets)? Answer: [NA] Justification: The paper does ...
-
[79]
Guidelines: • The answer NA means that the paper does not use existing assets
Licenses for existing assets Question: Are the creators or original owners of assets (e.g., code, data, models), used in the paper, properly credited and are the license and terms of use explicitly mentioned and properly respected? Answer: [Yes] Justification: Existing assets ...
-
[80]
Guidelines: • The answer NA means that the paper does not release new assets
New Assets Question: Are new assets introduced in the paper well documented and is the documentation provided alongside the assets? Answer: [Yes] Justification: New code comes with proper documentation. Guidelines: • The answer NA means that the paper does not release new asse...
-
[81]
Guidelines: • The answer NA means that the paper does not involve crowdsourcing nor research with human subjects
Crowdsourcing and Research with Human Subjects Question: For crowdsourcing experiments and research with human subjects, does the paper include the full text of instructions given to participants and screenshots, if applicable, as well as details about compensation (if any)? A...
-
[82]
Guidelines: • The answer NA means that the paper does not involve crowdsourcing nor research with human subjects
Institutional Review Board (IRB) Approvals or Equivalent for Research with Human Subjects Question: Does the paper describe potential risks incurred by study participants, whether such risks were disclosed to the subjects, and whether Institutional Review Board (IRB) approvals...
Reviewed August 12, 2026 · model on record in the stance chip above.
Discussion (0). Continue with ORCID to comment.