REVIEW 3 major objections 7 minor 1 cited by
Anomaly Detection and Radio-frequency Interference Classification with Unsupervised Learning in Narrowband Radio Technosignature Searches
T0 review · 3 major / 7 minor · reviewed 2026-08-12 · deepseek-v4-flash
Pith's one-line read This paper claims that an unsupervised clustering layer, GLOBULAR, can cut false-positive events in narrowband radio technosignature searches by 99.3% while retaining most injected synthetic signals.
desk verdict A genuine and transparent RFI-clustering pipeline whose headline event-reduction numbers are dominated by a trivial baseline; the hit-level enrichment is real, but the evaluation needs a no-seed control and a random-removal comparison. read the letter →
The pith
A machine-rendered reading of the paper's core claim, the machinery that carries it, and where it could break.
The reading
What carries the argument
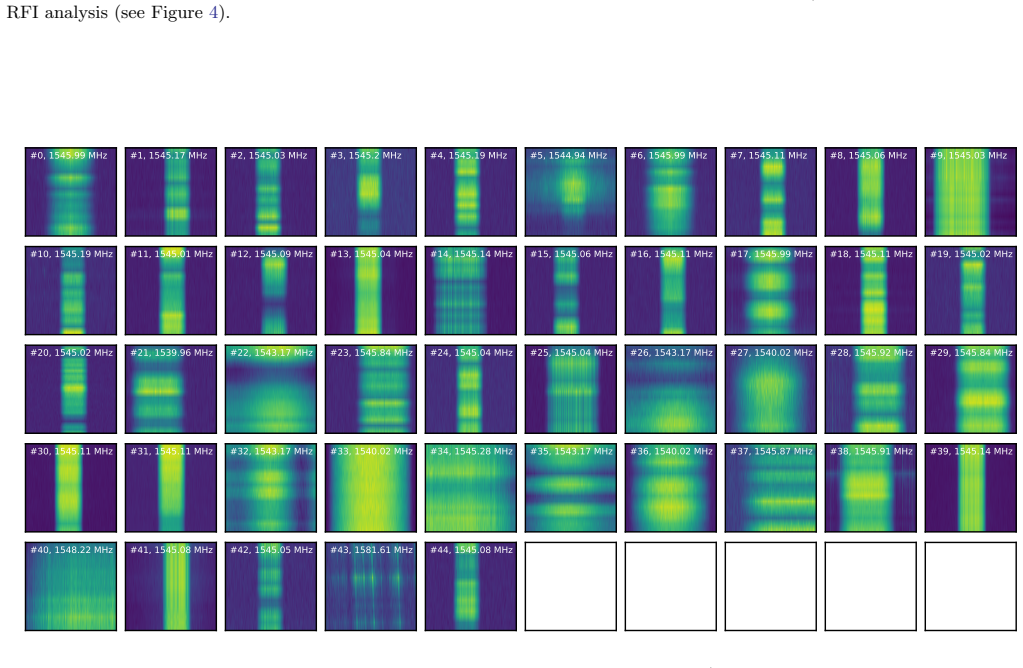
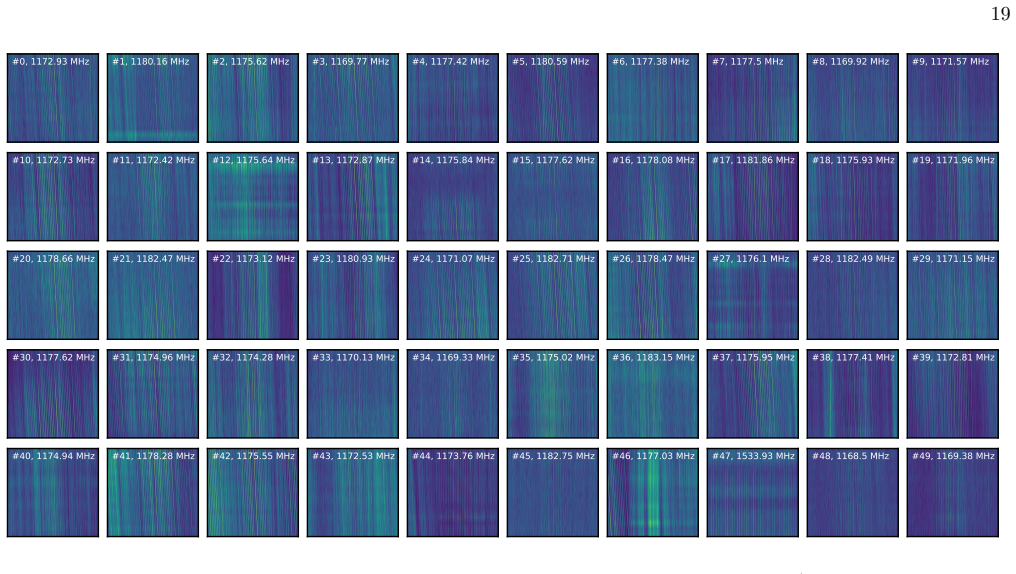
The load-bearing object is GLOBULAR, a pipeline built on HDBSCAN, a hierarchical density-based clustering algorithm that labels low-density points as noise. Hits are reduced to 13 statistical features (frequency, drift rate, SNR, spectral and temporal shape statistics, signal bandwidth, periodogram redness), then clustered in random batches of about 3,000 with the same 100 synthetic seed signals injected into every batch; pooling and re-clustering over eight epochs cuts the hit set by 93.1%. Cluster centroids are matched across batches using PCA followed by t-SNE and a final HDBSCAN pass, and the retained anomalies are passed through the standard FindEvent spatial filter that requires a signal to appear in on-target pointings but not off-target ones.
What would settle it
Run the same eight-epoch pipeline on the same data with the seed signals omitted, or with seeds of a different morphology (for example, broader bandwidths or different drift-rate signs), and compare the recovered injected-event count; if the false-positive reduction stays near 93% while the recovery rate collapses, the reported true-positive retention is carried by the seed design rather than by the clustering itself.
Extended reading notes
Core claim
GLOBULAR's central claim is that the false-positive burden of a standard narrowband technosignature pipeline can be reduced by treating detected hits as points in a hand-designed 13-dimensional feature space and clustering them with HDBSCAN after every batch. Because common RFI types form dense clusters while rare or genuinely anomalous signals fall outside them, iterative clustering for eight epochs isolates the anomalies; the surviving hits pass to the FindEvent spatial filter. On the L-band observations of 97 nearby galaxies, this removes 93.1% of the false-positive hits and cuts the false-positive event count from 288 to 2, while recovering 69 of 100 injected synthetic events compared with 86 recovered without the clustering stage. The paper further shows that the clusters correspond to recognizable RFI sources and reports one new event near the 21-cm line, suggesting the method can expose signals hidden by RFI occupancy.
Load-bearing premise
The load-bearing premise is that injecting 100 synthetic signals of exactly the target morphology into every batch fairly measures the method's ability to preserve real technosignatures; if the seeds simply teach the clusterer to keep anything shaped like them, the 69-of-100 recovery rate is partly an artifact of the test design.
Editorial extensions
If this is right
- Future large technosignature surveys can add GLOBULAR clustering before the spatial filter to cut manual follow-up from hundreds of events to a handful.
- RFI rejection becomes morphology-agnostic: common interference is identified purely by its prevalence, so new RFI types are grouped without retraining.
- Injecting different seed morphologies lets the same pipeline be tuned to preserve other signal classes, not just drifting narrowband lines.
- The method may recover events hidden by dense RFI: trimming RFI from on pointings exposed a new event near the 21-cm line that the standard pipeline did not find.
- The trade-off is a lower recovery of injected signals (69 vs 86 events), suggesting that additional signal-preservation work, such as refinements in the spatial filter, is needed before full deployment.
Reading between the lines
- Editorial inference: the true-positive comparison (69 vs 86) is best read as a test of the seed-preservation mechanism, not of anomaly detection in general; a real technosignature whose morphology differs from the seeds could be clustered away as RFI.
- Editorial inference: because the pipeline removes hits before the spatial filter, it should also be applicable to non-SETI radio surveys that need to reject human-generated interference, provided the feature space is re-tuned per instrument and band.
- Editorial inference: the single new event near the 21-cm line raises a testable prediction: in RFI-dense regions, FindEvent may systematically miss faint narrowband signals, and trimming RFI from on pointings should reveal more such events; a future study could map detection completeness against spectral occupancy before and after trimming.
- Editorial inference: the batching scheme turns quadratic HDBSCAN scaling into near-linear wall-clock behavior, so an all-sky survey with billions of hits appears computationally feasible, though the authors only demonstrate this on the 97-galaxy sample.
Editorial analysis
A structured set of objections, weighed in public.
Referee Report
Summary. GLOBULAR clustering applies HDBSCAN in an iterative batching scheme to turboSETI detections from Breakthrough Listen L-band observations of 97 galaxies, using a 13-dimensional hand-engineered feature space. Over eight epochs it removes clustered 'non-anomalous' hits, reducing the real-hit sample from 1,917,903 to 132,885 (93.1%) and the number of false-positive events found by the turboSETI FindEvent pipeline from 288 to 2 (99.3%). In an injection test on an M31 cadence, the pipeline recovers 264 of 296 synthetic hits and 69 of 100 synthetic events, compared with 86 events recovered by turboSETI alone. The authors additionally match RFI clusters across batches and report that one of the two surviving events is new relative to the Choza et al. (2024) search, which they interpret as evidence that GLOBULAR may reveal signals hidden by dense RFI.
Significance. If the central claims hold, the method would be practically valuable: reducing the false-positive event rate by two orders of magnitude would substantially ease manual follow-up in current and future SETI surveys, and the pipeline is designed to integrate with the widely used turboSETI framework. The paper has concrete strengths: it benchmarks against a published survey on public data, provides a code repository, defines the features and preprocessing in detail, shows manual inspection of representative clusters, and is transparent about the use of seed signals. However, the significance of the quantitative claims is currently limited by evaluation-design issues: the true-positive recovery is measured on the same morphology that the pipeline is explicitly instructed to keep through per-batch seed injection, and the false-positive event reduction is not compared with a trivial random-hit-removal baseline. Because both issues affect the headline numbers, the method's net benefit over simpler filtering is not yet established.
major comments (3)
- [§1.2, §3.1, Table 2] The true-positive recovery numbers (264 hits, 69 events) are confounded by construction because the recovery events and the per-batch seed signals are generated in the same way. Section 1.2 states that the 100 injected events have drift rates between -3 and +3 Hz/s and SNRs between 1,000 and 10,000, while Section 3.1 says that each batch receives an identical set of 100x13 features 'derived from 100 drifting narrowband signals synthesized with setigen' and that these are 'generated in the same way as, but are otherwise distinct from, the 100 events injected for recovery.' Section 3.1 further states that any non-synthetic signals placed in seeded clusters are retained for the next epoch. Thus the recovery events are exactly the morphology the pipeline has been instructed to keep, and the Table 2 comparison (69 vs. 86 events recovered) largely measures seed-template retention rather than the intrinsic ability of an unsupervised anomaly detector to preserve technosignature-like signals. I recommend rerunning GLOBULAR without seed injection and/or with a held-out test morphology (e.g., different drift range, bandwidth, or comb structure) and reporting the recovery rate under those conditions.
- [§5, Table 2] The headline event reduction from 288 to 2 is not benchmarked against a trivial baseline. Because an event requires hits in all three on-pointings, random removal of 93.1% of hits would leave roughly (0.069)^3 ≈ 3.3e-4 of the 288 events, i.e., about 0.1 events. A 99.3% event reduction is therefore approximately what any hit-removal filter would produce if event survival is dominated by the presence of three surviving hits. The meaningful claim is that GLOBULAR achieves this reduction while retaining true positives at a much higher rate than random filtering, but that retention is currently established only through the seeded-morphology test described in Major Comment 1. Please add a random-hit-removal baseline at the same 93.1% hit-reduction level and report both false-positive events and true-positive events under that baseline, so the reader can separate the effect of hit removal from the effect of the learned clustering.
- [§4, §5] The feature set and HDBSCAN hyperparameters are tuned on the same M31 observation that is later used for the large-scale true-positive injection test. Section 4 says the feature space was developed on a 3,068-hit toy data set from M31 and that the toy-model injections were 'generated using the same parameters as the 100 events for the large-scale model'; Section 5 then measures recovery on the M31 cadence. This creates a risk of overfitting the reported 69-of-100 recovery to one RFI environment and one signal recipe. If the method is intended to generalize to other targets, the recovery test should be performed on at least one cadence not used in any tuning step, or with a proper train/validation split.
minor comments (7)
- [Abstract vs. §1] The abstract expands GLOBULAR as 'Grouping Low-frequency Observations By Unsupervised Learning After Reduction' while Section 1 uses 'After Rejection'; please make the expansion consistent.
- [§1.2] There is a typo, 'to be an good example', which should read 'to be a good example'; likewise, 'theturboSETI values' should read 'the turboSETI values'.
- [§3.1, Figure 2] The text says each batch receives 'an identical set of 100x13 features', while Figure 2 labels this step 'add 100 synthetic hits per batch'; please align the wording because the seeds are feature vectors, not detected hits.
- [§2, Feature #8] The treatment of turning-point bandwidths that exceed 100 kHz by setting them to the boundary value could create artificial density at the edge of the feature range; please quantify how many hits are affected and whether the clustering results are sensitive to this censoring.
- [§3.2] The cross-batch cluster matching is evaluated only by visual inspection of a 10,000-centroid sample; a quantitative stability measure (e.g., cluster-matching reproducibility across bootstrap samples of centroids) would make the matching step more convincing.
- [§5] The new event near the 21-cm line is a false positive and is not a compelling technosignature candidate, as the text itself acknowledges; the later statement that this 'suggests that GLOBULAR clustering may be able to help the turboSETI algorithm find some of the true-positive events it previously missed' goes beyond what a single non-detection can support and should be softened.
- [Table 2] The recovery counts 69 vs. 86 are presented without uncertainty estimates; reporting a binomial confidence interval or a simple significance test would help the reader judge whether the 19.8% event-recovery loss is statistically meaningful.
Circularity Check
The claimed true-positive event recovery (69/100) is seeded by construction: the per-batch keeper seeds and the recovery events share the same setigen generation recipe, so the headline TP retention measures template matching rather than independent unsupervised detection.
-
self definitional
[Section 3.1 (Batching and Epochal Iteration), with results in Section 5 and Table 2]
"To each batch, we inject an identical set of 100×13 features derived from 100 drifting narrowband signals synthesized with setigen. These signals are generated in the same way as, but are otherwise distinct from, the 100 events injected for recovery; the purpose of these is to “seed” clusters with morphologies we want to keep."
The true-positive benchmark is not an independent probe of the algorithm's intrinsic ability: the 100 recovery events (Section 1.2: drift rates between −3 and 3 Hz/s, SNRs between 1,000 and 10,000) are generated with the same setigen recipe as the 100 seed signals injected into every batch. Since Section 3.1 states that non-synthetic signals placed in seeded clusters are retained 'as though they were outliers,' the recovery events are by construction placed in the keep-class. The reported 69/100 event recovery and the 19.8% loss relative to turboSETI alone therefore largely quantify template retention for a pre-specified morphology, not unsupervised detection of unknown technosignature shapes; a real signal outside the seed family could be discarded as RFI.
-
fitted input called prediction
[Section 4 (Application to Small Data Sets) and Section 1.2 (Data Sample)]
"The 187.5-MHz M 31 observation used to test the toy model was a portion of the 800-MHz M 31 observation to which we later injected 100 synthetic events for large-scale retrieval testing (Section 1.2), and the 3 injections made for the toy model were generated using the same parameters as the 100 events for the large-scale model."
The feature list and HDBSCAN hyperparameters (npts, ρpts, ϵm) were selected by iterative experimentation on the M31 toy data set, and the toy injections used the same generation parameters as the large-scale test events. The 100-event recovery benchmark is then run on the same M31 cadence that contains the toy subset used for tuning. This makes the reported true-positive rate a tuned, in-sample result rather than an out-of-sample prediction; the quantitative TP comparison with turboSETI alone is optimistically biased by this overlap.
full rationale
The paper is transparent about its machinery and its benchmark; the Choza et al. (2024) baseline is a published external pipeline result, and the 93.1% hit / 99.3% event false-positive reductions are real outputs of running HDBSCAN on the reduced hit set, not derivable from the seeds alone. The central circularity is confined to the true-positive validation: the paper's own Section 3.1 states that the 100 per-batch seed features are 'generated in the same way as' the 100 recovery events, and that non-synthetic hits in seeded clusters are retained 'as though they were outliers.' This makes the 69/100 event recovery and the 19.8% relative loss a measure of how well the pipeline keeps the seeded morphology, not of its intrinsic ability to preserve diverse technosignature-like signals. The additional M31 toy-tuning/test overlap (Section 4) further reduces the independence of the TP estimate. These are evaluation-design weaknesses that the authors disclose — the paper explicitly notes that 'The signal recovery rate is aided by our use of seed signals' — but they are load-bearing because the paper's headline trade-off (large FP reduction at modest TP cost) depends on the seeded TP number. Score 6: one quantitative prediction (TP event recovery) reduces by construction to template retention, while the FP-reduction claim retains independent content.
Assumptions & free parameters
free parameters (7)
- HDBSCAN minimum cluster size (npts) =
4
- HDBSCAN neighborhood points (rho_pts) =
2
- HDBSCAN merging threshold (epsilon_m) =
0.18
- Number of epochs =
8
- Seed signal set =
100 drifting narrowband synthetic signals per batch
- t-SNE perplexity and early exaggeration =
perplexity 40, early exaggeration 4
- Feature preprocessing choices =
quantile transforms, log scales, normalization ranges, 2.7 kHz window, 200 Hz to 100 kHz grid, 100 kHz cap
assumptions (5)
- domain assumption HDBSCAN cluster labels meaningfully separate RFI morphologies in the 13-dimensional feature space.
- domain assumption The 13 handcrafted features are sufficient to characterize the structures that distinguish RFI from technosignature candidates.
- domain assumption Setigen-generated synthetic signals are a valid proxy for real technosignatures.
- domain assumption The turboSETI pipeline's hit/event definitions and the ABACAD spatial filter are accepted as the standard baseline.
- domain assumption The distribution of RFI morphologies is similar across all 97 galaxies in the sample.
Cite this review
Pith. "Pith review of Anomaly Detection and Radio-frequency Interference Classification with Unsupervised Learning in Narrowband Radio Technosignature Searches." pith.science (2026). https://pith.science/paper/BOJWWPRZ
@misc{pith2026241116556,
  author       = {Pith},
  title        = {Pith review of: Anomaly Detection and Radio-frequency Interference Classification with Unsupervised Learning in Narrowband Radio Technosignature Searches},
  year         = {2026},
  howpublished = {\url{https://pith.science/paper/BOJWWPRZ}},
  note         = {Machine review of arXiv:2411.16556}
}
read the original abstract
The search for radio technosignatures is an anomaly detection problem: Candidate signals represent needles of interest in the proverbial haystack of radio-frequency interference (RFI). Current search frameworks find an enormity of false-positive signals, especially in large surveys, requiring manual follow-up to a sometimes prohibitive degree. Unsupervised learning provides an algorithmic way to winnow the most anomalous signals from the chaff, as well as group together RFI signals that bear morphological similarities. We present GLOBULAR (Grouping Low-frequency Observations By Unsupervised Learning After Reduction) clustering, a signal processing method that uses HDBSCAN to reduce the false-positive rate and isolate outlier signals for further analysis. When combined with a standard narrowband signal detection and spatial filtering pipeline, such as turboSETI, GLOBULAR clustering offers significant improvements in the false-positive rate over the standard pipeline alone, suggesting dramatic potential for the amelioration of manual follow-up requirements for future large surveys. By removing RFI signals in regions of high spectral occupancy, GLOBULAR clustering may also enable the detection of signals missed by the standard pipeline. We benchmark our method against the Choza et al. turboSETI-only search of 97 nearby galaxies at the L band, demonstrating a false-positive hit reduction rate of 93.1% and a false-positive event reduction rate of 99.3%.
Figures


Figures from the paper (10 more)



Forward citations
Cited by 1 Pith paper
-
Machine Learning and the SKA for Cosmic Dawn and the Epoch of Reionization
A multi-author overview of machine-learning algorithms proposed for instrument modelling, data analysis, simulation and inference in SKA Cosmic Dawn and Epoch of Reionization science.
Reference graph
Works this paper leans on
-
[1]
f(m0ntbE 3Wcdl *> ,^Jx /!i 3Vď'[ ̲VCIycF *U`
thebibliography [1] 20pt to REFERENCES 6pt =0pt -12pt 10pt plus 3pt =0pt =0pt =1pt plus 1pt =0pt =0pt -12pt =13pt plus 1pt =20pt =13pt plus 1pt \@M =10000 =-1.0em =0pt =0pt 0pt =0pt =1.0em @enumiv\@empty 10000 10000 `\.\@m \@noitemerr \@latex@warning Empty `thebibliography' environment \@ifnextchar \@reference \@latexerr Missing key on reference command E...
-
[2]
2024, arXiv e-prints, arXiv:2410.01034, 10.48550/arXiv.2410.01034
Andersson , A., Lintott , C., Fender , R., et al. 2024, arXiv e-prints, arXiv:2410.01034, 10.48550/arXiv.2410.01034
-
[3]
Astropy Collaboration , Robitaille , T. P., Tollerud , E. J., et al. 2013, , 558, A33, 10.1051/0004-6361/201322068
-
[4]
Astropy Collaboration , Price-Whelan , A. M., Sip o cz , B. M., et al. 2018, , 156, 123, 10.3847/1538-3881/aabc4f
-
[5]
Astropy Collaboration , Price-Whelan , A. M., Lim , P. L., et al. 2022, , 935, 167, 10.3847/1538-4357/ac7c74
-
[6]
Biswas , B., Ishida , E. E. O., Peloton , J., et al. 2023, , 677, A77, 10.1051/0004-6361/202245340
-
[7]
2001, Machine Learning, 45, 5, 10.1023/A:1010933404324
Breiman , L. 2001, Machine Learning, 45, 5, 10.1023/A:1010933404324
-
[8]
Brzycki, B., Siemion, A. P. V., de Pater, I., et al. 2023, The Astrophysical Journal, 952, 46, 10.3847/1538-4357/acdee0
Show all 73 references
-
[9]
2022, The Astronomical Journal, 163, 222, 10.3847/1538-3881/ac5e3d
---. 2022, The Astronomical Journal, 163, 222, 10.3847/1538-3881/ac5e3d
2022 doi
-
[10]
Brzycki , B., Siemion , A. P. V., de Pater , I., et al. 2024, , 168, 284, 10.3847/1538-3881/ad7e18
2024 doi
-
[11]
Campello, R. J. G. B., Moulavi, D., & Sander, J. 2013, in Advances in Knowledge Discovery and Data Mining, ed. J. Pei, V. S. Tseng, L. Cao, H. Motoda, & G. Xu (Berlin, Heidelberg: Springer Berlin Heidelberg), 160--172
2013
-
[12]
2024, , 167, 10, 10.3847/1538-3881/acf576
Choza , C., Bautista , D., Croft , S., et al. 2024, , 167, 10, 10.3847/1538-3881/acf576
2024 doi
-
[13]
1959, Nature, 184, 844, 10.1038/184844a0
Cocconi , G., & Morrison , P. 1959, Nature, 184, 844, 10.1038/184844a0
1959 doi
-
[14]
2013, Python and HDF5 (O'Reilly)
Collette, A. 2013, Python and HDF5 (O'Reilly)
2013
-
[15]
A., Syed, T
dos Santos, J. A., Syed, T. I., Naldi, M. C., Campello, R. J. G. B., & Sander, J. 2019, IEEE Transactions on Big Data, PP, 1, 10.1109/TBDATA.2019.2907624
2019
-
[16]
1961, Physics Today, 14, 40, https://doi.org/10.1063/1.3057500
Drake, F. 1961, Physics Today, 14, 40, https://doi.org/10.1063/1.3057500
1961 doi
-
[17]
2019, turboSETI: Python-based SETI search algorithm
Enriquez , E., & Price , D. 2019, turboSETI: Python-based SETI search algorithm . 1906.006
2019
-
[18]
E., Siemion , A., Foster , G., et al
Enriquez , J. E., Siemion , A., Foster , G., et al. 2017, , 849, 104, 10.3847/1538-4357/aa8d1b
2017 doi
-
[19]
1996, in Proceedings of the Second International Conference on Knowledge Discovery and Data Mining, KDD'96 (AAAI Press), 226–231
Ester, M., Kriegel, H.-P., Sander, J., & Xu, X. 1996, in Proceedings of the Second International Conference on Knowledge Discovery and Data Mining, KDD'96 (AAAI Press), 226–231
1996
-
[20]
2024, , 529, 732, 10.1093/mnras/stae496
Etsebeth , V., Lochner , M., Walmsley , M., & Grespan , M. 2024, , 529, 732, 10.1093/mnras/stae496
2024 doi
-
[21]
Franz, N., Croft, S., Siemion, A. P. V., et al. 2022, The Astronomical Journal, 163, 104, 10.3847/1538-3881/ac46c9
2022 doi
-
[22]
I., Siemion , A
Gajjar , V., Perez , K. I., Siemion , A. P. V., et al. 2021, , 162, 33, 10.3847/1538-3881/abfd36
2021 doi
-
[23]
2022, , 932, 81, 10.3847/1538-4357/ac6dd5
Gajjar , V., LeDuc , D., Chen , J., et al. 2022, , 932, 81, 10.3847/1538-4357/ac6dd5
2022 doi
-
[24]
C., Fabbro , S., et al
Gilda , S., Draper , S. C., Fabbro , S., et al. 2022, , 510, 870, 10.1093/mnras/stab3243
2022 doi
-
[25]
R., Millman, K
Harris, C. R., Millman, K. J., van der Walt, S. J., et al. 2020, Nature, 585, 357, 10.1038/s41586-020-2649-2
2020 doi
-
[26]
A., & Hartigan, P
Hartigan, J. A., & Hartigan, P. M. 1985, The Annals of Statistics, 13, 70 , 10.1214/aos/1176346577
1985
-
[27]
Hunter, J. D. 2007, Computing in Science & Engineering, 9, 90, 10.1109/MCSE.2007.55
2007 doi
-
[28]
Isaacson, H., Siemion, A. P. V., Marcy, G. W., et al. 2017, Publications of the Astronomical Society of the Pacific, 129, 1. https://www.jstor.org/stable/26660103
2017
-
[29]
N., & Gill, C
Joanes, D. N., & Gill, C. A. 1998, Journal of the Royal Statistical Society. Series D (The Statistician), 47, 183. http://www.jstor.org/stable/2988433
1998
-
[30]
2007, Journal of Modern Applied Statistical Methods, 6, 8, 10.22237/jmasm/1177992120
Knapp, T. 2007, Journal of Modern Applied Statistical Methods, 6, 8, 10.22237/jmasm/1177992120
2007
-
[31]
Lebofsky , M., Croft , S., Siemion , A. P. V., et al. 2019, , 131, 124505, 10.1088/1538-3873/ab3e82
2019 doi
-
[32]
S., & Ip , W.-H
Lin , C.-L., Apai , D., Giampapa , M. S., & Ip , W.-H. 2024, , 168, 234, 10.3847/1538-3881/ad7956
2024 doi
-
[33]
T., Ting, K
Liu, F. T., Ting, K. M., & Zhou, Z.-H. 2008, in 2008 Eighth IEEE International Conference on Data Mining, 413--422, 10.1109/ICDM.2008.17
2008 doi
-
[34]
Lochner , M., & Bassett , B. A. 2021, Astronomy and Computing, 36, 100481, 10.1016/j.ascom.2021.100481
2021
-
[35]
Lomb , N. R. 1976, , 39, 447, 10.1007/BF00648343
1976 doi
- [36]
-
[37]
X., Ng, C., Rizk, L., et al
Ma, P. X., Ng, C., Rizk, L., et al. 2023, Nature Astronomy, 10.1038/s41550-022-01872-z
2023 doi
- [38]
-
[39]
2021, Statistical Analysis and Data Mining: An ASA Data Science Journal, 14, 144, https://doi.org/10.1002/sam.11498
Mantero, A., & Ishwaran, H. 2021, Statistical Analysis and Data Mining: An ASA Data Science Journal, 14, 144, https://doi.org/10.1002/sam.11498
2021 doi
-
[40]
2021, The Astronomical Journal, 161, 55, 10.3847/1538-3881/abcc77
Margot, J.-L., Pinchuk, P., Geil, R., et al. 2021, The Astronomical Journal, 161, 55, 10.3847/1538-3881/abcc77
2021 doi
-
[41]
T., Matcheva , K., & Roman , A
Matchev , K. T., Matcheva , K., & Roman , A. 2022, , 3, 205, 10.3847/PSJ/ac880b
2022 doi
-
[42]
2017, in 2017 IEEE International Conference on Data Mining Workshops (ICDMW) (IEEE), 10.1109/icdmw.2017.12
McInnes, L., & Healy, J. 2017, in 2017 IEEE International Conference on Data Mining Workshops (ICDMW) (IEEE), 10.1109/icdmw.2017.12
2017 doi
-
[43]
2017, The Journal of Open Source Software, 2, 10.21105/joss.00205
McInnes, L., Healy, J., & Astels, S. 2017, The Journal of Open Source Software, 2, 10.21105/joss.00205
2017 doi
-
[44]
2010, in P roceedings of the 9th P ython in S cience C onference, ed
M c K inney, W. 2010, in P roceedings of the 9th P ython in S cience C onference, ed. S t\'efan van der W alt & J arrod M illman, 56 -- 61, 10.25080/Majora-92bf1922-00a
2010 doi
-
[45]
J., Iacobelli , M., et al
Mesarcik , M., Boonstra , A. J., Iacobelli , M., et al. 2023, , 680, A74, 10.1051/0004-6361/202347182
2023 doi
-
[46]
Mesarcik , M., Boonstra , A.-J., Ranguelova , E., & van Nieuwpoort , R. V. 2022, , 516, 5367, 10.1093/mnras/stac2503
2022 doi
-
[47]
Neto, A. C. A., Naldi, M. C., Campello, R. J. G. B., & Sander, J. 2022, in 2022 IEEE 38th International Conference on Data Engineering (ICDE), 951--964, 10.1109/ICDE53745.2022.00076
2022
-
[48]
Neto, A. C. A., Nascimento, M. A., Sander, J., & Campello, R. J. G. B. 2018, Proc. VLDB Endow., 11, 2058–2061, 10.14778/3229863.3236259
2018
-
[49]
R., de Bruyn , A
Offringa , A. R., de Bruyn , A. G., Biehl , M., et al. 2010, , 405, 155, 10.1111/j.1365-2966.2010.16471.x
2010
-
[50]
R., van de Gronde , J
Offringa , A. R., van de Gronde , J. J., & Roerdink , J. B. T. M. 2012, , 539, A95, 10.1051/0004-6361/201118497
2012 doi
-
[51]
2024, , in prep.\
Painter , C., et al. 2024, , in prep.\
2024
-
[52]
2011, Journal of Machine Learning Research, 12, 2825
Pedregosa, F., Varoquaux, G., Gramfort, A., et al. 2011, Journal of Machine Learning Research, 12, 2825
2011
-
[53]
A., Janczyk, M., Dale, R., & Freeman, J
Pfister, R., Schwarz, K. A., Janczyk, M., Dale, R., & Freeman, J. B. 2013, Frontiers in Psychology, 4, 1, 10.3389/fpsyg.2013.00700
2013
-
[54]
2022, , 163, 76, 10.3847/1538-3881/ac426f
Pinchuk , P., & Margot , J.-L. 2022, , 163, 76, 10.3847/1538-3881/ac426f
2022 doi
-
[55]
C., Enriquez, J
Price, D. C., Enriquez, J. E., Chen, Y., & Siebert, M. 2019, Journal of Open Source Software, 4, 1554, 10.21105/joss.01554
2019 doi
-
[56]
C., Enriquez, J
Price, D. C., Enriquez, J. E., Brzycki, B., et al. 2020, The Astronomical Journal, 159, 86, 10.3847/1538-3881/ab65f1
2020 doi
-
[57]
A., Forsyth , C., Aruliah , A., et al
Reddy , S. A., Forsyth , C., Aruliah , A., et al. 2023, Journal of Geophysical Research (Space Physics), 128, e2022JA031183, 10.1029/2022JA031183
2023 doi
-
[58]
Scargle , J. D. 1982, , 263, 835, 10.1086/160554
1982 doi
-
[59]
Shapley, L. S. 1951, Notes on the N-Person Game --- II: The Value of an N-Person Game (Santa Monica, CA: RAND Corporation), 10.7249/RM0670
1951 doi
-
[60]
Siemion, A. P. V., Demorest, P., Korpela, E., et al. 2013, The Astrophysical Journal, 767, 94
2013
-
[61]
A., et al
Sooknunan , K., Lochner , M., Bassett , B. A., et al. 2021, , 502, 206, 10.1093/mnras/staa3873
2021 doi
-
[62]
K., et al
Suazo , M., Zackrisson , E., Mahto , P. K., et al. 2024, , 531, 695, 10.1093/mnras/stae1186
2024 doi
-
[63]
2023, , 165, 255, 10.3847/1538-3881/acccf0
Suresh , A., Gajjar , V., Nagarajan , P., et al. 2023, , 165, 255, 10.3847/1538-3881/acccf0
2023 doi
-
[64]
2022, Mathematics, 10, 10.3390/math10071042
Tarb a , N., Voncil a , M.-L., & Boiangiu, C.-A. 2022, Mathematics, 10, 10.3390/math10071042
2022 doi
-
[65]
2021, , 161, 286, 10.3847/1538-3881/abf649
Traas , R., Croft , S., Gajjar , V., et al. 2021, , 161, 286, 10.3847/1538-3881/abf649
2021 doi
-
[66]
J., Ivezi\'c, Z ., & Gray, A
VanderPlas, J., Connolly, A. J., Ivezi\'c, Z ., & Gray, A. 2012, in 2012 Conference on Intelligent Data Understanding (IEEE), 47–54, 10.1109/cidu.2012.6382200
2012
-
[67]
T., & Ivezi\'c, Z
VanderPlas, J. T., & Ivezi\'c, Z . 2015, The Astrophysical Journal, 812, 18, 10.1088/0004-637x/812/1/18
2015 doi
-
[68]
E., et al
Virtanen, P., Gommers, R., Oliphant, T. E., et al. 2020, Nature Methods, 17, 261, 10.1038/s41592-019-0686-2
2020 doi
-
[69]
2016, Distill, 10.23915/distill.00002
Wattenberg, M., Vi \' e gas, F., & Johnson, I. 2016, Distill, 10.23915/distill.00002
2016 doi
-
[70]
2025, in prep.\
West , N., et al. 2025, in prep.\
2025
-
[71]
P., Drew, J., Siemion, A., et al
Worden, S. P., Drew, J., Siemion, A., et al. 2017, Acta Astronautica, 139, 98, 10.1016/j.actaastro.2017.06.008
2017 doi
-
[72]
T., Griffith , R
Wright , J. T., Griffith , R. L., Sigurdsson , S., Povich , M. S., & Mullan , B. 2014, , 792, 27, 10.1088/0004-637X/792/1/27
2014 doi
-
[73]
2023, , 165, 114, 10.3847/1538-3881/acb342
Zuckerman , A., Ko , Z., Isaacson , H., et al. 2023, , 165, 114, 10.3847/1538-3881/acb342
2023 doi
Reviewed August 12, 2026 · model on record in the stance chip above.
Discussion (0). Continue with ORCID to comment.