REVIEW 4 major objections 5 minor 1 cited by
CMAViT: Integrating Climate, Managment, and Remote Sensing Data for Crop Yield Estimation with Multimodel Vision Transformers
T0 review · 4 major / 5 minor · reviewed 2026-08-12 · deepseek-v4-flash
Pith's one-line read The paper claims CMAViT, a multimodal vision transformer fusing Sentinel-1/2 imagery, weekly climate data, and text-encoded management practices, predicts vineyard yield at R²=0.84 and 8.22% MAPE on held-out blocks, outperforming…
desk verdict A solid multimodal fusion paper for vineyard yield prediction whose headline numbers overstate temporal generalization; worth reviewing, but needs a year-holdout and more careful comparisons. read the letter →
The pith
A machine-rendered reading of the paper's core claim, the machinery that carries it, and where it could break.
The reading
What carries the argument
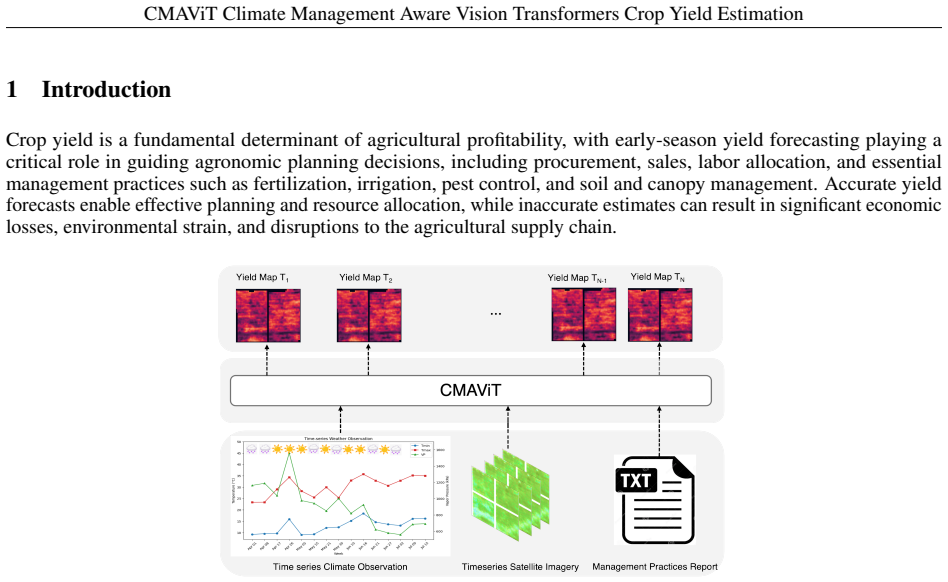
The load-bearing mechanism is a cross-attention fusion between two encoders: a spatio-temporal module (STMM) that adds meteorological attention to vision-transformer patch embeddings of Sentinel-1/2 time series, and a vanilla self-attention encoder that turns tokenized management-practice text into context vectors. Cross-attention lets the management context query the spatio-temporal features at each of fifteen weekly steps from bud break to veraison, so the text influences predictions only where it is relevant. A second, training-only mechanism, the YieldZone strategy, bins ground-truth yield into classes and element-wise multiplies the zone map with input imagery to focus learning on low and high extremes.
What would settle it
Train CMAViT on blocks from 2016-2018 and test only on 2019 blocks; if R² drops well below 0.84 or MAPE rises well above 8%, the 'unseen' generalization claim is weakened. A complementary check compares the model's 2019 predictions against that year's actual weather anomalies to see whether it tracks them or merely reproduces the average of training years.
Extended reading notes
Core claim
The central claim is that management practices, written as free text, add predictive value for crop yield beyond what satellite imagery and weather can provide, and that a transformer with cross-attention is the right machinery to capture that value. On a block-holdout evaluation over 41 blocks and eight cultivars, CMAViT reaches R²=0.84 and MAPE=8.22%, beating the UNet-ConvLSTM baseline, whose best comparable configuration gives R²=0.78 and MAPE=12.37%. The full model also improves extreme-yield estimates, and a training-time YieldZone strategy that bins yield into low/common/high classes and multiplies the zone map into the input lowers MAPE further, to 4.45%.
Load-bearing premise
The results assume that blocks held out from training are truly unseen, even though they come from the same four growing seasons as the training blocks; if a model has implicitly memorized season-level weather or phenology patterns, the reported test accuracy may overstate how well it would do on a brand-new year or region.
Editorial extensions
If this is right
- If correct, wineries can generate field-level yield maps weekly from April to mid-July, improving harvest logistics and crop-load management decisions.
- The ablations imply each modality earns its place: removing management text costs about 0.07 in R² and 1.7 percentage points in MAPE, while removing climate costs about 0.10 in R² and 2.5 percentage points in MAPE.
- The design opens the door to incorporating other unstructured agronomic records, such as soil reports or pest scouting notes, as text without hand-engineering categorical features.
- The YieldZone training strategy reduces extreme-value error (MAPE below 10% for both low and high extremes) relative to plain regression, suggesting similar binned training could help other imbalanced yield datasets.
- Because CMAViT is agnostic to data structure, the same architecture could be applied to other crops that have time-series satellite imagery and management text.
Reading between the lines
- The block-holdout setup shares growing seasons between training and test blocks, so a stronger test would withhold entire years; we suspect error would rise on years with unusual weather.
- Management text likely proxies for cultivar, trellis, spacing, and soil variables that also affect the imagery itself, and cross-attention may be learning interactions that a simpler concatenation would miss; this is testable by comparing fusion designs.
- Since DayMet climate is at 1 km resolution and each field receives a single value, the model likely underuses within-field weather variation; feeding higher-resolution or interpolated weather could reveal additional gains.
- YieldZone multiplication happens only during training, so inference runs a single forward pass; that makes the accuracy gain nearly free at deployment, but the zone map must be recomputed whenever the model is retrained on new yield distributions.
Editorial analysis
A structured set of objections, weighed in public.
Referee Report
Summary. This paper proposes CMAViT, a multimodal vision transformer for pixel-level vineyard yield prediction. It fuses time-series Sentinel-1 and Sentinel-2 imagery, weekly DayMet climate variables, and text-encoded soil/management information through a cross-attention encoder, and reports R²=0.84 and MAPE=8.22% on a block-holdout test set from a large (2,200 ha, over 5 million vines) 2016–2019 dataset. The paper also presents modality-maskout ablations showing that each input type contributes to accuracy, and, with the YieldZone/CSR training strategies, reports further improvements for extreme yield ranges.
Significance. The dataset and the multimodal design are valuable assets: the study uses an unusually large ground-truth yield dataset, releases code, and tests on held-out blocks with an ablation that supports the contribution of each modality. If the reported generalization held, CMAViT would be a practically useful tool for early-season vineyard yield forecasting. However, the current evidence is weakened by the absence of a temporal holdout, by unmatched baseline comparisons in the headline numbers, and by reliance on unpublished training strategies, so the strength of the central claim is not yet established.
major comments (4)
- [Section 4.2, Figure 5] The block-holdout (BHO) validation splits blocks, not years: training, validation, and test blocks are drawn from the same 2016–2019 seasons. Because all blocks in a given year share the same regional weather, phenology, and disease-pressure conditions, year-specific signals present in training blocks can also appear in test blocks, so the reported test R²=0.84 and MAPE=8.22% do not necessarily measure generalization to unseen future seasons—the practical setting the paper targets. Please add a leave-one-year-out or block-year split and report the same metrics, or explicitly rephrase the 'unseen dataset' claim as spatial-only novelty.
- [Section 5, Conclusion] The headline comparison ('improving the R² score from 0.78 to 0.84 and reducing MAPE from 12.57% to 8.22%') mixes incompatible baselines from Table 1: 0.78 is UNet-ConvLSTM [B] (S2+management+CSR), 12.57% is UNet-ConvLSTM [C] (S1+S2+management), while 0.84 and 8.22% are CMAViT [E] (full inputs + CSR). This conflates architecture gains with input-modality gains; report a matched-input comparison (e.g., CMAViT [C] vs UNet-ConvLSTM [C], and CMAViT [E] vs UNet-ConvLSTM with the same inputs) and state what each comparison is designed to isolate.
- [Section 4.4.1, Tables 1–3] All metrics are single-run point estimates. With only 41 blocks (and in Figure 5 as few as one test block per cultivar), differences such as CMAViT [C] R²=0.74 vs UNet-ConvLSTM [C] R²=0.71 may be within run-to-run or sampling variation. Please report the mean and standard deviation across multiple random seeds (or block splits) and, for the reported extreme-range metrics, bootstrap confidence intervals.
- [Section 4.4.1, Algorithm 1 and YieldZone reference] The YieldZone and CSR methods are attributed to an unpublished SSRN preprint ([Kamangir et al.]) and are not fully specified here. Algorithm 1 multiplies training images by a 'Yield Zone Map' derived from yield labels, but the class boundaries, the number of classes, and the ExtremeWeight scheme are not defined, and it is unclear whether the mask is computed from the same year's ground-truth yields as the target. This prevents reproduction of the strong YZ results (test R²=0.96, MAPE=4.51% for UNet-ConvLSTM-YZ) and raises a potential target-leakage question that should be clarified.
minor comments (5)
- [Section 3 vs Section 4.3] The model description in Section 3 states a six-channel image input (RGB+NIR from Sentinel-2 and VV+VH from Sentinel-1), while Section 4.3 adds '1 for time as an encoded day of the year' as an additional channel, giving seven channels; please reconcile.
- [Section 4.4.4] The MoA-04 case-study metrics (week-1 MAE 1.11 t/ha, MAPE 3.23%) are far better than the overall test metrics for configuration [E] (MAE 2.77 t/ha, MAPE 8.22%); clarify whether this block is representative or the case study uses a different evaluation set.
- [Section 2.1] The description of UNet-ConvLSTM says it uses 'solely Sentinel-2 imagery' yet also incorporates cultivar, trellis, spacing, and canopy-management variables; this contradiction should be fixed.
- [References] The reference list is duplicated in full, and the OpenAI GPT-3.5 tokenizer entry contains the placeholder 'Accessed: Month, Year'; please clean these up.
- [Section 4.1.4] DayMet climate variables are assigned as a single value per field per date despite the 1 km grid cell possibly containing only part of a field; state whether any downscaling or interpolation was used.
Circularity Check
No significant circularity: the reported predictions are evaluated on spatially held-out blocks and no target-derived quantity is used at inference.
full rationale
CMAViT is an empirical deep-learning study, not a derivation. The central result (R2=0.84, MAPE=8.22%, Table 1) is obtained on a block-holdout test set: Section 4.2 states that the BHO scenario 'evaluates the model's ability to predict yields for blocks that were not part of the training set,' and Figure 5 shows distinct training, validation, and test blocks. The attention equations (Eqs. 1-5) combine satellite, climate, and text features; there is no equation in which a predicted yield is defined as an input, and no fitted parameter is renamed as a prediction. The maskout analysis in Table 3 is an ablation, not a fitted-input prediction, and it supports the modality-contribution claim. The YieldZone and CSR components are self-cited (Kamangir et al., SSRN 4893816), but Algorithm 1 specifies the procedure within this paper, it is applied symmetrically to both UNet-ConvLSTM and CMAViT, and Phase 2 states that 'the model input is solely the input image'; no ground-truth yield zone is provided at inference, so the reported improvement is not circular by construction. The shared-year structure of the BHO split is a legitimate generalization-risk concern, but it concerns whether the test set measures temporal generalization, not whether the reported numbers reduce to the training inputs; it is therefore a validation-design issue rather than circularity. The self-citations to the authors' prior UNet-ConvLSTM and YieldZone work are present but are not load-bearing reductions: the comparisons are implemented and evaluated in this paper, so the central claims retain independent empirical content.
Assumptions & free parameters
free parameters (4)
- YieldZone class thresholds =
LER below 22, CR 22-54, HER above 54 t/ha
- CSR and ExtremeWeight settings =
not reported
- Data curation thresholds =
cultivars with fewer than 2 blocks or fewer than 3 years removed; cloud cover under 10%
- Model architecture hyperparameters =
16x16 patches, 15 time steps, embedding 768, 8 heads, 6 layers, dropout 0.3, learning rate 1e-4
assumptions (6)
- standard math Standard scaled dot-product attention and transformer building blocks are valid for spatio-temporal regression.
- domain assumption Block-holdout splitting isolates generalization to new blocks.
- domain assumption DayMet 1-km weather assigned as a single value per field is representative of field-level climate.
- domain assumption Text reports on soil and management practices, tokenized with GPT-3.5 and encoded by self-attention, capture yield-relevant management information.
- ad hoc to paper YieldZone masks derived from ground-truth yield labels can be used during training without leaking into inference.
- domain assumption Harvester monitor yield data at 1-3 m resolution is accurate ground truth.
Cite this review
Pith. "Pith review of CMAViT: Integrating Climate, Managment, and Remote Sensing Data for Crop Yield Estimation with Multimodel Vision Transformers." pith.science (2026). https://pith.science/paper/CGL3LXX4
@misc{pith2026241116989,
  author       = {Pith},
  title        = {Pith review of: CMAViT: Integrating Climate, Managment, and Remote Sensing Data for Crop Yield Estimation with Multimodel Vision Transformers},
  year         = {2026},
  howpublished = {\url{https://pith.science/paper/CGL3LXX4}},
  note         = {Machine review of arXiv:2411.16989}
}
read the original abstract
Crop yield prediction is essential for agricultural planning but remains challenging due to the complex interactions between weather, climate, and management practices. To address these challenges, we introduce a deep learning-based multi-model called Climate-Management Aware Vision Transformer (CMAViT), designed for pixel-level vineyard yield predictions. CMAViT integrates both spatial and temporal data by leveraging remote sensing imagery and short-term meteorological data, capturing the effects of growing season variations. Additionally, it incorporates management practices, which are represented in text form, using a cross-attention encoder to model their interaction with time-series data. This innovative multi-modal transformer tested on a large dataset from 2016-2019 covering 2,200 hectares and eight grape cultivars including more than 5 million vines, outperforms traditional models like UNet-ConvLSTM, excelling in spatial variability capture and yield prediction, particularly for extreme values in vineyards. CMAViT achieved an R2 of 0.84 and a MAPE of 8.22% on an unseen test dataset. Masking specific modalities lowered performance: excluding management practices, climate data, and both reduced R2 to 0.73, 0.70, and 0.72, respectively, and raised MAPE to 11.92%, 12.66%, and 12.39%, highlighting each modality's importance for accurate yield prediction. Code is available at https://github.com/plant-ai-biophysics-lab/CMAViT.
Figures


Figures from the paper (5 more)


Forward citations
Cited by 1 Pith paper
-
California Crop Yield Benchmark: Combining Satellite Image, Climate, Evapotranspiration, and Soil Data Layers for County-Level Yield Forecasting of Over 70 Crops
A multi-modal transformer trained on Landsat, climate, ET, and soil data reaches R²=0.76 for county-level yield forecasts of 70+ California crops on held-out test years 2021-2022.
Reference graph
Works this paper leans on
-
[1]
P. Jiang and K. D. Thelen. Effect of soil and topographic properties on crop yield in a north-central corn–soybean cropping system. Agronomy Journal, 96 0 (1): 0 252--258, 2004. doi:https://doi.org/10.2134/agronj2004.0252. URL https://acsess.onlinelibrary.wiley.com/doi/abs/10.2134/agronj2004.0252
arXiv 2004
-
[2]
Impact of meteorological drivers on regional inter-annual crop yield variability in france
Andrej Ceglar, Andrea Toreti, Rémi Lecerf, Marijn Van der Velde , and Frank Dentener. Impact of meteorological drivers on regional inter-annual crop yield variability in france. Agricultural and Forest Meteorology, 216: 0 58--67, 2016. ISSN 0168-1923. doi:https://doi.org/10.1016/j.agrformet.2015.10.004. URL https://www.sciencedirect.com/science/article/pi...
-
[3]
Ford, Shuaib Lwasa, Benon Nabaasa, and Ambrose Buyinza
Terence Epule Epule, James D. Ford, Shuaib Lwasa, Benon Nabaasa, and Ambrose Buyinza. The determinants of crop yields in Uganda: What is the role of climatic and non-climatic factors? Agriculture and Food Security, 7 0 (1): 0 1--17, 2018. ISSN 20487010. doi:10.1186/s40066-018-0159-3. URL https://doi.org/10.1186/s40066-018-0159-3
-
[4]
Unpacking the climatic drivers of US agricultural yields
Ariel Ortiz-Bobea, Haoying Wang, Carlos M Carrillo, and Toby R Ault. Unpacking the climatic drivers of US agricultural yields. Environmental Research Letters, 14 0 (6): 0 064003, may 2019. doi:10.1088/1748-9326/ab1e75. URL https://doi.org/10.1088/1748-9326/ab1e75
-
[5]
Thomas M. Chaloner, Sarah J. Gurr, and Daniel P. Bebber. Plant pathogen infection risk tracks global crop yields under climate change . Nature Climate Change, 11 0 (8): 0 710--715, 2021. ISSN 17586798. doi:10.1038/s41558-021-01104-8. URL http://dx.doi.org/10.1038/s41558-021-01104-8
-
[6]
D. M. Johnson. An assessment of pre- and within-season remotely sensed variables for forecasting corn and soybean yields in the United States . Nature Climate Change, 141: 0 116--128, 2014
work page 2014
-
[7]
A computer vision system for early stage grape yield estimation based on shoot detection
Scarlett Liu, Steve Cossell, Julie Tang, Gregory Dunn, and Mark Whitty. A computer vision system for early stage grape yield estimation based on shoot detection. Computers and Electronics in Agriculture, 137: 0 88--101, 2017
work page 2017
-
[8]
R Rudolph, Katja Herzog, Reinhard T \"o pfer, V Steinhage, et al. Efficient identification, localization and quantification of grapevine inflorescences and flowers in unprepared field images using fully convolutional networks. Vitis, 58 0 (3): 0 95--104, 2019
work page 2019
Show all 56 references
-
[9]
Improving jujube fruit tree yield estimation at the field scale by assimilating a single landsat remotely-sensed lai into the wofost model
Tiecheng Bai, Nannan Zhang, Benoit Mercatoris, and Youqi Chen. Improving jujube fruit tree yield estimation at the field scale by assimilating a single landsat remotely-sensed lai into the wofost model. Remote Sensing, 11 0 (9): 0 1119, 2019
2019
-
[10]
Methods of crop estimation in grapes
Imed Dami. Methods of crop estimation in grapes. Ohio Grape-Wine Electronic Newsletter, pages 1--4, 2006
2006
-
[11]
Detection and counting of on-tree citrus fruit for crop yield estimation
Zeeshan Malik, Sheikh Ziauddin, Ahmad R Shahid, and Asad Safi. Detection and counting of on-tree citrus fruit for crop yield estimation. International Journal of Advanced Computer Science and Applications, 7 0 (5), 2016
2016
-
[12]
Rice crop yield prediction using artificial neural networks
Niketa Gandhi, Owaiz Petkar, and Leisa J Armstrong. Rice crop yield prediction using artificial neural networks. In 2016 IEEE Technological Innovations in ICT for Agriculture and Rural Development (TIAR), pages 105--110. IEEE, 2016
2016
-
[13]
Daily mapping of 30 m lai and ndvi for grape yield prediction in california vineyards
Liang Sun, Feng Gao, Martha C Anderson, William P Kustas, Maria M Alsina, Luis Sanchez, Brent Sams, Lynn McKee, Wayne Dulaney, William A White, et al. Daily mapping of 30 m lai and ndvi for grape yield prediction in california vineyards. Remote Sensing, 9 0 (4): 0 317, 2017
2017
-
[14]
A precision viticulture uav-based approach for early yield prediction in vineyard
SF Di Gennaro, P Toscano, P Cinat, A Berton, and A Matese. A precision viticulture uav-based approach for early yield prediction in vineyard. In Precision agriculture’19, pages 370--378. Wageningen Academic Publishers, 2019
2019
-
[15]
Liu and M
S. Liu and M. Whitty. Automatic grape bunch detection in vineyards with an svm classifier. Journal of Applied Logic, 13: 0 643--653, 2019
2019
-
[16]
Grape detection, segmentation, and tracking using deep neural networks and three-dimensional association
Thiago T Santos, Leonardo L de Souza, Andreza A dos Santos, and Sandra Avila. Grape detection, segmentation, and tracking using deep neural networks and three-dimensional association. Computers and Electronics in Agriculture, 170: 0 105247, 2020
2020
-
[17]
A vision-based robust grape berry counting algorithm for fast calibration-free bunch weight estimation in the field
Scarlett Liu, Xiangdong Zeng, and Mark Whitty. A vision-based robust grape berry counting algorithm for fast calibration-free bunch weight estimation in the field. Computers and Electronics in Agriculture, 173: 0 105360, 2020
2020
-
[18]
Soybean yield estimation and its components: A linear regression approach
Marcelo Chan Fu Wei and Jos \'e Paulo Molin. Soybean yield estimation and its components: A linear regression approach. Agriculture, 10 0 (8): 0 348, 2020
2020
-
[19]
Relationship between modis derived ndvi and yield of cereals for selected european countries
Ewa Panek and Dariusz Gozdowski. Relationship between modis derived ndvi and yield of cereals for selected european countries. Agronomy, 11 0 (2): 0 340, 2021
2021
-
[20]
Influence of soil heterogeneity on soybean plant development and crop yield evaluated using time-series of uav and ground-based geophysical imagery
Nicola Falco, Haruko M Wainwright, Baptiste Dafflon, Craig Ulrich, Florian Soom, John E Peterson, James Bentley Brown, Karl B Schaettle, Malcolm Williamson, Jackson D Cothren, et al. Influence of soil heterogeneity on soybean plant development and crop yield evaluated using ti...
2021
-
[21]
High-resolution crop yield and water productivity dataset generated using random forest and remote sensing
Minghan Cheng, Xiyun Jiao, Lei Shi, Josep Penuelas, Lalit Kumar, Chenwei Nie, Tianao Wu, Kaihua Liu, Wenbin Wu, and Xiuliang Jin. High-resolution crop yield and water productivity dataset generated using random forest and remote sensing. Scientific data, 9 0 (1): 0 641, 2022
2022
-
[22]
Large-scale spatio-temporal yield estimation via deep learning using satellite and management data fusion in vineyards
Hamid Kamangir, Brent S Sams, Nick Dokoozlian, Luis Sanchez, and J Mason Earles. Large-scale spatio-temporal yield estimation via deep learning using satellite and management data fusion in vineyards. Computers and Electronics in Agriculture, 216: 0 108439, 2024
2024
-
[23]
An overview of APSIM, a model designed for farming systems simulation
B.A Keating, P.S Carberry, G.L Hammer, M.E Probert, M.J Robertson, D Holzworth, N.I Huth, J.N.G Hargreaves, H Meinke, Z Hochman, G McLean, K Verburg, V Snow, J.P Dimes, M Silburn, E Wang, S Brown, K.L Bristow, S Asseng, S Chapman, R.L McCown, D.M Freebairn, and C.J Smith. An o...
2003
-
[24]
A cnn-rnn framework for crop yield prediction
Saeed Khaki, Lizhi Wang, and Sotirios V Archontoulis. A cnn-rnn framework for crop yield prediction. Frontiers in Plant Science, 10: 0 1750, 2020
2020
-
[25]
Simultaneous corn and soybean yield prediction from remote sensing data using deep transfer learning
Saeed Khaki, Hieu Pham, and Lizhi Wang. Simultaneous corn and soybean yield prediction from remote sensing data using deep transfer learning. Scientific Reports, 11 0 (1): 0 1--14, 2021
2021
-
[26]
A million kernels of truth: Insights into scalable satellite maize yield mapping and yield gap analysis from an extensive ground dataset in the us corn belt
Jillian M Deines, Rinkal Patel, Sang-Zi Liang, Walter Dado, and David B Lobell. A million kernels of truth: Insights into scalable satellite maize yield mapping and yield gap analysis from an extensive ground dataset in the us corn belt. Remote Sensing of Environment, 253: 0 1...
2021
-
[27]
Deep learning
Yann LeCun, Yoshua Bengio, and Geoffrey Hinton. Deep learning. nature, 521 0 (7553): 0 436--444, 2015
2015
-
[28]
Convolutional image captioning
Jyoti Aneja, Aditya Deshpande, and Alexander G Schwing. Convolutional image captioning. In Proceedings of the IEEE conference on computer vision and pattern recognition, pages 5561--5570, 2018
2018
-
[30]
Cropharvest: A global dataset for crop-type classification
Gabriel Tseng, Ivan Zvonkov, Catherine Lilian Nakalembe, and Hannah Kerner. Cropharvest: A global dataset for crop-type classification. In Thirty-fifth Conference on Neural Information Processing Systems Datasets and Benchmarks Track (Round 2), 2021
2021
-
[31]
A gnn-rnn approach for harnessing geospatial and temporal information: application to crop yield prediction
Joshua Fan, Junwen Bai, Zhiyun Li, Ariel Ortiz-Bobea, and Carla P Gomes. A gnn-rnn approach for harnessing geospatial and temporal information: application to crop yield prediction. In Proceedings of the AAAI conference on artificial intelligence, volume 36, pages 11873--11881, 2022
2022
-
[32]
Mmst-vit: Climate change-aware crop yield prediction via multi-modal spatial-temporal vision transformer
Fudong Lin, Summer Crawford, Kaleb Guillot, Yihe Zhang, Yan Chen, Xu Yuan, Li Chen, Shelby Williams, Robert Minvielle, Xiangming Xiao, et al. Mmst-vit: Climate change-aware crop yield prediction via multi-modal spatial-temporal vision transformer. In Proceedings of the IEEE/CV...
2023
-
[33]
Multimodal performers for genomic selection and crop yield prediction
H kon M l y, Susanne Windju, Stein Bergersen, Muath Alsheikh, and Keith L Downing. Multimodal performers for genomic selection and crop yield prediction. Smart Agricultural Technology, 1: 0 100017, 2021
2021
-
[34]
Crop disease identification and interpretation method based on multimodal deep learning
Ji Zhou, Jiuxi Li, Chunshan Wang, Huarui Wu, Chunjiang Zhao, and Guifa Teng. Crop disease identification and interpretation method based on multimodal deep learning. Computers and Electronics in Agriculture, 189: 0 106408, 2021
2021
-
[35]
Accurate prediction of sugarcane yield using a random forest algorithm
Yvette Everingham, Justin Sexton, Danielle Skocaj, and Geoff Inman-Bamber. Accurate prediction of sugarcane yield using a random forest algorithm. Agronomy for sustainable development, 36: 0 1--9, 2016
2016
-
[36]
Crop yield prediction in cotton for regional level using random forest approach
NR Prasad, NR Patel, and Abhishek Danodia. Crop yield prediction in cotton for regional level using random forest approach. spatial information research, 29: 0 195--206, 2021
2021
-
[37]
Winter wheat yield prediction in the conterminous united states using solar-induced chlorophyll fluorescence data and xgboost and random forest algorithm
Abhasha Joshi, Biswajeet Pradhan, Subrata Chakraborty, and Mukunda Dev Behera. Winter wheat yield prediction in the conterminous united states using solar-induced chlorophyll fluorescence data and xgboost and random forest algorithm. Ecological Informatics, 77: 0 102194, 2023
2023
-
[38]
Crop yield prediction using machine learning models: Case of irish potato and maize
Martin Kuradusenge, Eric Hitimana, Damien Hanyurwimfura, Placide Rukundo, Kambombo Mtonga, Angelique Mukasine, Claudette Uwitonze, Jackson Ngabonziza, and Angelique Uwamahoro. Crop yield prediction using machine learning models: Case of irish potato and maize. Agriculture, 13 ...
2023
-
[39]
Forecasting of crop yield using remote sensing data, agrarian factors and machine learning approaches
Jasmin Praful Bharadiya, Nikolaos Tzenios Tzenios, and Manjunath Reddy. Forecasting of crop yield using remote sensing data, agrarian factors and machine learning approaches. Journal of Engineering Research and Reports, 24 0 (12): 0 29--44, 2023
2023
-
[40]
Comparison of planetscope, sentinel-2, and landsat 8 data in soybean yield estimation within-field variability with random forest regression
Khilola Amankulova, Nizom Farmonov, Parvina Akramova, Ikrom Tursunov, and L \'a szl \'o Mucsi. Comparison of planetscope, sentinel-2, and landsat 8 data in soybean yield estimation within-field variability with random forest regression. Heliyon, 9 0 (6), 2023
2023
-
[41]
A machine learning-based comparative approach to predict the crop yield using supervised learning with regression models
Bharati Panigrahi, Krishna Chaitanya Rao Kathala, and M Sujatha. A machine learning-based comparative approach to predict the crop yield using supervised learning with regression models. Procedia Computer Science, 218: 0 2684--2693, 2023
2023
-
[42]
Crop prediction using artificial neural network and support vector machine
Tanuja K Fegade and Bhausaheb Vyankatrao Pawar. Crop prediction using artificial neural network and support vector machine. In Data Management, Analytics and Innovation: Proceedings of ICDMAI 2019, Volume 2, pages 311--324. Springer, 2020
2019
-
[43]
An image is worth 16x16 words: Transformers for image recognition at scale, 2021
Alexey Dosovitskiy, Lucas Beyer, Alexander Kolesnikov, Dirk Weissenborn, Xiaohua Zhai, Thomas Unterthiner, Mostafa Dehghani, Matthias Minderer, Georg Heigold, Sylvain Gelly, Jakob Uszkoreit, and Neil Houlsby. An image is worth 16x16 words: Transformers for image recognition at...
2021 arXiv
-
[44]
Integration of acoustic and visual speech signals using neural networks
Ben P Yuhas, Moise H Goldstein, and Terrence J Sejnowski. Integration of acoustic and visual speech signals using neural networks. IEEE Communications Magazine, 27 0 (11): 0 65--71, 1989
1989
-
[45]
Attention is all you need
Ashish Vaswani, Noam Shazeer, Niki Parmar, Jakob Uszkoreit, Llion Jones, Aidan N Gomez, ukasz Kaiser, and Illia Polosukhin. Attention is all you need. Advances in neural information processing systems, 30, 2017
2017
-
[46]
Soybean yield prediction from uav using multimodal data fusion and deep learning
Maitiniyazi Maimaitijiang, Vasit Sagan, Paheding Sidike, Sean Hartling, Flavio Esposito, and Felix B Fritschi. Soybean yield prediction from uav using multimodal data fusion and deep learning. Remote Sensing of Environment, 237: 0 111599, 2020
2020
-
[47]
A generalized multimodal deep learning model for early crop yield prediction
Arshveer Kaur, Poonam Goyal, Kartik Sharma, Lakshay Sharma, and Navneet Goyal. A generalized multimodal deep learning model for early crop yield prediction. In 2022 IEEE International Conference on Big Data (Big Data), pages 1272--1279. IEEE, 2022
2022
-
[48]
Multimodal deep learning for rice yield prediction using uav-based multispectral imagery and weather data
Md Suruj Mia, Ryoya Tanabe, Luthfan Nur Habibi, Naoyuki Hashimoto, Koki Homma, Masayasu Maki, Tsutomu Matsui, and Takashi ST Tanaka. Multimodal deep learning for rice yield prediction using uav-based multispectral imagery and weather data. Remote Sensing, 15 0 (10): 0 2511, 2023
2023
-
[49]
A multimodal data fusion and deep neural networks based technique for tea yield estimation in pakistan using satellite imagery
Zeeshan Ramzan, HM Shahzad Asif, Irfan Yousuf, and Muhammad Shahbaz. A multimodal data fusion and deep neural networks based technique for tea yield estimation in pakistan using satellite imagery. IEEE Access, 11: 0 42578--42594, 2023
2023
-
[50]
Gpt-3.5 tokenizer
OpenAI. Gpt-3.5 tokenizer. https://platform.openai.com/docs/guides/gpt, 2023. Accessed: Month, Year
2023
-
[51]
Sentinel 2 data
Sentinel2. Sentinel 2 data. https://sentinel.esa.int/web/sentinel/missions/sentinel-2. Accessed: 2022-03-02
2022
-
[52]
Google earth engine: Planetary-scale geospatial analysis for everyone
Noel Gorelick, Matt Hancher, Mike Dixon, Simon Ilyushchenko, David Thau, and Rebecca Moore. Google earth engine: Planetary-scale geospatial analysis for everyone. Remote sensing of Environment, 202: 0 18--27, 2017
2017
-
[53]
The libradtran software package for radiative transfer calculations-description and examples of use
Bernhard Mayer and Arve Kylling. The libradtran software package for radiative transfer calculations-description and examples of use. Atmospheric Chemistry and Physics, 5 0 (7): 0 1855--1877, 2005
2005
-
[54]
A non-local algorithm for image denoising
Antoni Buades, Bartomeu Coll, and J-M Morel. A non-local algorithm for image denoising. In 2005 IEEE computer society conference on computer vision and pattern recognition (CVPR'05), volume 2, pages 60--65. Ieee, 2005
2005
-
[55]
Thornton, R
M.M. Thornton, R. Shrestha, Y. Wei, P.E. Thornton, and S-C. Kao. Daymet: Daily surface weather data on a 1-km grid for north america, version 4 r1, 2022. URL https://daac.ornl.gov/cgi-bin/dsviewer.pl?ds_id=2129
2022
-
[56]
Decoupled weight decay regularization
I Loshchilov. Decoupled weight decay regularization. arXiv preprint arXiv:1711.05101, 2017
2017 arXiv
-
[57]
Predicting crop yield lows through the highs via binned deep imbalanced regression
Hamid Kamangir, Brent S Sams, Nick Dokoozlian, Luis Sanchez, and J Mason Earles. Predicting crop yield lows through the highs via binned deep imbalanced regression. Available at SSRN 4893816
Reviewed August 12, 2026 · model on record in the stance chip above.
Discussion (0). Continue with ORCID to comment.