REVIEW 4 major objections 5 minor 2 cited by
A Graph Neural Network deep-dive into successful counterattacks
T0 review · 4 major / 5 minor · reviewed 2026-08-12 · deepseek-v4-flash
Pith's one-line read Gender-specific graph neural networks predict successful counterattacks better than a combined model.
desk verdict Open, reproducible GNN counterattack study with a plausible gender effect, but the headline result is not yet trustworthy because the train/test split may leak sequence outcomes. read the letter →
The pith
A machine-rendered reading of the paper's core claim, the machinery that carries it, and where it could break.
The reading
What carries the argument
The load-bearing object is a per-frame graph of a soccer snapshot: players are nodes (plus a ball node), teammates are connected to each other, and every player connects to the ball, with node features for normalized position, velocity, angle of motion, distance and angle to goal, distance and angle to the ball, and an attacking-team flag, plus edge features for inter-player distance and angle. These graphs are passed through three CrystalConv layers—a graph convolution layer originally designed for atomic crystal structures—followed by global average pooling, a dense ReLU layer, dropout, and a sigmoid output. This representation lets a single frame, rather than a full sequence, carry the information the model needs, and it lets the model attribute importance to individual players' speed and positioning.
What would settle it
Re-run the training and evaluation with a split that keeps every frame from the same counterattack (or the same match) in one fold, and compare the gender-specific versus combined ROC-AUC; if the gap between the gender-specific scores (0.83 and 0.78) and the combined score (0.76) shrinks to near zero, the frame-level random split is the source of the claimed improvement.
Extended reading notes
Core claim
The central discovery is that a gender-specific graph neural network can predict whether a frame of tracking data belongs to a successful counterattack better than an architecturally identical model trained on pooled men's and women's data. Success is defined algorithmically as the attacking team moving the ball into the opponent's penalty area; the women's model scores 0.83 ROC-AUC, the men's model 0.78, and the combined model 0.76. On the feature-importance side, shuffling either attacking or defending players' byline-to-byline speed and angle to the goal degrades the models most, and defenders' node features are more important to performance than attackers'. The paper treats this as the first demonstration, using full seasons of broadcast tracking data for both genders, that women's game analytics can be built from women's data rather than borrowed from men's models.
Load-bearing premise
The load-bearing premise is that randomly splitting individual frames into training and test sets makes those frames independent, even though frames from the same counterattack or match are related; if related frames land on both sides of the split, the model can memorize particular sequences and the reported performance gap could be inflated.
Editorial extensions
If this is right
- A single frame of tracking data is enough to predict counterattack success at 0.78–0.83 ROC-AUC, so outcome modeling can work on snapshots without full play-level time series.
- Because the women-only model beats the combined model on women's games despite a much smaller sample, women's soccer analytics can move away from relying on models fitted to men's data.
- The feature-importance ranking gives coaching staff a shortlist of movement variables—speed along the pitch, angle to goal, angle to the ball, speed across the pitch—to focus on when reviewing transitions.
- Defensive node features matter more than attacking node features, which supports the view that counterattacks succeed mainly against disorganized defensive shapes and points defensive work toward transition positioning.
Reading between the lines
- A direct mechanical test of the claimed gender benefit would add a gender indicator as a node feature to the combined model; if that single model recovers most of the gap, the advantage comes from a gender interaction rather than from needing two completely separate models.
- The permutation-importance ranking reflects which features carry information under random shuffles, not necessarily which features a coach should change; the run-perturbation examples are the more causal use, and they could be validated by tracking whether the suggested adjustments actually raise the odds of entering the box in new games.
- The same graph-frame pipeline could be applied to other transition phases, such as counterpressing or restarts, to see whether gender-specific models also improve those predictions; if the pattern repeats, the separation benefit is a general feature of soccer analytics, not a quirk of counterattacks.
Editorial analysis
A structured set of objections, weighed in public.
Referee Report
Summary. The paper proposes gender-specific Graph Neural Network classifiers that predict whether an ongoing counterattack in soccer will end in the opponent's penalty area. Each frame of tracking data is represented as a graph whose nodes are players and the ball, with node and edge features encoding positions, velocities, angles, and distances. The authors train separate women's and men's models and a combined 'gender-ambiguous' model on 20,863 frames from MLS, NWSL, and international matches, and report that the gender-specific models achieve higher ROC-AUC (women 0.83, men 0.78) than the combined model (0.76). They also compute permutation feature importances, concluding that byline-to-byline speed and angle to goal are the most influential node features, and they provide illustrative run-trajectory adjustments that increase predicted success probabilities. The dataset, code, and a software package are released openly.
Significance. If the central performance claim survives scrutiny, the paper is a useful contribution to sports analytics: it is, to my knowledge, one of the first studies to train graph neural networks on synchronized tracking and event data from both men's and women's professional soccer, and the first to directly compare gender-specific and gender-ambiguous counterattack models. The open release of the graph-formatted dataset, training notebooks, and the unravelsports package is a concrete strength that will lower the barrier for follow-up work. The paper also makes a falsifiable empirical prediction: that gender-specific models outperform a combined model at this task. The three main empirical claims—performance, calibration, and feature importance—are each in need of additional validation, but none appears irreparable within the scope of a revision.
major comments (4)
- [Section 2.2 (Table 2)] The training/test split is described only as 'a balanced training set (consisting of 70% of samples)'; the manuscript nowhere states that the split groups frames by counterattack or by match. Because each frame is labeled with the future outcome of the sequence within which it lies, frames from the same counterattack share a label and are highly temporally correlated. A random frame-level split will therefore put many near-duplicate frames in both training and test, allowing the model to memorize sequence-specific patterns. This can inflate the reported AUC values in Table 2 and contaminate the permutation importances in Figure 4, which are computed on the same test set. Please rerun the analysis with a sequence-level or match-level grouped split and report metrics under that split; the central claim depends on this.
- [Section 2.2 / Table 1] The comparison currently rests on a single split and a single training run, with no confidence intervals or statistical significance testing. The women's model is trained on only 942 counterattacks / 3,720 frames with a fixed 100 epochs, while the men's and combined models use 200 epochs, and no validation-based hyperparameter selection is described. The men's AUC gap (0.78 vs. 0.76) is small, so the conclusion that gender-specific models outperform the combined model needs to be supported by repeated grouped cross-validation and an estimate of uncertainty. This is particularly important if the effective sample size shrinks to the number of counterattacks once the leakage route in the previous comment is closed.
- [Section 3.2 (Figure 4)] The permutation feature importance analysis shuffles one node feature at a time while leaving its correlated counterparts intact. Several features are constructed to be highly related (for example, x-coordinate versus distance/angle to goal, and velocity components versus speed and direction), so marginal permutation creates unrealistic samples and can produce misleading rankings. The analysis also uses only 15 permutations per feature, and edge features are excluded entirely without an alternative sensitivity analysis. The paper's interpretive claims in Section 6—for instance, that byline-to-byline speed and angle to goal are the most important factors—are therefore stronger than the current evidence supports. Please add conditional or grouped permutation schemes, report variance over more repetitions, and explicitly restate the conclusion as applying only to the node features under a correlation-blind procedure.
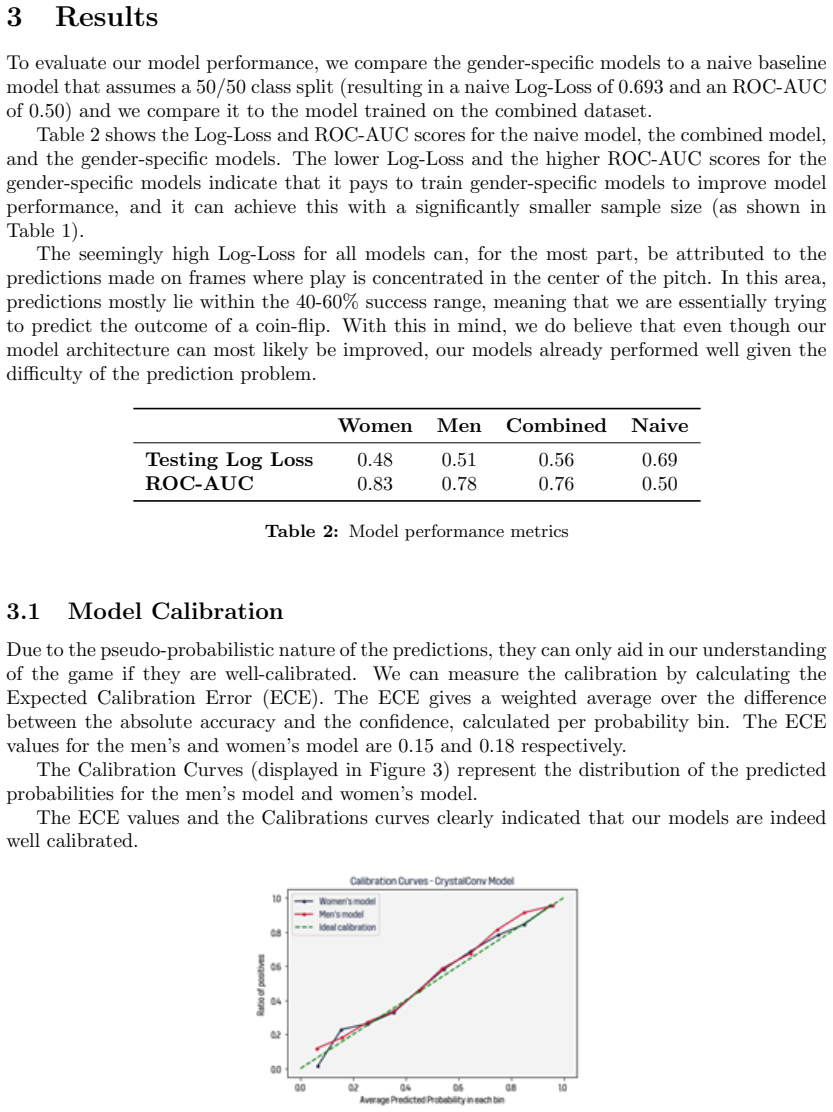
- [Section 3.1] ECE values of 0.15 (men) and 0.18 (women) are not normally described as 'well calibrated'; they indicate substantial over/under-confidence, and the sentence 'The ECE values and the Calibration curves clearly indicated that our models are indeed well calibrated' is not supported by these numbers. Please report the underlying bin-level calibration table, the Brier score, and ideally a calibration test, and revise the wording accordingly.
minor comments (5)
- [Introduction / Abstract] There are several typos and formatting errors: 'convering' in the abstract, 'FIF A' in the introduction, and 'ttps://unravelsports.github.io' in reference [5].
- [Section 2] The definition of a successful counterattack as one that ends with the ball in the opponent's penalty area is clear, but it should be stated in the abstract or introduction as well, since it is central to interpreting 'success'.
- [Section 2.1] The paper does not report optimizer, learning rate, batch size, dropout rate, or the number of hidden units; the repository may contain this information, but the manuscript should state these choices for reproducibility.
- [Section 2.2] The test set is not described in terms of class balance; please report the distribution of successful and unsuccessful frames in both training and test sets under the chosen split.
- [Section 3.2] The feature importance values are reported only through the plot in Figure 4; providing a table with the mean and standard deviation of AUC drop for each feature would make the results more interpretable.
Circularity Check
No circularity: the GNN pipeline trains on independently labeled counterattack outcomes and evaluates on held-out frames; self-citations are limited to data/code availability and are not load-bearing.
full rationale
The paper's claimed derivation is empirical supervised learning, not a formal derivation. Counterattack labels are produced by an on-ball-event algorithm verified with USWNT/USMNT analysts (Section 2), independently of the GNN architecture. The gender-specific vs gender-ambiguous comparison is an ordinary train/test AUC comparison (Table 2); no parameter is fitted to the test set and then reported as a prediction. Permutation feature importance (Section 3.2) summarizes the learned decision boundary and is not used to define the target or the model. Self-citations [4], [5], [6], [7], [12] are to repositories, notebooks, and prior blog/tool work; none is invoked as a uniqueness theorem or to justify the central claim. The paper's own limitation ('this research certainly lacks a thorough validation of the model performance', Section 5) concerns validation/leakage risk, not circularity: a random frame-level split could share frames from the same counterattack across train and test, but that is an empirical validity concern and not a reduction of the result to its inputs by construction. Therefore circularity score 0.
Assumptions & free parameters
free parameters (3)
- Epochs (women's model) =
100
- Epochs (men's/combined model) =
200
- Permutation importance repeats =
15
assumptions (6)
- domain assumption Graph representation with same-team edges and ball-to-all edges captures the necessary information for counterattack outcome prediction.
- domain assumption The rules-based algorithm for identifying counterattacks produces a valid, unbiased set of sequences.
- ad hoc to paper Frame-level i.i.d. assumption: each frame is an independent sample despite temporal correlation.
- domain assumption SkillCorner predicted coordinates for out-of-view players have sufficient accuracy.
- standard math Permutation feature importance reliably reflects feature relevance under feature correlation.
- ad hoc to paper CrystalConv layers can learn relevant game-state features from player graphs.
Cite this review
Pith. "Pith review of A Graph Neural Network deep-dive into successful counterattacks." pith.science (2026). https://pith.science/paper/PL5LCKBU
@misc{pith2026241117450,
  author       = {Pith},
  title        = {Pith review of: A Graph Neural Network deep-dive into successful counterattacks},
  year         = {2026},
  howpublished = {\url{https://pith.science/paper/PL5LCKBU}},
  note         = {Machine review of arXiv:2411.17450}
}
read the original abstract
A counterattack in soccer is a high speed, high intensity direct attack that can occur when a team transitions from a defensive state to an attacking state after regaining possession of the ball. The aim is to create a goal-scoring opportunity by convering a lot of ground with minimal passes before the opposing team can recover their defensive shape. The purpose of this research is to build gender-specific Graph Neural Networks to model the likelihood of a counterattack being successful and uncover what factors make them successful in professional soccer. These models are trained on a total of 20863 frames of synchronized on-ball event and spatiotemporal (broadcast) tracking data. This dataset is derived from 632 games of MLS (2022), NWSL (2022) and international soccer (2020-2022). With this data we demonstrate that gender-specific Graph Neural Networks outperform architecturally identical gender-ambiguous models in predicting the successful outcome of counterattacks. We show, using Permutation Feature Importance, that byline to byline speed, angle to the goal, angle to the ball and sideline to sideline speed are the node features with the highest impact on model performance. Additionally, we offer some illustrative examples on how to navigate the infinite solution search space to aid in identifying improvements for player decision making. This research is accompanied by an open-source repository containing all data and code, and it is also accompanied by an open-source Python package which simplifies converting spatiotemporal data into graphs. This package also facilitates testing, validation, training and prediction with this data. This should allow the reader to replicate and improve upon our research more easily.
Figures


Figures from the paper (5 more)


Forward citations
Cited by 2 Pith papers
-
Pressing Intensity: An Intuitive Measure for Pressing in Soccer
A soccer pressing intensity metric is defined as the probability that any defender reaches an attacker or the ball, using a time-to-intercept formula with a logistic transform.
-
EFPI: Elastic Formation and Position Identification in Football (Soccer) using Template Matching and Linear Assignment
EFPI matches player tracking data to 65 football formation templates using linear sum assignment, with position scaling and a stability parameter, to label formations and player roles.
Reference graph
Works this paper leans on
-
[1]
Permutation impor- tance: a corrected feature importance measure
Andr´ e Altmann, Laura Tolo¸ si, Oliver Sander, and Thomas Lengauer. Permutation impor- tance: a corrected feature importance measure. Bioinformatics, 26(10):1340–1347, 2010
work page 2010
-
[2]
Pascal Bauer and Gabriel Anzer. Data-driven detection of counterpressing in professional football: a supervised machine learning task based on synchronized positional and event data with expert-based feature extraction. Data Mining and Knowledge Discovery, 35(5): 2009–2049, 2021
2009
-
[3]
Putting team formations in association football into context
Pascal Bauer, Gabriel Anzer, and Laurie Shaw. Putting team formations in association football into context. Journal of Sports Analytics, 9(1):39–59, 2023
work page 2023
-
[4]
J. Bekkers. unravelsports [github], 2024. URL https://github.com/UnravelSports/ unravelsports
work page 2024
-
[5]
Joris Bekkers. Pass maps 2.0, 2017. URL ttps://unravelsports.github.io/2017/07/ 10/pass-maps-v2.html
work page 2017
-
[6]
Interactive digital tactics board, 2022
Joris Bekkers. Interactive digital tactics board, 2022. URL https://unravelsports. github.io/2022/03/06/tactics-board.html
work page 2022
-
[7]
Joris Bekkers and Shaunak Dabadghao. Flow motifs in soccer: What can passing behavior tell us? Journal of Sports Analytics, 5(4):299–311, 2019
work page 2019
-
[8]
Women’s football analyzed: Interpretable expected goals models for women
Lotte Bransen and Jesse Davis. Women’s football analyzed: Interpretable expected goals models for women. In Proceedings of the AI for Sports Analytics (AISA) Workshop at IJCAI, volume 2021, 2021
work page 2021
Show all 38 references
-
[9]
Using network metrics in soccer: a macro-analysis
Filipe Manuel Clemente, Micael Santos Couceiro, Fernando Manuel Louren¸ co Martins, and Rui Sousa Mendes. Using network metrics in soccer: a macro-analysis. Journal of human kinetics, 45:123, 2015
2015
-
[10]
Vaep: An objective approach to valuing on-the-ball actions in soccer
Tom Decroos, Lotte Bransen, Jan Van Haaren, and Jesse Davis. Vaep: An objective approach to valuing on-the-ball actions in soccer. In IJCAI, pages 4696–4700, 2020
2020
-
[11]
Soccer Federation
U.S. Soccer Federation. U.s. soccer, uswntpa, and usnstpa will officially sign historic new collective bargaining agreements on the field post-game following the usa vs nige- ria match in washington d.c., 2022. URLhttps://www.ussoccer.com/stories/2022/08/ us-soccer-uswntpa-usn...
2022
-
[12]
Soccer Federation
U.S. Soccer Federation. Gender-specific counterattack gnns [github], 2022. URL https: //github.com/USSoccerFederation/ussf_ssac_23_soccer_gnn
2022
-
[13]
Soccermap: A deep learning architecture for visually- interpretable analysis in soccer
Javier Fern´ andez and Luke Bornn. Soccermap: A deep learning architecture for visually- interpretable analysis in soccer. In Machine Learning and Knowledge Discovery in Databases. Applied Data Science and Demo Track: European Conference, ECML PKDD 2020, Ghent, Belgium, Septem...
2020
-
[14]
A framework for the analytical and visual interpretation of complex spatiotemporal dynamics in soccer
Javier Fern´ andez de la Rosa. A framework for the analytical and visual interpretation of complex spatiotemporal dynamics in soccer. UPCommons, 2022
2022
-
[15]
Fast graph representation learning with pytorch geometric
Matthias Fey and Jan Eric Lenssen. Fast graph representation learning with pytorch geometric. arXiv preprint arXiv:1903.02428, 2019
1903 arXiv
-
[16]
Fifa women’s world cup 2019 ™ watched by more than 1 billion, 2019
FIF A. Fifa women’s world cup 2019 ™ watched by more than 1 billion, 2019. URL https://www.fifa.com/tournaments/womens/womensworldcup/france2019/news/ fifa-women-s-world-cup-2019tm-watched-by-more-than-1-billion
2019
-
[17]
Fifa council makes key decisions for the future of football development, 2019
FIF A. Fifa council makes key decisions for the future of football development, 2019. URL https://www.fifa.com/about-fifa/organisation/fifa-council/media-releases/ fifa-council-makes-key-decisions-for-the-future-of-football-development
2019
-
[18]
Graph neural networks in tensorflow and keras with spektral [application notes]
Daniele Grattarola and Cesare Alippi. Graph neural networks in tensorflow and keras with spektral [application notes]. IEEE Computational Intelligence Magazine, 16(1):99– 106, 2021
2021
-
[19]
Searching for a unique style in soccer
Laszlo Gyarmati, Haewoon Kwak, and Pablo Rodriguez. Searching for a unique style in soccer. arXiv preprint arXiv:1409.0308, 2014
2014 arXiv
-
[20]
Open graph benchmark: Datasets for machine learning on graphs
Weihua Hu, Matthias Fey, Marinka Zitnik, Yuxiao Dong, Hongyu Ren, Bowen Liu, Michele Catasta, and Jure Leskovec. Open graph benchmark: Datasets for machine learning on graphs. Advances in neural information processing systems, 33:22118–22133, 2020
2020
-
[21]
Those are some numbers the 2022 #nwsl championship drew in 915,000 viewers saturday, a +71% jump from last, 2022
National Women’s Soccer League. Those are some numbers the 2022 #nwsl championship drew in 915,000 viewers saturday, a +71% jump from last, 2022. URL https://twitter. com/NWSL/status/1587449315361886209
2022
-
[22]
P. Minogue. An introduction to graph neural networks: Classifying soccer player positions from passing networks, 2022. URL https://paulminogue.com/posts/ 375ea85d-fc58-4c13-a9dc-5a45ba3c368f
2022
-
[23]
C. Molnar. Interpretable machine learning: A guide for making black box mod- els explainable, 2022. URL https://christophm.github.io/interpretable-ml-book/ feature-importance.html
2022
-
[24]
Mullenberg
J. Mullenberg. The sense and nonsense of a passmas, 2017. URL https://www. tussendelinies.nl/the-sense-and-nonsense-of-a-passmap/
2017
-
[25]
Paul power: neural networks for understanding defending [video], 2021
Friend of Tracking. Paul power: neural networks for understanding defending [video], 2021. URL https://www.youtube.com/watch?v=d5NBm4CFygo
2021
-
[26]
Osmanbaˇ si´ c
A. Osmanbaˇ si´ c. The evolution of counterattacking, 2020. URL https:// spielverlagerung.com/2020/04/01/the-evolution-of-counterattacking/
2020
-
[27]
Explaining the differ- ence between men’s and women’s football
Luca Pappalardo, Alessio Rossi, Michela Natilli, and Paolo Cintia. Explaining the differ- ence between men’s and women’s football. PLoS one, 16(8):e0255407, 2021
2021
-
[28]
A network theory analysis of football strategies
Javier L´ opez Pena and Hugo Touchette. A network theory analysis of football strategies. arXiv preprint arXiv:1206.6904, 2012
2012 arXiv
-
[29]
K. Singh. Introducing expected threat (xt), 2018. URL https://karun.in/blog/ expected-threat.html. 13
2018
-
[30]
Physics-based modeling of pass probabilities in soccer
William Spearman, Austin Basye, Greg Dick, Ryan Hotovy, and Paul Pop. Physics-based modeling of pass probabilities in soccer. In Proceeding of the 11th MIT Sloan Sports Analytics Conference, volume 1, 2017
2017
-
[31]
Analytics and modelling in women’s football, 2022
StatsBomb. Analytics and modelling in women’s football, 2022. URL https://statsbomb. com/articles/soccer/analytics-and-modelling-in-womens-football/
2022
-
[32]
Statsbomb conference 2022: Dr
StatsBomb. Statsbomb conference 2022: Dr. will morgan [video], 2022. URL https: //www.youtube.com/watch?v=RG6_eisU-0M
2022
-
[33]
Optaproanalyticsforum– learning to watch football: Self-supervised repre- sentations for tracking data [video], 2020
StatsPerform. Optaproanalyticsforum– learning to watch football: Self-supervised repre- sentations for tracking data [video], 2020. URL https://youtu.be/H1iho17lnoI?t=1508
2020
-
[34]
Making offensive play predictable-using a graph convolutional network to understand defensive performance in soccer
Michael St¨ ockl, Thomas Seidl, Daniel Marley, and Paul Power. Making offensive play predictable-using a graph convolutional network to understand defensive performance in soccer. In Proceedings of the 15th MIT sloan sports analytics conference, volume 2022, 2021
2022
-
[35]
Women’s euro watched by over 365 million people globally, 2022
UEF A. Women’s euro watched by over 365 million people globally, 2022. URL https://www.uefa.com/insideuefa/news/ 0278-15ff73f066e1-c729b5099cbb-1000--365-million-people-watch-euro-2022/
2022
-
[36]
Worville
T. Worville. Explained: How different are men’s and women’s football?, 2020. URL https: //theathletic.com/1756375/2020/04/20/womens-vs-mens-football-the-trends/
2020
-
[37]
Graph neural networks to predict sports outcomes
Peter Xenopoulos and Claudio Silva. Graph neural networks to predict sports outcomes. In 2021 IEEE International Conference on Big Data (Big Data), pages 1757–1763. IEEE, 2021
2021
-
[38]
Crystal graph convolutional neural networks for an accurate and interpretable prediction of material properties
Tian Xie and Jeffrey C Grossman. Crystal graph convolutional neural networks for an accurate and interpretable prediction of material properties. Physical review letters, 120 (14):145301, 2018. 14
2018
Reviewed August 12, 2026 · model on record in the stance chip above.
Discussion (0). Continue with ORCID to comment.