REVIEW 4 major objections 6 minor 42 references
Bayesian Deconvolution of Astronomical Images with Diffusion Models: Quantifying Prior-Driven Features in Reconstructions
T0 review · 4 major / 6 minor · reviewed 2026-08-12 · deepseek-v4-flash
Pith's one-line read This paper claims that a diffusion model trained on simulated galaxies can deconvolve ground-based survey images to Hubble-like resolution, and that a variance-ratio metric flags which reconstructed pixels are prior-driven rather than…
desk verdict Honest proof-of-concept with a useful prior-dominated-feature flag, but the HST-resolution claim needs a quantitative test before it can be trusted. read the letter →
The pith
A machine-rendered reading of the paper's core claim, the machinery that carries it, and where it could break.
The reading
What carries the argument
The machinery is Diffusion Posterior Sampling (DPS): a reverse-time diffusion guided by a learned score plus an approximate likelihood term, with the unknown clean image estimated through Tweedie's formula from the noisy latent. The prior is a DDPM trained on idealized TNG galaxies. The forward operator A embeds a redshift-dependent apparent-size scaling and the HSC pixel scale before convolution with the HSC PSF, which makes the tool adaptable to any dataset. A variance-ratio metric compares pixel-wise posterior variance to prior variance over 256 samples; it is the instrument that identifies prior-driven features, and its calibration on simulated galaxies with known signal-to-noise is what connects it to hallucination.
What would settle it
Take a sample of HSC galaxies with independent space-based imaging (for example JWST) at redshifts above 0.7, and compare each deconvolved reconstruction with the space-based truth. If regions flagged by the variance-ratio metric as prior-driven turn out to match the deeper space-based data, or if regions flagged as data-driven turn out to be absent in that data, the metric's trust map is falsified.
Extended reading notes
Core claim
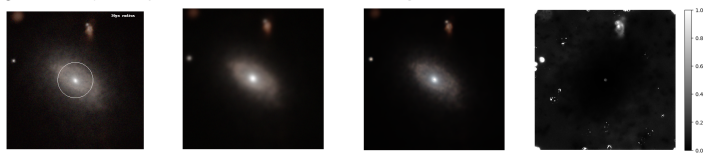
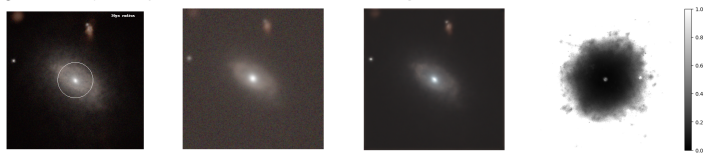
On the paper's own terms, the central discovery is that diffusion posterior sampling (DPS) with a DDPM prior trained on idealized TNG100 galaxy images can deconvolve HSC observations at moderate redshift to resolutions comparable to HST/ACS images, and that the faithfulness of the reconstruction can be audited. The reconstruction is judged by comparing the forward model A(x_diff0) with the observation y, by residual maps against known TNG truth in simulation, and visually against HST crops. Over 256 posterior samples, the pixel-wise mean is reported to be a robust output while the ratio of posterior variance to prior variance marks regions dominated by the prior; in the galaxy centers this ratio is near zero, while at higher redshifts, where the solver must simultaneously upsample, the ratio grows and hallucinated features appear. The paper also demonstrates, on simulated galaxies of varying magnitude, that the variance ratio rises monotonically as signal-to-noise falls, supporting its use as a hallucination indicator.
Load-bearing premise
The whole method relies on the assumption that idealized, face-on TNG100 simulated galaxies at a few low redshifts are a faithful prior for real HSC galaxies, including those at substantially higher redshift; if that prior is wrong, the reconstructions will be dominated by simulation features and the variance-ratio metric will not reveal whether those features are correct.
Editorial extensions
If this is right
- If the central claim holds, ground-based survey images of moderately distant galaxies can be deconvolved to resolutions comparable to Hubble without needing space-based observations for every target.
- The variance-ratio metric gives a pixel-level trust map, so scientific users can exclude prior-dominated regions before measuring galaxy structure.
- Because redshift and pixel scale enter the forward model explicitly, the same trained prior can be applied to other cameras and surveys, not only HSC.
- At redshifts above about 0.7, the inverse problem becomes a joint deconvolution and upsampling task, and the paper's own results show that this regime is prone to hallucinated features.
- Sampling multiple posterior draws and averaging yields a more reliable reconstruction than any single sample, at roughly 100 seconds per evaluation on a modern GPU.
Reading between the lines
- Extending beyond the paper: the variance-ratio map could be turned into a per-pixel uncertainty mask for downstream scientific catalogs, flagging measurements that should be down-weighted.
- A natural test the paper does not run: compare variance-ratio flags against independent space-based imaging (for example JWST) at redshifts the TNG prior does not cover, to see whether low-ratio regions are indeed trustworthy.
- The same DPS formulation with redshift- and scale-dependent forward operators could be applied to other inverse problems in astronomy, such as deblending crowded fields or super-resolution of low-surface-brightness features.
- The dependence of the metric on the chosen aperture radius suggests it could be calibrated into a scalar quality score per galaxy, enabling selection functions for large statistical samples.
Signed reviews
Editorial analysis
A structured set of objections, weighed in public.
Referee Report
Summary. The paper presents a Bayesian deconvolution pipeline for ground-based astronomical images, combining a DDPM prior trained on idealized TNG100 simulation images with the Diffusion Posterior Sampling (DPS) algorithm. The forward model includes a redshift- and pixel-scale-dependent operator that maps idealized TNG images to HSC-like observations. The method is applied to HSC PDR3 images, and the abstract claims that the deconvolved images reach resolutions comparable to HST images, while also proposing a posterior-to-prior variance-ratio metric to identify prior-driven features. The paper includes results on simulated TNG observations, visual comparisons of deconvolved HSC images with HST images for two low-redshift objects, a high-redshift failure case, and a small simulated test of the hallucination metric as a function of galaxy magnitude.
Significance. If the central claims are established, the work would be valuable: it offers a publicly available implementation, includes redshift and pixel scale in the forward model, and attempts to provide a pixel-level uncertainty-aware tool for deconvolution, which is important for scientific use of generative-model-based restoration. The paper is honest about some limitations, particularly the high-redshift behavior, and it makes a genuine effort to quantify prior-driven features. However, the current evidence does not yet establish the headline claim of HST-comparable resolution, and the hallucination-metric validation is weakened by its dependence on the same simulation family used to train the prior. These issues are load-bearing for the paper's main conclusions, so the manuscript requires substantial additional work rather than minor polishing.
major comments (4)
- [3.2, Figures 4-6] The central claim that deconvolved HSC images reach 'resolutions comparable to those obtained by HST images' is supported only by visual side-by-side comparisons for two low-redshift objects. No quantitative metric (e.g., Fourier ring correlation, half-light radius recovery, cross-correlation with the HST reference, or residual power spectrum) is provided. Because the prior is trained on simulated galaxies, visual similarity to HST images can arise from prior hallucination rather than from genuine resolution recovery. A quantitative comparison against HST, or against simulated ground truth with known PSF and noise, is needed to substantiate this claim.
- [3.3, Figure 8] The paper acknowledges that at z > 0.7 the reconstruction is highly prior-dominated, with features hallucinated around the galaxy that are invisible in the HST counterpart. This is a load-bearing limitation because the abstract states the HST-comparable resolution claim without this qualification. The manuscript should either restrict the claim to the regime where the method is validated or provide a quantitative characterization of where the transition to prior domination occurs (e.g., in terms of object size, SNR, and upsampling factor). Without this, the general claim is not supported by the presented evidence.
- [3.4, Table 2] The validation of the variance-ratio metric uses simulated TNG images that are drawn from the same simulation family used to train the DDPM prior. This can show that the metric responds to changes in SNR within the training distribution, but it does not establish that a low variance ratio indicates absence of hallucination for real HSC galaxies, whose morphologies may differ from idealized face-on TNG galaxies. The test also uses only a single galaxy with six magnitude values and reports no uncertainties or repeated draws. Validation on an independent simulation suite or on real HST images with artificially degraded input would be needed to support the metric as a general tool.
- [3.4, variance-ratio definition] The variance-ratio metric is not fully specified. The text says 'we take the pixel-wise posterior variance and prior variance over 256 samples, take their ratio and compute the average value on a centered aperture of radius r,' but it does not define what 'prior variance' means (variance over samples from the unconditional prior? over posterior samples with different seeds? over pixels?) nor whether the ratio is pixel-wise before aperture averaging. The subsequent claim that a central ratio close to zero means the model is 'not hallucinating' is an interpretive assumption that is not derived or tested. These details must be clarified for the metric to be reproducible and interpretable.
minor comments (6)
- [2, TNG paragraph] The text 'camera field-of-view face-on (also referred to asv0)' contains a typo: 'asv0' should be 'as v0' or the FITS keyword should be formatted consistently.
- [Figure 1] The schematic in Figure 1 is difficult to parse, particularly the meaning of the nested braces and the relation between the input size n and the observed size m(z,p). The text should state explicitly that when m(z,p) < n the inverse problem includes an upsampling component, since this is central to the high-redshift limitation.
- [Table 1] The FID values are reported without uncertainties or a comparison baseline, so the statement that the model 'improves' from 300k to 525k steps is only weakly supported. The FID at 525k (132.6) is also considerably higher than the 450k value (119.4), which the text attributes to the random shift; a quantitative check of this explanation would be useful.
- [3.4] The aperture radius r = 30 pixels is fixed, and no sensitivity analysis is provided. Since the variance-ratio values in Table 2 are small and monotonically increasing with magnitude, the result should be shown to be robust to the choice of r.
- [3.4, Appendix C] Appendix C presents visual results at all simulated magnitudes, but no quantitative residual between the posterior mean and the true idealized TNG image is given. A simple metric such as the residual RMS or peak SNR would strengthen the claim that the variance ratio correlates with reconstruction quality.
- [Conclusions and abstract] The abstract states that the method 'reaches resolutions comparable to those obtained by HST images,' while the conclusion is more cautious, saying only that the paper provides a foundation and a metric. The wording should be aligned so that the abstract does not overstate what the current evidence supports.
Circularity Check
No significant circularity: the deconvolution pipeline and variance-ratio metric are defined independently of the claims they support.
full rationale
The paper's derivation chain is not circular. The diffusion posterior sampling algorithm uses a DDPM prior trained on TNG100 idealized images and a forward operator A that encodes redshift-dependent scaling, HSC pixel scale, PSF convolution, and noise; no parameter of A is fitted to the HST images or to the deconvolution outputs. The HST-comparable resolution claim is supported by visual comparison with downsampled HST images, which is weak quantitative evidence but not a circular reduction: the HST images are external data, not inputs to the model. The variance-ratio metric is defined directly as posterior variance divided by prior variance, and the paper validates it by showing that it increases with noise on simulated TNG images with controlled SNR (Table 2). This validation uses the same simulation family as the training prior, so it is an internal-consistency check rather than a fully external test, but it does not fit the metric to the conclusions it supports, nor does any equation reduce to another by construction. There are no load-bearing self-citations: the cited prior works on DPS and score-based models are standard external references, and no uniqueness claim is imported from the authors' own prior work. The main scientific weakness—lack of a quantitative resolution metric for the central HST-comparability claim—is a validation gap, not circularity.
Assumptions & free parameters
free parameters (2)
- Aperture radius r for the variance-ratio metric =
30 pixels
- asinh stretch scale for image normalization =
0.01
assumptions (5)
- standard math The reverse-time SDE with the DPS likelihood approximation p(y|xhat0) is a valid conditional posterior sampler.
- domain assumption HSC observations follow y = A(x) + sigma_y n with Gaussian noise and a known PSF.
- domain assumption Idealized face-on TNG100 galaxies at z near 0.15, 0.17, and 0.18 form a valid prior for real HSC galaxies up to z about 0.85.
- domain assumption Photometric redshifts used to set the scaling fz,p are accurate enough for the reconstruction.
- ad hoc to paper A low posterior-to-prior variance ratio in the galaxy center indicates the absence of hallucination.
Cite this review
Pith. "Pith review of Bayesian Deconvolution of Astronomical Images with Diffusion Models: Quantifying Prior-Driven Features in Reconstructions." pith.science (2026). https://pith.science/paper/7T4JRAAZ
@misc{pith2026241119158,
  author       = {Pith},
  title        = {Pith review of: Bayesian Deconvolution of Astronomical Images with Diffusion Models: Quantifying Prior-Driven Features in Reconstructions},
  year         = {2026},
  howpublished = {\url{https://pith.science/paper/7T4JRAAZ}},
  note         = {Machine review of arXiv:2411.19158}
}
read the original abstract
Deconvolution of astronomical images is a key aspect of recovering the intrinsic properties of celestial objects, especially when considering ground-based observations. This paper explores the use of diffusion models (DMs) and the Diffusion Posterior Sampling (DPS) algorithm to solve this inverse problem task. We apply score-based DMs trained on high-resolution cosmological simulations, through a Bayesian setting to compute a posterior distribution given the observations available. By considering the redshift and the pixel scale as parameters of our inverse problem, the tool can be easily adapted to any dataset. We test our model on Hyper Supreme Camera (HSC) data and show that we reach resolutions comparable to those obtained by Hubble Space Telescope (HST) images. Most importantly, we quantify the uncertainty of reconstructions and propose a metric to identify prior-driven features in the reconstructed images, which is key in view of applying these methods for scientific purposes.
Figures


Figures from the paper (8 more)





Reference graph
Works this paper leans on
-
[1]
A. Adam, A. Coogan, N. Malkin, R. Legin, L. Perreault-Levasseur, Y . D. Hezaveh, and Y . Bengio. Posterior samples of source galaxies in strong gravitational lenses with score-based priors. ArXiv, abs/2211.03812, 2022
arXiv 2022
-
[2]
A. Adam, C. Stone, C. Bottrell, R. Legin, Y . Hezaveh, and L. Perreault-Levasseur. Echoes in the noise: Posterior samples of faint galaxy surface brightness profiles with score-based likelihoods and priors, 2023
work page 2023
-
[3]
H. Aihara, Y . AlSayyad, M. Ando, R. Armstrong, J. F. Bosch, E. Egami, H. Furusawa, J. Furu- sawa, S. Harasawa, Y . Harikane, B. C. Hsieh, H. Ikeda, K. Ito, I. Iwata, T. Kodama, M. Koike, M. Kokubo, Y . Komiyama, X. Li, Y . Liang, Y .-T. Lin, R. H. Lupton, N. B. Lust, L. A. Macarthur, K. Mawatari, S. Mineo, H. Miyatake, S. Miyazaki, S. More, T. Morishima,...
work page 2021
-
[4]
B. D. O. Anderson. Reverse-time diffusion equation models. Stochastic Processes and their Applications, 12:313–326, 1982
work page 1982
-
[5]
M. Bertero, P. Boccacci, and M. Robberto. Inversion method for the restoration of chopped and nodded images. In Astronomical Telescopes and Instrumentation, 1998
work page 1998
-
[6]
C. Bottrell, H. M. Yesuf, G. Popping, K. C. Omori, S. Tang, X. Ding, A. Pillepich, D. Nelson, L. Eisert, H. Gao, A. D. Goulding, B. S. Kalita, W. Luo, J. E. Greene, J. Shi, and J. D. Silverman. Illustristng in the hsc-ssp: image data release and the major role of mini mergers as drivers of asymmetry and star formation. 2023
work page 2023
- [7]
-
[8]
P. Dhariwal and A. Nichol. Diffusion models beat gans on image synthesis. ArXiv, abs/2105.05233, 2021
arXiv 2021
Show all 42 references
-
[9]
B. Efron. Tweedie’s formula and selection bias. Journal of the American Statistical Association, 106:1602 – 1614, 2011
2011
-
[10]
F. K. Gan, K. Bekki, and A. Hashemizadeh. SeeingGAN: Galactic image deblurring with deep learning for better morphological classification of galaxies. arXiv e-prints , page arXiv:2103.09711, Mar. 2021
2021 arXiv
-
[11]
Goodfellow, Y
I. Goodfellow, Y . Bengio, and A. Courville. Deep Learning . MIT Press, 2016. http: //www.deeplearningbook.org
2016
-
[12]
Graikos, N
A. Graikos, N. Malkin, N. Jojic, and D. Samaras. Diffusion models as plug-and-play priors. ArXiv, abs/2206.09012, 2022. 6
2022 arXiv
-
[13]
Heusel, H
M. Heusel, H. Ramsauer, T. Unterthiner, B. Nessler, and S. Hochreiter. Gans trained by a two time-scale update rule converge to a local nash equilibrium. In Neural Information Processing Systems, 2017
2017
-
[14]
J. Ho, A. Jain, and P. Abbeel. Denoising diffusion probabilistic models. ArXiv, abs/2006.11239, 2020
2006 arXiv
-
[15]
Kim and J.-C
K. Kim and J.-C. Ye. Noise2score: Tweedie’s approach to self-supervised image denoising without clean images. In Neural Information Processing Systems, 2021
2021
-
[16]
Lanusse, R
F. Lanusse, R. Mandelbaum, S. Ravanbakhsh, C.-L. Li, P. E. Freeman, and B. Póczos. Deep generative models for galaxy image simulations. Monthly Notices of the Royal Astronomical Society, 504:5543–5555, 2020
2020
-
[17]
Lauritsen, H
L. Lauritsen, H. Dickinson, J. Bromley, S. Serjeant, C.-F. Lim, Z.-K. Gao, and W.-H. Wang. Superresolving Herschel imaging: a proof of concept using Deep Neural Networks. Monthly Notices of the Royal Astronomical Society, 507(1):1546–1556, 07 2021
2021
-
[18]
C. Liu, H. Shum, and W. T. Freeman. Face hallucination: Theory and practice. International Journal of Computer Vision, 75:115–134, 2007
2007
-
[19]
L. B. Lucy. Image restorations of high photometric quality. In R. J. Hanisch and R. L. White, editors, The Restoration of HST Images and Spectra - II, page 79, January 1994
1994
-
[20]
McInnes and J
L. McInnes and J. Healy. Umap: Uniform manifold approximation and projection for dimension reduction. ArXiv, abs/1802.03426, 2018
2018 arXiv
-
[21]
Michalewicz, M
K. Michalewicz, M. Millon, F. Dux, and F. Courbin. Starred: a two-channel deconvolution method with starlet regularization. J. Open Source Softw., 8:5340, 2023
2023
-
[22]
Nelson, V
D. Nelson, V . Springel, A. Pillepich, V . Rodriguez-Gomez, P. Torrey, S. Genel, M. V ogelsberger, R. Pakmor, F. Marinacci, R. Weinberger, L. Z. Kelley, M. R. Lovell, B. Diemer, and L. E. Hernquist. The illustristng simulations: public data release. Computational Astrophysics ...
2018
-
[23]
Nichol and P
A. Nichol and P. Dhariwal. Improved denoising diffusion probabilistic models. ArXiv, abs/2102.09672, 2021
2021 arXiv
-
[24]
A. J. Nishizawa, B. C. Hsieh, M. Tanaka, and T. Takata. Photometric redshifts for the hyper suprime-cam subaru strategic program data release 2. 2020
2020
-
[25]
A. J. Nishizawa, B.-C. Hsieh, M. Tanaka, and the HSC Collaboration. Photometric redshifts for the hyper suprime-cam subaru strategic program data release 3.Publications of the Astronomical Society of Japan, 74:247, 2022. HSC PDR3 photometric data release
2022
-
[26]
Ntampaka, C
M. Ntampaka, C. Avestruz, S. Boada, J. Caldeira, J. Cisewski-Kehe, R. D. Stefano, C. Dvorkin, A. E. Evrard, A. Farahi, D. P. Finkbeiner, S. Genel, A. A. Goodman, A. D. Goulding, S. Ho, A. B. Kosowsky, P. L. Plante, F. Lanusse, M. Lochner, R. Mandelbaum, D. Nagai, J. A. Newman,...
2019
-
[27]
H. E. Robbins. An empirical bayes approach to statistics. 1956
1956
-
[28]
Ronneberger, P
O. Ronneberger, P. Fischer, and T. Brox. U-net: Convolutional networks for biomedical image segmentation. ArXiv, abs/1505.04597, 2015
2015 arXiv
-
[29]
M. L. Sampson and P. Melchior. Spotting hallucinations in inverse problems with data-driven priors. 2023
2023
-
[30]
Schawinski, C
K. Schawinski, C. Zhang, H. Zhang, L. Fowler, and G. K. Santhanam. Generative adversarial networks recover features in astrophysical images of galaxies beyond the deconvolution limit. Monthly Notices of the Royal Astronomical Society: Letters, 467(1):L110–L114, Jan. 2017. 7
2017
-
[31]
Scoville, H
N. Scoville, H. Aussel, M. Brusa, P. L. Capak, C. M. Carollo, M. Elvis, M. Giavalisco, L. Guzzo, G. Hasinger, C. D. Impey, J.-P. Kneib, O. LeFèvre, S. J. Lilly, B. Mobasher, A. Renzini, A. Ren- zini, R. M. Rich, D. B. Sanders, E. Schinnerer, E. Schinnerer, D. Schminovich, P. S...
2006
-
[32]
M. J. Smith, J. E. Geach, R. A. Jackson, N. Arora, C. Stone, and S. Courteau. Realistic galaxy image simulation via score-based generative models.Monthly Notices of the Royal Astronomical Society, 511(2):1808–1818, 01 2022
2022
-
[33]
J. Song, C. Meng, and S. Ermon. Denoising diffusion implicit models. ArXiv, abs/2010.02502, 2020
2010 arXiv
-
[34]
Song and S
Y . Song and S. Ermon. Generative modeling by estimating gradients of the data distribution. In Neural Information Processing Systems, 2019
2019
-
[35]
Song and S
Y . Song and S. Ermon. Improved techniques for training score-based generative models.ArXiv, abs/2006.09011, 2020
2006 arXiv
-
[36]
Y . Song, J. Sohl-Dickstein, D. P. Kingma, A. Kumar, S. Ermon, and B. Poole. Score-based generative modeling through stochastic differential equations, 2021
2021
-
[37]
Starck, E
J.-L. Starck, E. Pantin, and F. Murtagh. Deconvolution in astronomy: A review. Publications of the Astronomical Society of the Pacific, 114:1051 – 1069, 2002
2002
-
[38]
C. M. Stein. Estimation of the mean of a multivariate normal distribution. Annals of Statistics, 9:1135–1151, 1981
1981
-
[39]
Tanaka, J
M. Tanaka, J. Coupon, B. C. Hsieh, S. Mineo, A. J. Nishizawa, J. S. Speagle, H. Furusawa, S. Miyazaki, and H. Murayama. Photometric redshifts for hyper suprime-cam subaru strategic program data release 1. arXiv: Astrophysics of Galaxies, 2017
2017
-
[40]
S. V . Venkatakrishnan, C. A. Bouman, and B. Wohlberg. 5-29-2013 plug-and-play priors for model based reconstruction. IEEE, 2013
2013
-
[41]
V ojtekova, M
A. V ojtekova, M. Lieu, I. Valtchanov, B. Altieri, L. Old, Q. Chen, and F. Hroch. Learning to denoise astronomical images with U-nets. Monthly Notices of the Royal Astronomical Society, 503(3):3204–3215, 11 2020
2020
-
[42]
N. Wang, D. Tao, X. Gao, X. Li, and J. Li. A comprehensive survey to face hallucination. International Journal of Computer Vision, 106:9–30, 2013. A Training details The model used to approximate the score function introduced in Section 2 is the UNet [28] model defined in [23]...
2013
Reviewed August 12, 2026 · model on record in the stance chip above.
Discussion (0). Continue with ORCID to comment.