REVIEW 3 major objections 5 minor 2 cited by
Prospects for gamma-ray emission from magnetar regions in CTAO observations
T0 review · 3 major / 5 minor · reviewed 2026-08-11 · deepseek-v4-flash
Pith's one-line read Simulations indicate CTAO will detect two magnetar regions in five hours, with significances above 10 and 30 sigma.
desk verdict A useful, clearly written CTAO sensitivity forecast for three magnetar regions, but the headline significance claims rest on point-source and spectral-model assumptions that should be tested and caveated. read the letter →
The pith
A machine-rendered reading of the paper's core claim, the machinery that carries it, and where it could break.
The reading
What carries the argument
The machinery is a two-step simulation pipeline. First, a joint likelihood fit combines Fermi-LAT and H.E.S.S. data within 0.2 degrees of each magnetar to fix the source spectrum, choosing between an exponential cutoff power law and a log-parabola model. Second, that spectrum is fed into Gammapy, an open-source package for gamma-ray data analysis, to generate thousands of 1D ON/OFF observations with CTAO's prod5 v0.1 instrument response functions for the northern and southern arrays at several zenith angles; detection significance is computed with the Li & Ma formula. The spectral models are the load-bearing input: they determine both the simulated counts and the sensitivity curves that the paper uses to assess detectability.
What would settle it
A five-hour CTAO observation of CXOU J1714-3810 with the full southern array that finds a mean significance below 10 sigma would directly falsify the paper's central prediction, as would a measured spectral cutoff below about 10 TeV in the SGR 1806-20 region that makes the H.E.S.S. extrapolation invalid.
Extended reading notes
Core claim
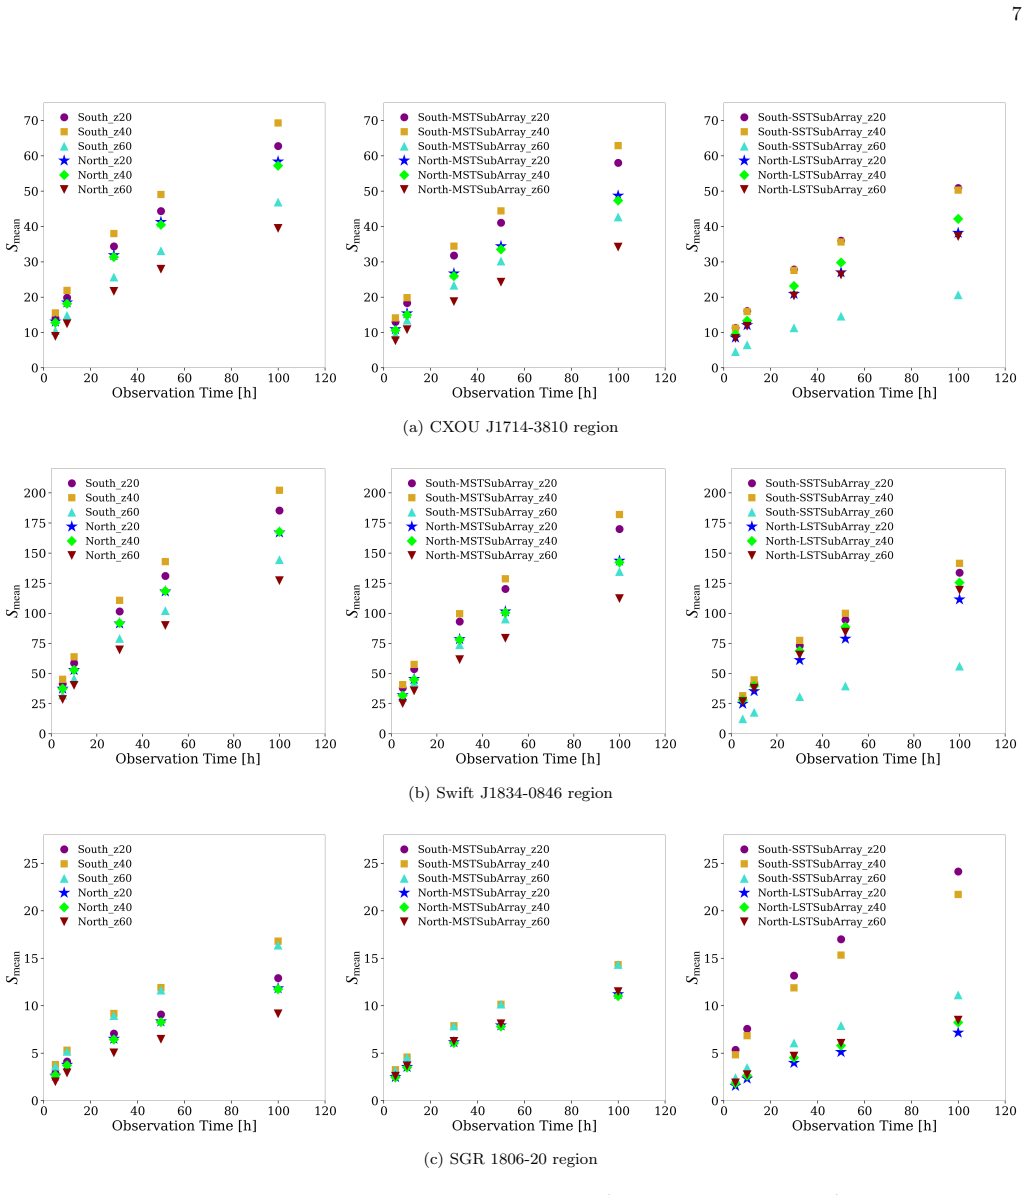
The paper's central claim is that CTAO will detect gamma-ray emission from the regions of CXOU J1714-3810 and Swift J1834-0846 with mean significances above 10 sigma and 30 sigma, respectively, in only five hours of observation with the full southern or northern array. For SGR 1806-20, the same full arrays need roughly 20-30 hours to reach about 5 sigma. These predictions come from a joint likelihood fit of Fermi-LAT and H.E.S.S. data within 0.2 degrees of each magnetar, followed by Poisson-simulated ON/OFF observations using CTAO's instrument response functions. The paper also claims that CTAO will shrink flux uncertainties by factors of 3-4 compared with H.E.S.S. at low and high energies, and will convert the 10 TeV flux upper limits into measurements, refining constraints on spectral curvature.
Load-bearing premise
The predictions rest on the assumption that the spectral models fitted to existing Fermi-LAT and H.E.S.S. data describe the true gamma-ray emission across CTAO's full energy range, including an extrapolation from roughly 0.2-10 TeV to 100 TeV for SGR 1806-20.
Editorial extensions
If this is right
- CTAO's full southern and northern arrays should detect CXOU J1714-3810 and Swift J1834-0846 at high significance in five hours, making follow-up spectroscopy feasible in a single observing run.
- Flux measurements of these regions will be 3-4 times more precise than current H.E.S.S. values, especially above 10 TeV, turning previous upper limits into detections.
- For SGR 1806-20, the best strategy is the southern SST sub-array, but a roughly 5 sigma detection requires 20-30 hours; the spectrum will then be measurable up to about 50 TeV, constraining the curvature that H.E.S.S. alone could not.
- The full South array at 40 degrees zenith gives the highest significances for the first two regions, while the SST sub-array at 20 degrees is optimal for SGR 1806-20, guiding where to point and with which telescope set.
- The predicted spectral resolution around 10 TeV will help discriminate between hadronic and leptonic emission models in these magnetar environments.
Reading between the lines
- The paper does not discuss the possibility that part of the predicted signal could come from neighboring supernova remnants or pulsar wind nebulae rather than the magnetar itself; CTAO's angular resolution will be needed to separate these components.
- The same simulation pipeline could be applied to other Fermi-LAT and H.E.S.S. sources to forecast which CTAO configurations will deliver the fastest detections, effectively building an observing-strategy map.
- The strong preference for the SST sub-array for SGR 1806-20 suggests that hard-spectrum, faint sources may be better served by targeted sub-array observations rather than full-array exposures, a consideration that may generalize beyond magnetars.
- If the predicted significances hold, CTAO will provide the first firm TeV measurements of magnetar regions, which could either confirm magnetar wind nebulae as cosmic-ray contributors or force a rethink of the SNR association.
Editorial analysis
A structured set of objections, weighed in public.
Referee Report
Summary. The paper presents a simulation-based forecast for the detectability of three magnetar regions (CXOU J171405.7-381031, Swift J1834-0846, and SGR 1806-20) with the Cherenkov Telescope Array Observatory (CTAO). The authors fit spectral models to existing Fermi-LAT and H.E.S.S. data within 0.2 degrees of each magnetar, then use Gammapy with CTAO prod5 v0.1 IRFs to simulate 1D ON/OFF observations for various array configurations, zenith angles, and observation times. They report mean Li&Ma significances above 10σ for CXOU J1714-3810 and above 30σ for Swift J1834-0846 within 5 hours, and about 5σ for SGR 1806-20 in 20-30 h, together with sensitivity curves and simulated flux points. The central claim is that CTAO will detect gamma-ray emission from these regions and measure their spectra with substantially smaller uncertainties than current instruments.
Significance. The forecasting approach is standard and reproducible: it uses public CTAO IRFs, open-source Gammapy, and a transparent ON/OFF significance calculation with 3000 trials per configuration. If the adopted spectral models and point-source morphology were correct, the projected significances would be a useful guide for planning CTAO observations of these regions. However, the scientific interpretation is limited because the modeled 'magnetar regions' include substantial emission from associated SNRs and molecular clouds, and the point-source assumption conflicts with the known extended morphology of the TeV counterparts. The main value of the paper is therefore as a sensitivity forecast for the regions, not as a demonstration of magnetar-powered gamma-ray emission.
major comments (3)
- [Section 4] The Gammapy simulations in Section 4 do not specify a spatial model for the sources. The text describes only the spectral models of Table 2 and an ON region of radius 0.2° with an energy-dependent 68% PSF-containment integration radius. Since all three TeV counterparts (HESS J1713-381, HESS J1834-087, and HESS J1808-204) are extended sources, as stated in Section 2, a point-source simulation is not a faithful representation of the true source counts. For sources with extension comparable to the PSF-containment radius, the simulated significances in Fig. 1 will be overestimated. The authors should repeat the analysis using a spatial template, such as the measured Gaussian extent of each H.E.S.S. source, and quantify how the headline 5-hour significances change.
- [Section 3.1 and Section 4] For SGR 1806-20, the CTAO simulation adopts the H.E.S.S. log-parabola model from Table 2, which is constrained only up to about 10 TeV. The predicted high significance of the SST sub-array at high energies (Fig. 1c) depends on an extrapolation to 100 TeV. Since the paper itself states that no single model fits all the Fermi-LAT and H.E.S.S. data for this region, the model uncertainty is large. The authors should evaluate how the projected significances vary when the high-energy spectrum is steepened or cut off, or restrict the forecast to the energy range where the H.E.S.S. model is actually constrained.
- [Section 5 and Figure 6] The claim of improved flux accuracy compared to H.E.S.S. is based on flux points from a single simulated observation selected to be close to the mean significance. Although this is a reasonable choice for illustration, the reported factor-of-2-4 improvements in error bars are not demonstrated to be typical. The authors should show the distribution of flux uncertainties across the 3000 simulations, or at least provide error bars from several representative realizations.
minor comments (5)
- [Title and Abstract] The title contains 'CT AO' instead of 'CTAO', and the abstract contains 'CXOUJ1714-3810' without a space; these should be corrected.
- [Section 2.1] The phrase 'youngest known anomalous X-ray pulsar' is used, but the text states a characteristic age of about 950 years; please clarify whether this age refers to the pulsar or the SNR and ensure consistency.
- [Section 3.2] The observation times are listed as 'tobs = (0.5, ,5.0, ,50.0)' with stray commas; this should be cleaned up.
- [Figure 2 caption] The caption says 'right, middle, and left panels' when the conventional order is left to right; please reorder the description for clarity.
- [References] The reference style for the H.E.S.S. collaboration is inconsistent ('H. E. S. S. Collaboration' vs. 'H.E.S.S. Collaboration'); please unify.
Circularity Check
No definitional circularity: the CTAO significance forecasts are forward-simulated from spectra fitted to external Fermi-LAT and H.E.S.S. data, with only a minor non-load-bearing self-citation.
full rationale
The paper's derivation chain is not circular in the sense of the seven enumerated patterns. The spectral models in Table 2 are obtained from a joint likelihood fit to external Fermi-LAT and H.E.S.S. observations (Section 3.1), not from the CTAO results being predicted. The CTAO simulations in Section 4 then inject those fitted models into Gammapy with public CTAO IRFs to compute expected counts and Li&Ma significances; this is a forward instrument-response calculation, so the output is conditional on the input spectra rather than being secretly fitted to the output. The agreement between simulated flux points and the input model in Figure 5 is a self-consistency closure test, and the paper is transparent that all simulated observations are 'based on the spectral models detailed in Table 2.' The only self-citation is Costa et al. (2024), which supplies the joint-likelihood and 1D ON/OFF analysis workflow; this is a standard Gammapy-based method and is not invoked as a uniqueness theorem or used to forbid alternatives, so it is not load-bearing in a circular way. Concerns about source extent, spectral extrapolation (especially for SGR 1806-20), and unmodeled SNR/PWN contamination are correctness or robustness risks, not circularity: they affect whether the assumed input model is true, not whether the simulation step reduces to its own input. The headline 'will detect' statements are conditional forecasts; if the fitted spectra are wrong, the predicted significances change, but the logic of the forecast is not self-referential.
Assumptions & free parameters
free parameters (10)
- CXOU J171405-381031 log-parabola normalization Phi0 =
8.90e-13 cm^-2 s^-1 TeV^-1
- CXOU J171405-381031 log-parabola index Gamma =
2.482 ± 0.08
- CXOU J171405-381031 log-parabola curvature beta =
0.071 ± 0.02
- Swift J1834-0846 exponential cutoff power-law normalization Phi0 =
3.51e-14 cm^-2 s^-1 TeV^-1
- Swift J1834-0846 exponential cutoff power-law index Gamma =
2.098 ± 0.02
- Swift J1834-0846 exponential cutoff lambda =
0.184 ± 0.07 TeV^-1
- SGR 1806-20 H.E.S.S. log-parabola normalization Phi0 =
1.10e-15 cm^-2 s^-1 TeV^-1
- SGR 1806-20 H.E.S.S. log-parabola index Gamma =
2.583 ± 0.17
- SGR 1806-20 H.E.S.S. log-parabola curvature beta =
0.090 (no uncertainty given)
- SGR 1806-20 Fermi-LAT log-parabola parameters =
Gamma=3.465 ± 0.23, Phi0=4.54e-15, beta=0.062 ± 0.018
assumptions (5)
- standard math Li and Ma significance formula and Poisson statistics apply to the simulated ON/OFF counts
- domain assumption All catalog counterparts within 0.2 degrees of each magnetar belong to the same gamma-ray emission region
- domain assumption CTAO prod5 v0.1 instrument response functions accurately represent the future observatory's performance
- domain assumption The fitted spectra remain valid over CTAO's full energy range, including extrapolation beyond the fitted range
- domain assumption The reflected background method with alpha = 0.1 and a 68% PSF containment radius provides an unbiased background estimate
Cite this review
Pith. "Pith review of Prospects for gamma-ray emission from magnetar regions in CTAO observations." pith.science (2026). https://pith.science/paper/3MIGIRD3
@misc{pith2026241202860,
  author       = {Pith},
  title        = {Pith review of: Prospects for gamma-ray emission from magnetar regions in CTAO observations},
  year         = {2026},
  howpublished = {\url{https://pith.science/paper/3MIGIRD3}},
  note         = {Machine review of arXiv:2412.02860}
}
abstract
Recent multi-wavelength observations have highlighted magnetars as significant sources of cosmic rays, particularly through their gamma-ray emissions. This study examines three magnetar regions - CXOU J171405.7-31031, Swift J1834-0846, and SGR 1806-20 - known for emitting detectable electromagnetic signals. We assess the detectability of these regions using the upcoming Cherenkov Telescope Array Observatory (CTAO) by conducting an ON/OFF spectral analysis and compare the expected results with existing observations. Our findings indicate that CTAO will detect gamma-ray emissions from these three magnetar regions with significantly reduced emission flux errors compared to current instruments. In special, the study shows that the CXOUJ1714-3810 and SwiftJ1834-0846 magnetar regions can be observed by the full southern and northern CTAO arrays in just five hours of observation, with mean significances above $10 \,\sigma$ and $30 \,\sigma$, respectively. This paper discusses the regions analyzed, presents key results, and concludes with insights drawn from the study.
Figures


Figures from the paper (3 more)


Forward citations
Cited by 2 Pith papers
-
Multiwavelength study of non-thermal emission in the Swift J1834.9-0846/W41 region
Modeling favors a lepto-hadronic supernova remnant for the extended TeV emission from HESS J1834-087 plus a leptonic magnetar wind nebula for the central point-like source, with an implied magnetar birth spin period b...
-
Non-thermal emission from the vicinity of the magnetar CXOU J171405.7-381031
Both leptonic and lepto-hadronic models fit the CTB 37B gamma-ray spectrum; neutral-pion decay matches above ~10 TeV but needs ~10^51 erg in protons unless the remnant hits dense gas.
Reference graph
Works this paper leans on
-
[1]
2022, ApJS, 260, 53, doi: 10.3847/1538-4365/ac6751 Abdul Halim, A., Abreu, P., Aglietta, M., et al
Abdollahi, S., Acero, F., Baldini, L., et al. 2022, ApJS, 260, 53, doi: 10.3847/1538-4365/ac6751 Abdul Halim, A., Abreu, P., Aglietta, M., et al. 2023, ApJS, 264, 50, doi: 10.3847/1538-4365/aca537 —. 2024, JCAP, 2024, 022, doi: 10.1088/1475-7516/2024/01/022
-
[2]
2015, ApJS, 218, 23, doi: 10.1088/0067-0049/218/2/23
Acero, F., Ackermann, M., Ajello, M., et al. 2015, ApJS, 218, 23, doi: 10.1088/0067-0049/218/2/23
-
[3]
Ackermann, M., Ajello, M., Atwood, W. B., et al. 2016, ApJS, 222, 5, doi: 10.3847/0067-0049/222/1/5
-
[4]
2019, Nature Astronomy, 3, 561, doi: 10.1038/s41550-019-0724-0
Aharonian, F., Yang, R., & de O˜ na Wilhelmi, E. 2019, Nature Astronomy, 3, 561, doi: 10.1038/s41550-019-0724-0
-
[5]
Aharonian, F., Akhperjanian, A. G., Aye, K. M., et al. 2005, Science, 307, 1938, doi: 10.1126/science.1108643
-
[6]
Aharonian, F., Akhperjanian, A. G., Bazer-Bachi, A. R., et al. 2006, ApJ, 636, 777, doi: 10.1086/498013
doi:10.1086/498013 2006
-
[7]
G., Barres de Almeida, U., et al
Aharonian, F., Akhperjanian, A. G., Barres de Almeida, U., et al. 2008, A&A, 486, 829, doi: 10.1051/0004-6361:200809655
-
[8]
Ajello, M., Atwood, W. B., Baldini, L., et al. 2017, ApJS, 232, 18, doi: 10.3847/1538-4365/aa8221
Show all 48 references
-
[9]
B., Abdo, A
Atwood, W. B., Abdo, A. A., Ackermann, M., et al. 2009, The Astrophysical Journal, 697, 1071, doi: 10.1088/0004-637X/697/2/1071
2009 doi
- [10]
-
[11]
2007, A&A, 466, 1219, doi: 10.1051/0004-6361:20066674
Berge, D., Funk, S., & Hinton, J. 2007, A&A, 466, 1219, doi: 10.1051/0004-6361:20066674
2007 doi
-
[12]
L., Crowther, P
Bibby, J. L., Crowther, P. A., Furness, J. P., & Clark, J. S. 2008, Monthly Notices of the Royal Astronomical Society, 386, L23, doi: 10.1111/j.1745-3933.2008.00453.x
2008
-
[13]
2013, A&A Rv, 21, 70, doi: 10.1007/s00159-013-0070-7
Blasi, P. 2013, A&A Rv, 21, 70, doi: 10.1007/s00159-013-0070-7
2013 doi
-
[14]
2023, Annual Review of Nuclear and Particle Science, 73, 341, doi: 10.1146/annurev-nucl-112822-025357
Cao, Z., Chen, S., Liu, R., & Yang, R. 2023, Annual Review of Nuclear and Particle Science, 73, 341, doi: 10.1146/annurev-nucl-112822-025357
2023 doi
-
[15]
2024, ApJS, 271, 25, doi: 10.3847/1538-4365/acfd29 Cherenkov Telescope Array Consortium, Acharya, B
Cao, Z., Aharonian, F., An, Q., et al. 2024, ApJS, 271, 25, doi: 10.3847/1538-4365/acfd29 Cherenkov Telescope Array Consortium, Acharya, B. S.,
2024 doi
-
[16]
2019, Science with the Cherenkov Telescope Array (World Scientific), doi: 10.1142/10986
Agudo, I., et al. 2019, Science with the Cherenkov Telescope Array (World Scientific), doi: 10.1142/10986
2019 doi
-
[17]
G., & Dos Anjos, R
Coelho, J. G., & Dos Anjos, R. C. 2023, Galaxies, 11, 48, doi: 10.3390/galaxies11020048
2023 doi
-
[18]
G., Padilha, L
Coelho, J. G., Padilha, L. N., dos Anjos, R. C., Ventura, C. V., & Carvalho, G. A. 2022, Journal of Cosmology and Astroparticle Physics, 2022, 041, doi: 10.1088/1475-7516/2022/10/041
2022 doi
-
[19]
Mello, A. J. T. S. 2024, A gamma ray study of Galactic PeVatron candidates LHAASO J1825-1236 and J1839-0545. https://arxiv.org/abs/2311.12005 C.T.A. Observatory, & Consortium, C. T. A. 2021, CTAO Instrument Response Functions - prod5 version v0.1, v0.1, Zenodo, doi: 10.5281/ze...
2024 arXiv
-
[20]
2023, A&A, 678, A157, doi: 10.1051/0004-6361/202346488 dos Anjos, R
Donath, A., Terrier, R., Remy, Q., et al. 2023, A&A, 678, A157, doi: 10.1051/0004-6361/202346488 dos Anjos, R. C., Coelho, J. G., Pereira, J. P., & Catalani, F. 2021, Journal of Cosmology and Astroparticle Physics, 2021, 023, doi: 10.1088/1475-7516/2021/10/023
2023 doi
- [21]
-
[22]
Ferenc, D. 2005, Nuclear Instruments and Methods in Physics Research Section A: Accelerators, Spectrometers, Detectors and Associated Equipment, 553, 274, doi: https://doi.org/10.1016/j.nima.2005.08.085
2005 doi
-
[23]
2017, Monthly Notices of the Royal Astronomical Society, 464, 4895, doi: 10.1093/mnras/stw2554 H
Granot, J., Gill, R., Younes, G., et al. 2017, Monthly Notices of the Royal Astronomical Society, 464, 4895, doi: 10.1093/mnras/stw2554 H. E. S. S. Collaboration, Abdalla, H., Abramowski, A., et al. 2018, A&A, 612, A1, doi: 10.1051/0004-6361/201732098
2017 doi
-
[24]
P., & Gotthelf, E
Halpern, J. P., & Gotthelf, E. V. 2010a, The Astrophysical Journal, 725, 1384, doi: 10.1088/0004-637X/725/1/1384 —. 2010b, The Astrophysical Journal, 710, 941, doi: 10.1088/0004-637X/710/2/941
-
[25]
2019, Frontiers in Astronomy and Space Sciences, 6, 32, doi: 10.3389/fspas.2019.00032
Halzen, F., & Kheirandish, A. 2019, Frontiers in Astronomy and Space Sciences, 6, 32, doi: 10.3389/fspas.2019.00032
2019
-
[26]
K., & Lai, D
Harding, A. K., & Lai, D. 2006, Reports on Progress in Physics, 69, 2631, doi: 10.1088/0034-4885/69/9/R03 H.E.S.S. Collaboration, Abdalla, H., Abramowski, A., et al. 2018, A&A, 612, A11, doi: 10.1051/0004-6361/201628695
2006 doi
-
[27]
S., Gill, R., & Hernquist, L
Heyl, J. S., Gill, R., & Hernquist, L. 2010, MNRAS, 406, L25, doi: 10.1111/j.1745-3933.2010.00874.x
2010
-
[28]
E., Smith, D
Hurley, K., Boggs, S. E., Smith, D. M., et al. 2005, Nature, 434, 1098, doi: 10.1038/nature03519 14
2005 doi
-
[29]
G., et al
Kargaltsev, O., Kouveliotou, C., Pavlov, G. G., et al. 2012, The Astrophysical Journal, 748, 26, doi: 10.1088/0004-637X/748/1/26
2012 doi
-
[30]
2024, MNRAS, 531, 3297, doi: 10.1093/mnras/stae901
Kumar, A., Sharma, K., Vink´ o, J., et al. 2024, MNRAS, 531, 3297, doi: 10.1093/mnras/stae901
2024 doi
-
[31]
A., & Tian, W
Leahy, D. A., & Tian, W. W. 2008, The Astronomical Journal, 135, 167, doi: 10.1088/0004-6256/135/1/167
2008 doi
- [32]
-
[33]
2011, Advances in Space Research, 47, 1317, doi: 10.1016/j.asr.2010.08.031
Mereghetti, S. 2011, Advances in Space Research, 47, 1317, doi: 10.1016/j.asr.2010.08.031
2011 doi
-
[34]
Mocellin, A. G. B., & Anjos, R. C. 2022, Acta Phys. Polon. Supp., 15, 16, doi: 10.5506/APhysPolBSupp.15.3-A16
2022 doi
-
[35]
E., Mihara, T., Yoshida, A., et al
Nakagawa, Y. E., Mihara, T., Yoshida, A., et al. 2009, PASJ, 61, S387, doi: 10.1093/pasj/61.sp1.S387
2009 doi
-
[36]
2009, PASJ, 61, S197, doi: 10.1093/pasj/61.sp1.S197
Nakamura, R., Bamba, A., Ishida, M., et al. 2009, PASJ, 61, S197, doi: 10.1093/pasj/61.sp1.S197
2009 doi
-
[37]
A., & Kaspi, V
Olausen, S. A., & Kaspi, V. M. 2014, ApJS, 212, 6, doi: 10.1088/0067-0049/212/1/6
2014 doi
-
[38]
Coelho, J. G. 2024, PhRvL, 132, 091401, doi: 10.1103/PhysRevLett.132.091401
2024 doi
-
[39]
Sasse, R., & Anjos, R. C. 2022, Acta Phys. Polon. Supp., 15, 15, doi: 10.5506/APhysPolBSupp.15.3-A15
2022 doi
-
[40]
2010, Publications of the Astronomical Society of Japan, 62, L33, doi: 10.1093/pasj/62.5.L33
Sato, T., Bamba, A., Nakamura, R., & Ishida, M. 2010, Publications of the Astronomical Society of Japan, 62, L33, doi: 10.1093/pasj/62.5.L33
2010 doi
-
[41]
P., Cameron, P
Tendulkar, S. P., Cameron, P. B., & Kulkarni, S. R. 2012, ApJ, 761, 76, doi: 10.1088/0004-637X/761/1/76
2012 doi
-
[42]
Thompson, C., & Duncan, R. C. 1995, MNRAS, 275, 255, doi: 10.1093/mnras/275.2.255
1995 doi
-
[43]
2017, Nuovo Cimento C Geophysics Space Physics C, 40, 126, doi: 10.1393/ncc/i2017-17126-2
Vianello, G. 2017, Nuovo Cimento C Geophysics Space Physics C, 40, 126, doi: 10.1393/ncc/i2017-17126-2
2017 doi
-
[44]
2023, MNRAS, 519, 136, doi: 10.1093/mnras/stac3469
Vieu, T., & Reville, B. 2023, MNRAS, 519, 136, doi: 10.1093/mnras/stac3469
2023 doi
-
[45]
2002, Astroparticle Physics, 17, 221, doi: https://doi.org/10.1016/S0927-6505(01)00152-9
Weekes, T., Badran, H., Biller, S., et al. 2002, Astroparticle Physics, 17, 221, doi: https://doi.org/10.1016/S0927-6505(01)00152-9
2002 doi
-
[46]
2014, Advances in Space Research, 53, 1492, doi: 10.1016/j.asr.2013.03.016
Westerhoff, S. 2014, Advances in Space Research, 53, 1492, doi: 10.1016/j.asr.2013.03.016
2014 doi
-
[47]
M., Kouveliotou, C., Finger, M
Woods, P. M., Kouveliotou, C., Finger, M. H., et al. 2007, The Astrophysical Journal, 470, doi: 10.1086/507459
2007 doi
-
[48]
2016, ApJ, 817, 64, doi: 10.3847/0004-637X/817/1/64
Xin, Y.-L., Liang, Y.-F., Li, X., et al. 2016, ApJ, 817, 64, doi: 10.3847/0004-637X/817/1/64
2016 doi
Reviewed August 11, 2026 · model on record in the stance chip above.
Discussion (0). Continue with ORCID to comment.