REVIEW 4 major objections 8 minor 65 references
NeRF-NQA: No-Reference Quality Assessment for Scenes Generated by NeRF and Neural View Synthesis Methods
T0 review · 4 major / 8 minor · reviewed 2026-08-11 · deepseek-v4-flash
Pith's one-line read NeRF-NQA is the first no-reference quality assessment method for dense-view scenes synthesized by NeRF and other neural view synthesis methods, reporting consistent performance gains over 23 existing image, video, and light-field metrics…
desk verdict Plausible first no-reference NVS quality metric with a genuinely new angular feature, but the 'significant superiority' claim needs statistical support before it can be taken at face value. read the letter →
The pith
A machine-rendered reading of the paper's core claim, the machinery that carries it, and where it could break.
The reading
What carries the argument
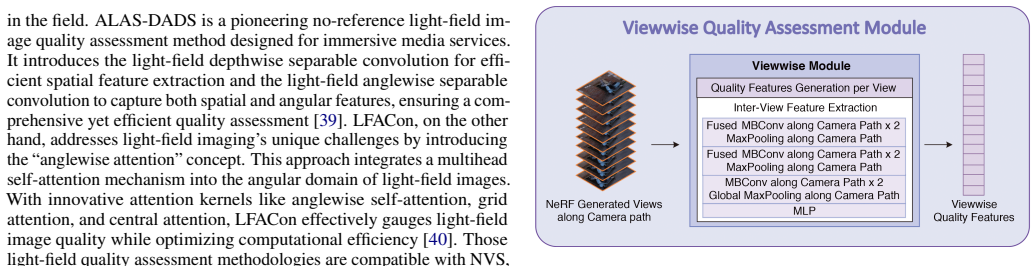
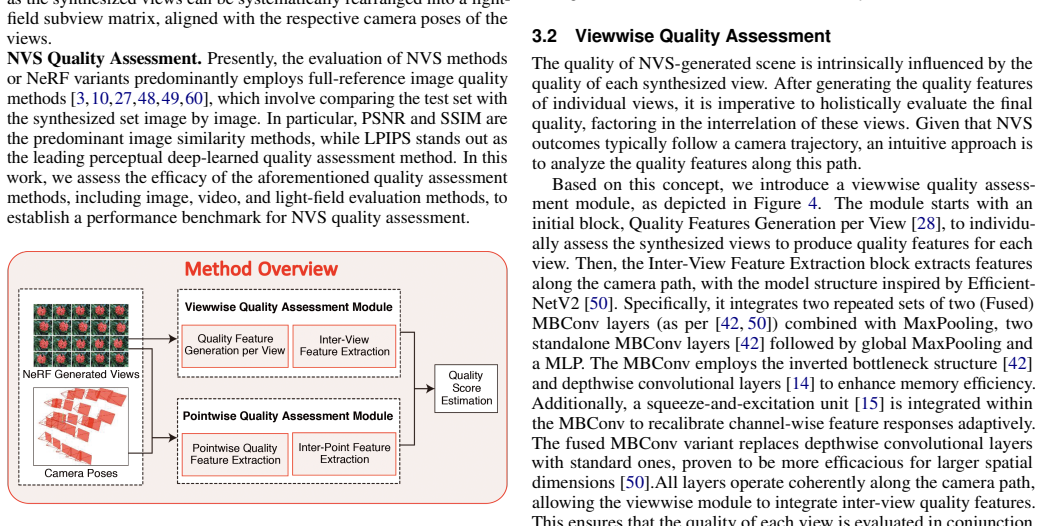
The load-bearing object is the Pointwise Normalized Spherical Gradient (PNSG): for a surface point $p$ and two pixels $x_i, x_j$ observing it from different views, the normalized spherical gradient is $\mathrm{NSG}(x_i,x_j)=(I(x_i)-I(x_j))/\measuredangle x_i p x_j$, the RGB change per unit angular separation. Aggregating these gradients over azimuthal and polar bins for many surface points yields a feature that encodes how consistently the scene appears from different directions, which is exactly the angular quality that per-image metrics cannot see. The viewwise module supplies the complementary spatial signal: per-view quality features, produced by an EfficientNetV2-style backbone, are processed along the camera path with (Fused) MBConv layers and max pooling so that inter-view consistency enters the score. The final quality score is a learned MLP fusion of the two feature streams.
What would settle it
Run NeRF-NQA on a new set of dense-view scenes, including 360-degree scenes and outputs from methods not in the training set, with freshly collected human opinion scores from a different group of observers, and compare SRCC and PLCC; if NeRF-NQA no longer ranks first or its correlations drop markedly, the claimed superiority and no-reference generalization are not established.
Extended reading notes
Core claim
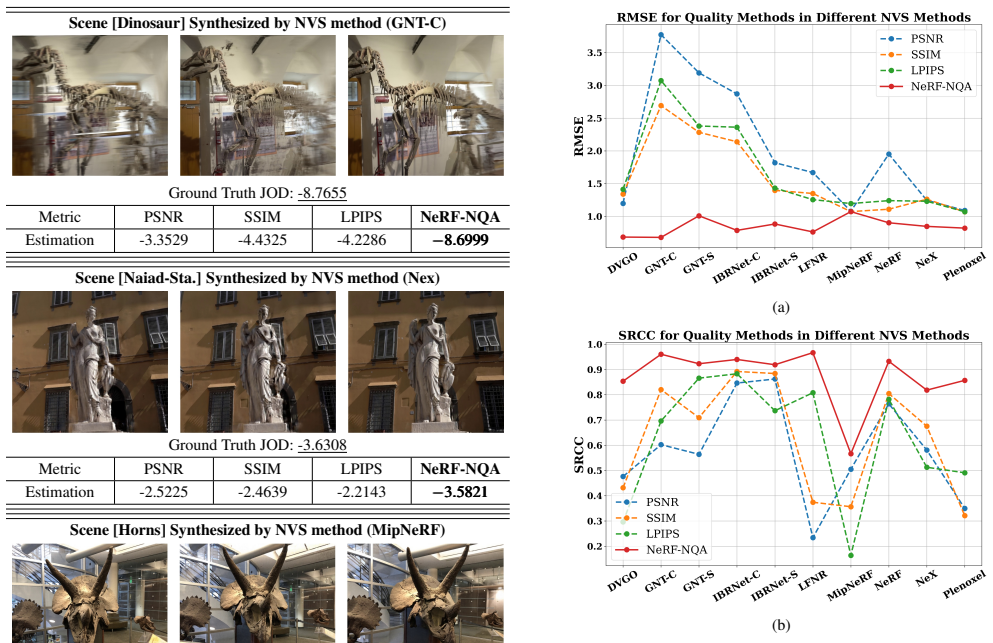
On the paper's own terms, the central discovery is that no-reference quality assessment for NVS scenes becomes accurate when spatial and angular evidence are combined. The viewwise module scores each synthesized frame and then reads quality along the camera path, capturing whether adjacent views stay consistent. The pointwise module samples sparse surface points with COLMAP, collects the pixels from different views that observe each point, and computes Pointwise Normalized Spherical Gradients (PNSG), i.e., pixel-value differences divided by the angular separation between viewing directions; high gradients at a surface point indicate angular inconsistency and thus perceived distortion. An MLP fuses the two feature streams into a JOD-scaled quality score. The paper reports that this joint design cuts RMSE by 33.0%, 34.9%, and 20.0% against the second-best baseline on Fieldwork, LLFF, and Lab respectively, and that it also wins on most individual scenes and NVS methods and in cross-dataset tests.
Load-bearing premise
The entire claim of superiority rests on the human quality labels from one subjective study being accurate and representative; if those labels are noisy or biased, the reported performance gains over other metrics would not generalise.
Editorial extensions
If this is right
- If the reported results hold, NVS quality can be assessed without any reference views, so datasets like LLFF that provide only sparse captures become fully evaluable.
- Because both per-view and cross-view artifacts are penalized, NeRF-NQA should be a stronger predictor of human preference than single-image metrics, especially for blur and artifacts visible only across an image sequence.
- The same trained model transfers across datasets, trained on two and tested on the third, without scene-specific fine-tuning, which the paper reports as consistent gains over baselines.
- Scene- and method-level analyses show the largest wins on complex shapes and specular surfaces, where conventional metrics are weakest.
- A practical consequence is that immersive VR/AR content rendered from neural view synthesis can be monitored for quality at runtime without storing reference imagery.
Reading between the lines
- Because NeRF-NQA reads only synthesized views and camera poses, the same machinery should extend to any dense-view renderer, including 3D Gaussian Splatting and other rasterizers, despite being trained only on NeRF-family outputs; this is an extension the paper names as future work rather than a demonstrated result.
- The PNSG signal could be reused as a diagnostic for view consistency in multi-view reconstruction tasks beyond quality scoring, such as detecting floaters or flicker in free-viewpoint video, though the paper does not test this.
- The reliance on COLMAP sparse points could be replaced by depth or ray-marching information from the renderer itself, which would help in textureless or specular scenes where structure-from-motion points are scarce; the paper only argues empirically that the current reliance is not fatal.
- A larger subjective study with more scenes and observers, including 360-degree content, would be the natural stress test; if NeRF-NQA's margin shrinks on that data, the method's generality would need to be revised.
Editorial analysis
A structured set of objections, weighed in public.
Referee Report
Summary. The paper proposes NeRF-NQA, a no-reference quality assessment method for densely observed scenes synthesized by NeRF and other neural view synthesis methods. It combines a viewwise module that extracts per-view spatial quality features and inter-view consistency along the camera path with a pointwise module that computes normalized spherical gradients over COLMAP surface points and aggregates them with PointNet; the two feature streams are fused by an MLP to predict a JOD score. The method is trained and tested on the Lab, LLFF, and Fieldwork datasets using subjective JOD labels from Liang et al. [23], and it is compared with 23 image, video, and light-field quality assessment methods under RMSE, SRCC, PLCC, and outlier-ratio metrics, including held-out-scene and cross-dataset protocols. The central claim is that NeRF-NQA significantly outperforms all existing methods and is the first no-reference method for this setting.
Significance. The task is timely and practically relevant: NVS systems are increasingly used to generate dense viewpoint content, and no-reference quality assessment for such content is genuinely underdeveloped. The paper's pointwise angular-quality idea, embodied in the PNSG feature, is a sensible and nontrivial contribution, and the comparison against 23 established methods is broad. The release of an implementation is also a strength. If the reported gains were accompanied by proper statistical support, this would be a useful paper for the NVS and quality-assessment communities. However, as written, the central claim of 'significant' superiority rests entirely on point estimates over very small test sets, with no confidence intervals, significance tests, or repeated-split variance, and one of the three datasets shows a large RMSE regression when the pointwise module is added.
major comments (4)
- [§4.6, Table 2; Abstract] The abstract and Section 4.6 claim that NeRF-NQA 'outperforms the existing assessment methods significantly' and shows 'substantial superiority,' but these claims are supported only by point estimates computed over four test scenes per dataset, with tenfold surface sampling that does not create independent scenes. No confidence intervals, bootstrap estimates, per-split variance, or significance tests are reported anywhere in the manuscript. Because the headline gains in Table 2 could change with a different random scene split, the authors should provide repeated-split results, bootstrap confidence intervals over scenes, or a paired significance test across scenes/methods, and they should temper the word 'significantly' unless such a procedure supports it.
- [Table 1, §4.5] The ablation study in Table 1 does not support the claim that the pointwise module is consistently beneficial. On the Fieldwork dataset, adding the pointwise module increases RMSE from 0.9202 to 1.1969, a roughly 30% regression, even though SRCC improves from 0.9343 to 0.9701. The text states that 'with the exception of RMSE on the Fieldwork dataset, where the results are closely aligned,' but a 0.28 difference on this scale is not close, and the full model's Fieldwork RMSE of 1.1969 is the very number used as a headline result in Table 2. The authors need to explain this trade-off, report which metric is primary, or show that the RMSE regression is not systematic before claiming that the pointwise design is validated.
- [§4.2, §5, Table 2] The ground-truth labels are JOD scores from a single subjective campaign with 39 volunteers, and NeRF-NQA is trained and tested on scenes from that same campaign. While the held-out-scene split prevents direct circularity, the paper provides no analysis of label reliability: there are no bootstrap confidence intervals for the JOD values, no observer-variability metrics, and no independent perceptual benchmark. Since every ranking in Tables 2-6 is measured against these labels, the authors should report the uncertainty in the ground truth (e.g., by bootstrapping the pairwise-comparison data) or evaluate on an external subjective dataset. The Limitation section should also acknowledge this dependence rather than only listing 360-degree scenes and 3DGS as future work.
- [§4.9, Table 6] The caption of Table 6 says that 'each method is trained on two datasets and tested on the third,' but this cannot be true for the full-reference methods, which are not trainable, and it is unclear whether the no-reference baselines were retrained or used with default weights. This ambiguity matters for the fairness of the cross-dataset comparison, especially because FR-IQA methods that use references from the test set are compared with a method that sees no references. Please clarify the exact training protocol for each baseline and, if no-reference baselines were not retrained, state that explicitly.
minor comments (8)
- [Abstract] The sentence 'using a image set' should read 'using an image set.'
- [§4.3] The phrase 'The implementation replied on the PyTorch' should read 'The implementation relied on PyTorch.'
- [§3.3] The PNSG description mixes terminology: it says the polar axis is partitioned into bins but then refers to a 'specific azimuthal bin,' and the notation NSGazi/NSGpol could be defined more clearly. Please align the axis names and bin indices.
- [§4.2, Figure 7] The term 'Just-Objectionable-Difference' in Section 4.2 and 'Just-Noticeable Differences' in the Figure 7 caption should be harmonized, preferably with the terminology used in the original subjective study [23].
- [Tables 1-4] Several table cells in the supplied text show repeated digit strings such as '0.92020.92020.9202' and '1.19691.19691.1969.' Please ensure the final PDF renders single values and that the source tables do not contain duplicated numeric tokens.
- [Figure 6] The scatter plots have no labeled axes and no legend for the scene markers; adding axis labels, units (JOD vs. predicted score), and a legend would make the figure interpretable.
- [§4.1] The paper says four scenes are randomly designated for testing in each dataset, but no random seed or explicit split is provided. Releasing the exact scene split (or seeds) would make the results reproducible.
- [References] Reference [23] is cited as an arXiv preprint even though the paper's header shows a TVCG publication with a DOI; please cite the published version.
Circularity Check
No circularity: the prediction target is an external subjective label and the evaluation uses held-out and cross-dataset protocols.
full rationale
The paper's central claim is an empirical superiority claim: NeRF-NQA is trained to regress JOD ground-truth labels from Liang et al. [23] and then compared with 23 existing quality assessment methods. This is a standard supervised learning setup, not a derivation that assumes its own conclusion. The features are computed from the input: the viewwise module extracts features from synthesized views, and the pointwise module computes PNSG features directly from views and camera poses via Eqs. (1)-(3); no fitted constant is renamed as a prediction. The evaluation uses held-out scenes ('we randomly designate four scenes for testing, while the remaining scenes are allocated for training', Section 4.1) and a cross-dataset protocol in Section 4.9, so the predictions are not forced by construction. The paper's self-citations to the authors' prior light-field quality assessment works [39,40] are used as related-work context, baselines, and a source for the general notion of angular quality, but they are not used as a uniqueness theorem or as the justification for the reported superiority; the advantage over those baselines is an empirical result. The weaknesses identified by a skeptical reader (single subjective dataset, no significance testing, small number of test scenes, and the Table 1 Fieldwork RMSE inconsistency) are validity and reporting concerns, not circularity. No load-bearing step reduces to the paper's own inputs or to a self-citation chain, so the circularity score is 0.
Assumptions & free parameters
free parameters (3)
- Number of angular bins b in PNSG =
not reported
- Number of sampled surface points per scene =
not reported
- Training epochs and batch size =
200 epochs, batch size 10
assumptions (4)
- domain assumption The JOD labels from Liang et al. [23] are valid ground-truth perceptual quality scores.
- domain assumption COLMAP sparse points and camera poses are available and reliable for NVS scenes.
- domain assumption The gradient approximation in Equation (1) between adjacent pixels estimates angular quality.
- domain assumption EfficientNetV2, MBConv, PointNet, and MLP are standard components that can be used as feature extractors.
Cite this review
Pith. "Pith review of NeRF-NQA: No-Reference Quality Assessment for Scenes Generated by NeRF and Neural View Synthesis Methods." pith.science (2026). https://pith.science/paper/M6X54TLI
@misc{pith2026241208029,
  author       = {Pith},
  title        = {Pith review of: NeRF-NQA: No-Reference Quality Assessment for Scenes Generated by NeRF and Neural View Synthesis Methods},
  year         = {2026},
  howpublished = {\url{https://pith.science/paper/M6X54TLI}},
  note         = {Machine review of arXiv:2412.08029}
}
read the original abstract
Neural View Synthesis (NVS) has demonstrated efficacy in generating high-fidelity dense viewpoint videos using a image set with sparse views. However, existing quality assessment methods like PSNR, SSIM, and LPIPS are not tailored for the scenes with dense viewpoints synthesized by NVS and NeRF variants, thus, they often fall short in capturing the perceptual quality, including spatial and angular aspects of NVS-synthesized scenes. Furthermore, the lack of dense ground truth views makes the full reference quality assessment on NVS-synthesized scenes challenging. For instance, datasets such as LLFF provide only sparse images, insufficient for complete full-reference assessments. To address the issues above, we propose NeRF-NQA, the first no-reference quality assessment method for densely-observed scenes synthesized from the NVS and NeRF variants. NeRF-NQA employs a joint quality assessment strategy, integrating both viewwise and pointwise approaches, to evaluate the quality of NVS-generated scenes. The viewwise approach assesses the spatial quality of each individual synthesized view and the overall inter-views consistency, while the pointwise approach focuses on the angular qualities of scene surface points and their compound inter-point quality. Extensive evaluations are conducted to compare NeRF-NQA with 23 mainstream visual quality assessment methods (from fields of image, video, and light-field assessment). The results demonstrate NeRF-NQA outperforms the existing assessment methods significantly and it shows substantial superiority on assessing NVS-synthesized scenes without references. An implementation of this paper are available at https://github.com/VincentQQu/NeRF-NQA.
Figures


Figures from the paper (4 more)


Reference graph
Works this paper leans on
-
[23]
Perceptual Quality Assessment of NeRF and Neural View Synthesis Methods for Front-Facing Views
H. Liang, T. Wu, P. Hanji, F. Banterle, H. Gao, R. Mantiuk, and C. Oztireli. Perceptual quality assessment of nerf and neural view synthesis methods for front-facing views. arXiv preprint arXiv:2303.15206, 2023. 4
work page Pith review arXiv 2023
-
[1]
D. Andersen and V . Popescu. An ar-guided system for fast image-based modeling of indoor scenes. In 2018 IEEE Conference on Virtual Reality and 3D User Interfaces (VR), pp. 501–502. IEEE, 2018. 1
work page 2018
-
[2]
A. Balanov, A. Schwartz, Y . Moshe, and N. Peleg. Image quality as- sessment based on dct subband similarity. In 2015 IEEE International Conference on Image Processing (ICIP), pp. 2105–2109. IEEE, 2015. 2, 5
work page 2015
-
[3]
J. T. Barron, B. Mildenhall, D. Verbin, P. P. Srinivasan, and P. Hedman. Mip-nerf 360: Unbounded anti-aliased neural radiance fields. In Pro- ceedings of the IEEE/CVF Conference on Computer Vision and Pattern Recognition, pp. 5470–5479, 2022. 1, 3, 5
work page 2022
- [4]
-
[5]
A. Chen, Z. Xu, A. Geiger, J. Yu, and H. Su. Tensorf: Tensorial radi- ance fields. In European Conference on Computer Vision, pp. 333–350. Springer, 2022. 9
work page 2022
-
[6]
T. Chen, S. Kornblith, M. Norouzi, and G. Hinton. A simple framework for contrastive learning of visual representations. In International conference on machine learning, pp. 1597–1607. PMLR, 2020. 3
work page 2020
-
[7]
A. Colburn, A. Agarwala, A. Hertzmann, B. Curless, and M. F. Cohen. Image-based remodeling. IEEE Transactions on Visualization and Com- puter Graphics, 19(1):56–66, 2012. 1
work page 2012
Show all 65 references
-
[8]
F. M. Dekking, C. Kraaikamp, H. P. Lopuhaä, and L. E. Meester.A Modern Introduction to Probability and Statistics: Understanding why and how. Springer Science & Business Media, 2005. 5
2005
-
[9]
K. Ding, K. Ma, S. Wang, and E. P. Simoncelli. Image quality assessment: Unifying structure and texture similarity. IEEE transactions on pattern analysis and machine intelligence, 44(5):2567–2581, 2020. 2, 5
2020
-
[10]
Fridovich-Keil, A
S. Fridovich-Keil, A. Yu, M. Tancik, Q. Chen, B. Recht, and A. Kanazawa. Plenoxels: Radiance fields without neural networks. In Proceedings of the IEEE/CVF Conference on Computer Vision and Pattern Recognition, pp. 5501–5510, 2022. 1, 3, 5
2022
-
[11]
Gruber, T
L. Gruber, T. Langlotz, P. Sen, T. Höherer, and D. Schmalstieg. Efficient and robust radiance transfer for probeless photorealistic augmented reality. In 2014 IEEE Virtual Reality (VR), pp. 15–20. IEEE, 2014. 1
2014
-
[12]
Hauswiesner, M
S. Hauswiesner, M. Straka, and G. Reitmayr. Virtual try-on through image-based rendering. IEEE Transactions on Visualization and Computer Graphics, 19(9):1552–1565, 2013. 1
2013
-
[13]
K. He, H. Fan, Y . Wu, S. Xie, and R. Girshick. Momentum contrast for unsupervised visual representation learning. In Proceedings of the IEEE/CVF conference on computer vision and pattern recognition , pp. 9729–9738, 2020. 3
2020
-
[14]
A. G. Howard, M. Zhu, B. Chen, D. Kalenichenko, W. Wang, T. Weyand, M. Andreetto, and H. Adam. Mobilenets: Efficient convolutional neural networks for mobile vision applications. arXiv preprint arXiv:1704.04861,
-
[15]
J. Hu, L. Shen, and G. Sun. Squeeze-and-excitation networks. In Proceed- ings of the IEEE conference on computer vision and pattern recognition, pp. 7132–7141, 2018. 3
2018
-
[16]
Jensen, A
R. Jensen, A. Dahl, G. V ogiatzis, E. Tola, and H. Aanæs. Large scale multi-view stereopsis evaluation. In Proceedings of the IEEE conference on computer vision and pattern recognition, pp. 406–413, 2014. 2
2014
-
[17]
Jiang, K
W. Jiang, K. M. Yi, G. Samei, O. Tuzel, and A. Ranjan. Neuman: Neural human radiance field from a single video. In European Conference on Computer Vision, pp. 402–418. Springer, 2022. 2
2022
-
[18]
Kerbl, G
B. Kerbl, G. Kopanas, T. Leimkühler, and G. Drettakis. 3d gaussian splatting for real-time radiance field rendering. ACM Transactions on Graphics, 42(4), 2023. 9
2023
-
[19]
D. P. Kingma and J. Ba. Adam: A method for stochastic optimization. arXiv preprint arXiv:1412.6980, 2014. 5
2014 arXiv
-
[20]
Knapitsch, J
A. Knapitsch, J. Park, Q.-Y . Zhou, and V . Koltun. Tanks and temples: Benchmarking large-scale scene reconstruction. ACM Transactions on Graphics (ToG), 36(4):1–13, 2017. 2
2017
-
[21]
Li and H.-W
L. Li and H.-W. Shen. Image-based streamline generation and rendering. IEEE Transactions on Visualization and Computer Graphics, 13(3):630– 640, 2007. 1
2007
-
[22]
Z. Li, A. Aaron, I. Katsavounidis, A. Moorthy, M. Manohara, et al. Toward a practical perceptual video quality metric. The Netflix Tech Blog, 6(2):2,
-
[24]
R. K. Mantiuk, G. Denes, A. Chapiro, A. Kaplanyan, G. Rufo, R. Bachy, T. Lian, and A. Patney. Fovvideovdp: A visible difference predictor for wide field-of-view video. ACM Transactions on Graphics (TOG) , 40(4):1–19, 2021. 2, 7
2021
-
[25]
Mikhailiuk, C
A. Mikhailiuk, C. Wilmot, M. Perez-Ortiz, D. Yue, and R. K. Mantiuk. Ac- tive sampling for pairwise comparisons via approximate message passing and information gain maximization. In 2020 25th International Confer- ence on Pattern Recognition (ICPR), pp. 2559–2566. IEEE, 2021. 4
2020
-
[26]
Mildenhall, P
B. Mildenhall, P. P. Srinivasan, R. Ortiz-Cayon, N. K. Kalantari, R. Ra- mamoorthi, R. Ng, and A. Kar. Local light field fusion: Practical view synthesis with prescriptive sampling guidelines. ACM Transactions on Graphics (TOG), 38(4):1–14, 2019. 2, 4
2019
-
[27]
Mildenhall, P
B. Mildenhall, P. P. Srinivasan, M. Tancik, J. T. Barron, R. Ramamoorthi, and R. Ng. Nerf: Representing scenes as neural radiance fields for view synthesis. In European Conference on Computer Vision, pp. 405–421,
-
[28]
Mittal, A
A. Mittal, A. K. Moorthy, and A. C. Bovik. Blind/referenceless image spatial quality evaluator. In 2011 conference record of the forty fifth asilomar conference on signals, systems and computers (ASILOMAR), pp. 723–727. IEEE, 2011. 3
2011
-
[29]
Mittal, A
A. Mittal, A. K. Moorthy, and A. C. Bovik. No-reference image quality assessment in the spatial domain. IEEE Transactions on image processing, 21(12):4695–4708, 2012. 2, 5
2012
-
[30]
Mittal, M
A. Mittal, M. A. Saad, and A. C. Bovik. A completely blind video integrity oracle. IEEE Transactions on Image Processing, 25(1):289–300, 2015. 2, 7
2015
-
[31]
completely blind
A. Mittal, R. Soundararajan, and A. C. Bovik. Making a “completely blind” image quality analyzer. IEEE Signal processing letters, 20(3):209–212,
-
[32]
Müller, A
T. Müller, A. Evans, C. Schied, and A. Keller. Instant neural graphics primitives with a multiresolution hash encoding. ACM Transactions on Graphics (ToG), 41(4):1–15, 2022. 9
2022
-
[33]
H. Z. Nafchi, A. Shahkolaei, R. Hedjam, and M. Cheriet. Mean devia- tion similarity index: Efficient and reliable full-reference image quality evaluator. IEEE Access, 4:5579–5590, 2016. 2, 5
2016
-
[34]
Paszke, S
A. Paszke, S. Gross, F. Massa, A. Lerer, J. Bradbury, G. Chanan, T. Killeen, Z. Lin, N. Gimelshein, L. Antiga, et al. Pytorch: An imperative style, high-performance deep learning library. Advances in neural information processing systems, 32, 2019. 5
2019
-
[35]
Perez-Ortiz and R
M. Perez-Ortiz and R. K. Mantiuk. A practical guide and soft- ware for analysing pairwise comparison experiments. arXiv preprint arXiv:1712.03686, 2017. 4
2017 arXiv
-
[36]
Poullis, S
C. Poullis, S. You, and U. Neumann. Rapid creation of large-scale photo- realistic virtual environments. In 2008 IEEE Virtual Reality Conference, pp. 153–160. IEEE, 2008. 1
2008
-
[37]
Prashnani, H
E. Prashnani, H. Cai, Y . Mostofi, and P. Sen. Pieapp: Perceptual image- error assessment through pairwise preference. In Proceedings of the IEEE Conference on Computer Vision and Pattern Recognition, pp. 1808–1817,
-
[38]
C. R. Qi, H. Su, K. Mo, and L. J. Guibas. Pointnet: Deep learning on point sets for 3d classification and segmentation. In Proceedings of the IEEE conference on computer vision and pattern recognition, pp. 652–660,
-
[39]
Q. Qu, X. Chen, V . Chung, and Z. Chen. Light field image quality assessment with auxiliary learning based on depthwise and anglewise separable convolutions. IEEE Transactions on Broadcasting, 67(4):837– 850, 2021. 2, 3, 5, 7
2021
-
[40]
Q. Qu, X. Chen, Y . Y . Chung, and W. Cai. Lfacon: Introducing anglewise attention to no-reference quality assessment in light field space. IEEE Transactions on Visualization and Computer Graphics, 29(5):2239–2248,
-
[41]
Reisenhofer, S
R. Reisenhofer, S. Bosse, G. Kutyniok, and T. Wiegand. A haar wavelet- based perceptual similarity index for image quality assessment. Signal Processing: Image Communication, 61:33–43, 2018. 2, 5
2018
-
[42]
Sandler, A
M. Sandler, A. Howard, M. Zhu, A. Zhmoginov, and L.-C. Chen. Mo- bilenetv2: Inverted residuals and linear bottlenecks. In Proceedings of the IEEE conference on computer vision and pattern recognition , pp. 4510–4520, 2018. 3
2018
-
[43]
J. L. Schonberger and J.-M. Frahm. Structure-from-motion revisited. In Proceedings of the IEEE conference on computer vision and pattern recognition, pp. 4104–4113, 2016. 3, 4, 9
2016
-
[44]
H. R. Sheikh and A. C. Bovik. Image information and visual quality.IEEE Transactions on image processing, 15(2):430–444, 2006. 2, 5
2006
-
[45]
L. Song, A. Chen, Z. Li, Z. Chen, L. Chen, J. Yuan, Y . Xu, and A. Geiger. Nerfplayer: A streamable dynamic scene representation with decomposed neural radiance fields. IEEE Transactions on Visualization and Computer Graphics, 29(5):2732–2742, 2023. 1
2023
-
[46]
Soundararajan and A
R. Soundararajan and A. C. Bovik. Video quality assessment by reduced reference spatio-temporal entropic differencing. IEEE Transactions on Circuits and Systems for Video Technology, 23(4):684–694, 2012. 2, 5
2012
-
[47]
Subramanyam, J
S. Subramanyam, J. Li, I. Viola, and P. Cesar. Comparing the quality of highly realistic digital humans in 3dof and 6dof: A volumetric video case study. In 2020 IEEE Conference on Virtual Reality and 3D User Interfaces (VR), pp. 127–136. IEEE, 2020. 1
2020
-
[48]
Suhail, C
M. Suhail, C. Esteves, L. Sigal, and A. Makadia. Light field neural rendering. In Proceedings of the IEEE/CVF Conference on Computer Vision and Pattern Recognition, pp. 8269–8279, 2022. 1, 3, 5
2022
-
[49]
C. Sun, M. Sun, and H.-T. Chen. Direct voxel grid optimization: Super- fast convergence for radiance fields reconstruction. In Proceedings of the IEEE/CVF Conference on Computer Vision and Pattern Recognition, pp. 5459–5469, 2022. 1, 3, 5
2022
-
[50]
Tan and Q
M. Tan and Q. Le. Efficientnetv2: Smaller models and faster training. In International conference on machine learning, pp. 10096–10106. PMLR,
-
[51]
J. W. Tukey et al. Exploratory data analysis, vol. 2. Reading, MA, 1977. 5
1977
-
[52]
J. Wang, K. C. Chan, and C. C. Loy. Exploring clip for assessing the look and feel of images. In Proceedings of the AAAI Conference on Artificial Intelligence, vol. 37, pp. 2555–2563, 2023. 2, 5
2023
-
[53]
K. Wang, S. Peng, X. Zhou, J. Yang, and G. Zhang. Nerfcap: Human per- formance capture with dynamic neural radiance fields. IEEE Transactions on Visualization and Computer Graphics, 2022. 1
2022
-
[54]
P. Wang, X. Chen, T. Chen, S. Venugopalan, Z. Wang, et al. Is attention all nerf needs? arXiv preprint arXiv:2207.13298, 2022. 5
2022 arXiv
-
[55]
Q. Wang, Z. Wang, K. Genova, P. P. Srinivasan, H. Zhou, J. T. Barron, R. Martin-Brualla, N. Snavely, and T. Funkhouser. Ibrnet: Learning multi- view image-based rendering. In Proceedings of the IEEE/CVF Conference on Computer Vision and Pattern Recognition, pp. 4690–4699, 2021. 5
2021
-
[56]
Z. Wang, A. C. Bovik, H. R. Sheikh, and E. P. Simoncelli. Image quality assessment: from error visibility to structural similarity.IEEE transactions on image processing, 13(4):600–612, 2004. 1, 2, 5
2004
-
[57]
Wang and Q
Z. Wang and Q. Li. Information content weighting for perceptual image quality assessment. IEEE Transactions on image processing, 20(5):1185– 1198, 2010. 2, 5
2010
-
[58]
Z. Wang, E. P. Simoncelli, and A. C. Bovik. Multiscale structural similarity for image quality assessment. In The Thrity-Seventh Asilomar Conference on Signals, Systems & Computers, 2003 , vol. 2, pp. 1398–1402. IEEE,
2003
-
[59]
Whitlock, S
M. Whitlock, S. Smart, and D. A. Szafir. Graphical perception for immer- sive analytics. In 2020 IEEE Conference on Virtual Reality and 3D User Interfaces (VR), pp. 616–625. IEEE, 2020. 1
2020
-
[60]
Wizadwongsa, P
S. Wizadwongsa, P. Phongthawee, J. Yenphraphai, and S. Suwajanakorn. Nex: Real-time view synthesis with neural basis expansion. InProceedings of the IEEE/CVF Conference on Computer Vision and Pattern Recognition, pp. 8534–8543, 2021. 1, 3, 5
2021
-
[61]
W. Xue, L. Zhang, X. Mou, and A. C. Bovik. Gradient magnitude simi- larity deviation: A highly efficient perceptual image quality index. IEEE transactions on image processing, 23(2):684–695, 2013. 2, 5
2013
-
[62]
Zhang, Y
L. Zhang, Y . Shen, and H. Li. Vsi: A visual saliency-induced index for perceptual image quality assessment. IEEE Transactions on Image processing, 23(10):4270–4281, 2014. 2, 5
2014
-
[63]
Zhang, L
L. Zhang, L. Zhang, X. Mou, and D. Zhang. Fsim: A feature similarity in- dex for image quality assessment. IEEE transactions on Image Processing, 20(8):2378–2386, 2011. 2, 5
2011
-
[64]
Zhang, P
R. Zhang, P. Isola, A. A. Efros, E. Shechtman, and O. Wang. The unreason- able effectiveness of deep features as a perceptual metric. In Proceedings of the IEEE conference on computer vision and pattern recognition, pp. 586–595, 2018. 1, 2, 5
2018
-
[65]
Zwillinger and S
D. Zwillinger and S. Kokoska. CRC standard probability and statistics tables and formulae. CRC Press, 1999. 5
1999
Reviewed August 11, 2026 · model on record in the stance chip above.
Discussion (0). Continue with ORCID to comment.