REVIEW 3 major objections 4 minor 36 references
Enhanced detection and identification of satellites using an all-sky multi-frequency survey with prototype SKA-Low stations
T0 review · 3 major / 4 minor · reviewed 2026-08-11 · deepseek-v4-flash
Pith's one-line read An all-sky survey with two SKA-Low prototype stations identifies 152 unique satellites across 13 frequency bands and claims a satellite misidentification rate below 1 percent.
desk verdict Useful multi-frequency satellite RFI survey with a genuinely improved identification pipeline, but the headline <1% misidentification rate rests on a single injection simulation that does not cover the crowded datasets where it matters most. read the letter →
The pith
A machine-rendered reading of the paper's core claim, the machinery that carries it, and where it could break.
The reading
What carries the argument
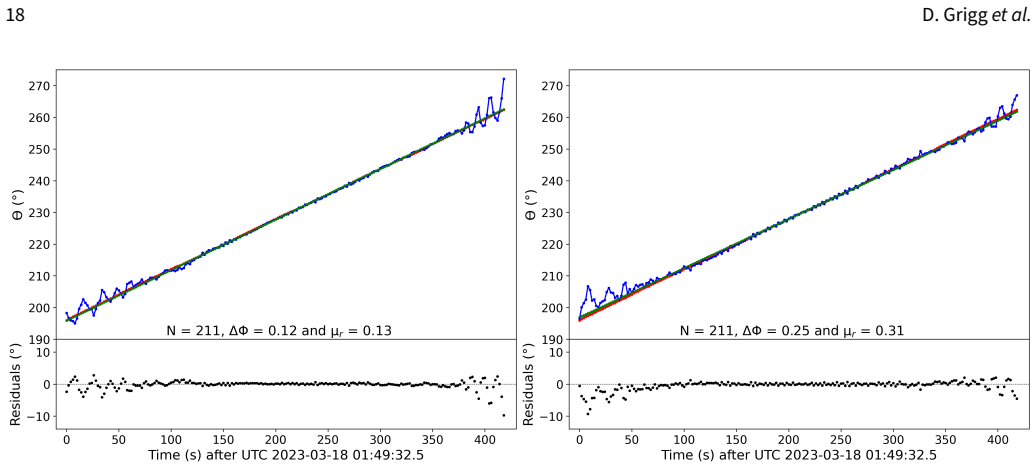
The central machinery is the time-differenced full-sky image combined with a three-stage candidate filter: brute-force elliptical Gaussian fitting at TLE-predicted positions, 15-minute pass binning with at least four detections per pass, and trajectory agreement tests comparing measured and predicted bearing angles through the quantities $\theta_P$, $\theta_M$, $\Delta\phi$, and the residual mean $\mu_r$. A companion injection simulation adds synthetic satellite signals at 120-500 Jy/beam into one dataset to estimate the misidentification rate, and frequency differencing is tested as an alternative subtraction scheme that avoids the overlapping positive and negative images produced by time differencing.
What would settle it
Run the same injection-and-recovery test on the 137.5 MHz dataset, or on every dataset, with synthetic fluxes attenuated by actual range and elevation and with realistic transmitter cadences; if the proportion of misidentified injected passes exceeds 1 percent, the paper's headline validation does not generalize.
Extended reading notes
Core claim
The paper's central claim is that a systematic, multi-epoch survey at 13 frequencies in the 50-350 MHz SKA-Low range can both detect and uniquely identify artificial satellites at scale. It reports 152 unique satellites in low and medium Earth orbit, recovered from 29,005 individual detections across two polarisations. The identification method works by fitting elliptical Gaussians at TLE-predicted positions in time-differenced full-sky images, then keeping only candidates whose measured sky trajectories agree with their predicted trajectories in bearing angle and timing. The authors further claim this reduces the misidentification rate relative to earlier work, with an injection simulation placing the rate below 1 percent, and that a new frequency-differencing mode raises the signal-to-noise ratio of direct satellite transmissions while leaving broadband UEMR harder to detect.
Load-bearing premise
The claim rests on the assumption that a misidentification rate measured in one simulated test on a single 23-hour dataset, using 100 injected satellites whose signals were not weakened by range or elevation, applies to all the survey datasets, including the heavily crowded 137.5 MHz band.
Editorial extensions
If this is right
- Satellite emission at SKA-Low frequencies is not limited to legal downlink bands; UEMR and out-of-band signals appear at several surveyed frequencies, so interference assessments must cover the whole 50-350 MHz range.
- The protected bands sampled (73.4, 150.8, 324.2 and 325 MHz) showed no satellite identifications, suggesting current protections are effective at this site at this time.
- At least three decommissioned satellites emitted when sunlit, indicating that disposal standards and satellite end-of-life behavior will shape future radio-quiet conditions.
- Frequency differencing increased signal-to-noise ratio for narrow-band transmissions by up to 123 percent in the tested passes, supporting its use in the next, larger survey.
- The pipeline can be automated, establishing a repeatable baseline for monitoring satellite activity over coming years.
Reading between the lines
- The validation simulation is a best-case test: it ran on one dataset, used only 100 injected satellites, and did not attenuate injected flux with range or elevation, so the less-than-1 percent headline likely understates the error rate in crowded, high-RFI bands such as 137.5 MHz.
- Preferring frequency differencing for the next survey would trade away the ability to detect broadband UEMR, so a hybrid time-plus-frequency differencing pipeline may be needed.
- The trajectory-matching logic is wavelength-agnostic and could be adapted to optical or radar space-surveillance data, where the same measured-motion-versus-predicted-Keplerian-motion test would apply.
- Repeating this survey in later years would convert the stated baseline into a trend measurement, which is the natural next test of whether satellite RFI is worsening.
Editorial analysis
A structured set of objections, weighed in public.
Referee Report
Summary. The paper reports a multi-frequency, multi-epoch survey with the AAVS2 and EDA2 SKA-Low prototype stations, analyzing 18 datasets totaling about 1.6 million full-sky images across 13 frequency bands. The central claims are that 152 unique satellites in low and medium Earth orbit were identified, that a time-differencing plus trajectory-matching identification pipeline reduces satellite misidentification relative to previous work, and that this improvement is quantified by an injection simulation giving a <1% misidentification rate. The paper also tests frequency differencing as an alternative to time differencing, reports UEMR from active and decommissioned satellites, and compares its identifications with the earlier Sokolowski et al. (2021) catalog.
Significance. If the central claims hold, this is a useful step toward systematic monitoring of satellite RFI at SKA-Low frequencies. The paper's strengths are that the detection and identification pipeline is described in enough detail to be reimplemented, the injection simulation is a genuine internal check on satellite-to-satellite misassignment, the comparison with Sokolowski et al. (2021) provides an external reference, and the results include concrete, falsifiable findings such as the absence of detections in protected bands and the detection of UEMR from specific satellite models. The main limitation is that the quantitative <1% misidentification claim is supported by only one injection simulation on a relatively clean dataset, while several high-cadence, high-RFI datasets dominate the detection count; the paper itself concedes that the rate may not transfer. This limits the strength of the headline claim until the simulation is extended or per-dataset uncertainties are given.
major comments (3)
- [§2.4, §4.8] The <1% misidentification rate is estimated from a single injection simulation run on the 229.7 MHz dataset, with 100 satellites injected at fixed flux densities between 120 and 500 Jy/beam and no attenuation by range or elevation. The 229.7 MHz dataset is among the least crowded in Table 3 (15 unique satellites), whereas the 137.5 MHz dataset, which contributes roughly half of the 152 unique satellites, has image RMS varying from 10 to 10^6 Jy/beam and frequently has 1–10 satellites visible simultaneously (§3.1.1). Section 4.8 explicitly states that the <1% rate 'may not hold for datasets with a high number of visible satellites or high levels of RFI.' Because the abstract and Section 2.4 present the rate as a general validation of the pipeline, the simulation must be run on at least the crowded 137.5 MHz data, or the claim must be restricted to the tested regime with a per-dataset breakdown.
- [§2.4] The simulation as described tests only one of the two kinds of misidentification defined in Section 2.4: injected satellite signals being assigned to the wrong satellite. It does not test whether RFI or other non-satellite signals are incorrectly labelled as satellites, because no synthetic RFI is injected and only 'the results for these 100 randomly selected satellites' are reported. Therefore the headline '<1% misidentification' is, strictly speaking, an upper bound on satellite-to-satellite confusion in the 229.7 MHz dataset, not on the full misidentification rate defined in the text. The manuscript should either rephrase the claim or extend the simulation to include injected non-satellite transients.
- [§2.3.3, Appendix 2] The identification thresholds N ≥ 4, Δφ ≤ 10°, and μ_r ≤ 3° are described as data-driven (Appendix 2), but no sensitivity analysis is presented. Since the claimed improvement over Sokolowski et al. (2021) rests on reducing misidentifications while increasing detections, the robustness of the counts in Table 3 to moderate changes in these thresholds should be quantified. Without this, the reader cannot assess how finely the algorithm was tuned to the present datasets.
minor comments (4)
- [§2.5 and Table 1] Section 2.5 refers to 'fine channel (24.8 kHz) data', while Table 1 lists the channel bandwidth as 0.0289 MHz (28.9 kHz). One of these is a typo and should be corrected.
- [§3.3.2] The text says 'The authors of Sokolowski et al. were kind enough to allow the two datasets from 2021-11-16 with the AAVS2 and EDA2 acquiring simultaneously for ≈133 hours to be made available', but Table 1 lists the 2021-11-16 159.4 MHz dataset as 22 h 57 min, and the ≈133-hour simultaneous datasets are the 2020-06-26 ones. The date reference appears to be wrong.
- [Table 4 and §3.5] The SNR ratios in Table 4 are presented as point values without uncertainties or a statement of how many time steps were averaged. Given the spread in the ISS results (0.86 to 1.39) and the qualitative explanation for the 0.86 case, reporting a standard error or a range would make the comparison between time and frequency differencing more interpretable.
- [§2.3.2] The candidate criterion requiring separation between the TLE predicted position and fitted position to be no larger than 'the larger of two pixels or three degrees' is described without justifying the three-degree value. Since the paper elsewhere emphasizes that TLE uncertainties can be significant, a brief justification or reference would strengthen this constraint.
Circularity Check
No significant circularity: the survey results are observational products of an independent TLE-plus-Gaussian-fit pipeline, and the <1% misidentification bound is an injected-signal simulation rather than a fitted quantity renamed as a prediction.
full rationale
The paper's derivation chain does not reduce to its own inputs. Satellite candidates are obtained by fitting an elliptical Gaussian at TLE-predicted positions (Eq. 1), and identifications require trajectory consistency (Appendix 2: theta_P/theta_M, Delta-phi <= 10 degrees, mu_r <= 3 degrees; the mu_r threshold is stated as data-driven, but it is a filter choice, not a fitted prediction of the headline result). The 152 unique satellites and per-dataset counts (Table 3) are measured outputs. The central quantitative claim, a <1% misidentification rate, is estimated in Section 2.4 by injecting 100 synthetic satellites with randomized flux densities and cadences into the 229.7 MHz dataset and running the full detection and identification pipeline; the recovery (219/232 and 213/232 passes) is an independent test, not a re-labeling of the injection parameters. The paper itself limits the claim in Section 4.8, noting that the rate 'may not hold for datasets with a high number of visible satellites or high levels of RFI'; this is a generalizability caveat, not evidence of circularity. Self-citations (Sokolowski et al. 2021; Grigg et al. 2023) supply comparison datasets and previously reported Starlink results that are explicitly omitted, and are not the load-bearing justification for any new derivation. No equation in the paper is defined in terms of the result it is used to predict.
Assumptions & free parameters
free parameters (4)
- Maximum direction-of-travel mismatch (Delta phi) =
10 degrees
- Maximum mean residual (mu_r) =
3 degrees
- Minimum number of candidates per pass (N_min) =
4
- Simulation injection flux density range =
120-500 Jy/beam (random)
assumptions (4)
- domain assumption TLEs from space-track.org are sufficiently accurate for identification
- domain assumption Elliptical Gaussian model approximates the PSF
- domain assumption Injection simulation on 229.7 MHz is representative of all datasets
- domain assumption Quiet Sun model provides adequate calibration
Cite this review
Pith. "Pith review of Enhanced detection and identification of satellites using an all-sky multi-frequency survey with prototype SKA-Low stations." pith.science (2026). https://pith.science/paper/J3DQMUWM
@misc{pith2026241214483,
  author       = {Pith},
  title        = {Pith review of: Enhanced detection and identification of satellites using an all-sky multi-frequency survey with prototype SKA-Low stations},
  year         = {2026},
  howpublished = {\url{https://pith.science/paper/J3DQMUWM}},
  note         = {Machine review of arXiv:2412.14483}
}
abstract
With the low Earth orbit environment becoming increasingly populated with artificial satellites, rockets, and debris, it is important to understand the effects they have on radio astronomy. In this work, we undertake a multi-frequency, multi-epoch survey with two SKA-Low station prototypes located at the SKA-Low site, to identify and characterise radio frequency emission from orbiting objects and consider their impact on radio astronomy observations. We identified 152 unique satellites across multiple passes in low and medium Earth orbits from 1.6 million full-sky images across 13 selected ${\approx}1$ MHz frequency bands in the SKA-Low frequency range, acquired over almost 20 days of data collection. Our algorithms significantly reduce the rate of satellite misidentification, compared to previous work, validated through simulations to be $<1\%$. Notably, multiple satellites were detected transmitting unintended electromagnetic radiation, as well as several decommissioned satellites likely transmitting when the Sun illuminates their solar panels. We test alternative methods of processing data, which will be deployed for a larger, more systematic survey at SKA-Low frequencies in the near future. The current work establishes a baseline for monitoring satellite transmissions, which will be repeated in future years to assess their evolving impact on radio astronomy observations.
Figures


Figures from the paper (6 more)




Reference graph
Works this paper leans on
-
[5]
for each dataset Frequency Dataset start date Telescope NORAD I.D
Individual identifications per NORAD I.D. for each dataset Frequency Dataset start date Telescope NORAD I.D. Name Identifications XX Identifications YY Closest range (km) Furthest range (km) 96.9 2022-12-18 18:22:15.5 EDA2 25544 ISS 68 72 439 665 96.9 2022-12-16 10:10:30.5 EDA2 25544 ISS 66 64 447 593 98.4 2022-10-18 18:25:12.5 EDA2 25544 ISS 189 170 422 ...
work page 2022
-
[7]
https: //doi.org/10.3847/1538-4365/aa6df
-
[9]
Detection of intended and unintended emissions from Starlink satellites in the SKA-Low frequency range, at the SKA-Low site, with an SKA-Low station analogue. A&A 678 (October): L6. h ttps://doi.org/10.1051/0004- 6361/202347654. arXiv: 2309.15672 [astro-ph.IM]. Grigg, D., S.J. Tingay, M. Sokolowski, and R.B. Wayth
-
[10]
The mean of the residuals between the fitted line to θM and the θP values was calculated and denoted as µr. When the predicted trajectories of two satellites are very similar in position, but offset in time, this value of µr will become larger. In Figure 10, the fitted values for θP and θM will be offset by a fixed distance proportional to this timing off...
work page 2023
-
[13]
MeerKA T - The South African Array With Composite Dishes and Wide-Band Single Pixel Feeds. IEEE Proceedings 97, no. 8 (August): 1522–1530. https://doi.org/10.1109/JPROC.2009.2020713. Lonsdale, Colin J., Roger J. Cappallo, Miguel F. Morales, Frank H. Briggs, Leonid Benkevitch, Judd D. Bowman, John D. Bunton, et al
arXiv 2009
-
[14]
Proceedings of the IEEE 97 (8): 1497–1506
The murchison widefield array: design overview. Proceedings of the IEEE 97 (8): 1497–1506. https://doi.org/10.1109/JPROC.2009.2017564. Morales, Miguel F., and J. Stuart B. Wyithe
arXiv 2009
-
[17]
https://dx.doi.org/10.3847/1538- 4365/aa6df
-
[18]
Prabu, Steve, P. Hancock, X. Zhang, and S. J. Tingay. 2020a. A low-frequency blind survey of the low Earth orbit environment using non-coherent passive radar with the Murchison widefield array. PASA 37 (December): e052. https : / / doi . org / 10 . 1017 / pasa . 2020
work page 2020
Show all 36 references
-
[21]
Publications of the Astronomical Society of Australia38:e023
A southern-hemisphere all-sky radio transient monitor for ska-low prototype stations. Publications of the Astronomical Society of Australia38:e023. https://doi.org/10.1017/pasa. 2021.16. Tingay, S. J., R. Goeke, J. D. Bowman, D. Emrich, S. M. Ord, D. A. Mitchell, M. F. Morales, et al
2021 doi
-
[23]
PASA 37 (September): e039
A survey of spatially and temporally resolved radio frequency interference in the FM band at the Murchison Radio-astronomy Observatory. PASA 37 (September): e039. https : / / doi . org / 10 . 1017 / pasa . 2020
2020
-
[25]
A&A 556:A2
Lofar: the low-frequency array. A&A 556:A2. https://doi.org/10.1051/0004-6361/201220873. https://doi.org/10.1051/0004-6361/201220873. Cambridge Large Two 17 Virtanen, Pauli, Ralf Gommers, Travis E. Oliphant, Matt Haberland, Tyler Reddy, David Cournapeau, Evgeni Burovski, et al
-
[26]
https://doi.org/10.1038/s41592-019-0686-2
SciPy 1.0: Fundamental Algorithms for Scientific Computing in Python.Nature Methods 17:261–272. https://doi.org/10.1038/s41592-019-0686-2. Walt, Stéfan van der, S. Colbert, and Gael Varoquaux
-
[28]
https://doi.org/10.48550/ARXIV.2112.00908
The engineering development array 2: design, performance and lessons from an ska-low prototype station. https://doi.org/10.48550/ARXIV.2112.00908. https://arxiv.org/ abs/2112.00908. Wilson, C., K. Chow, L. Harvey-Smith, B. Indermuehle, M. Sokolowski, and R. Wayth
-
[30]
IEEE Communications Magazine 61 (6): 156–162
Radio dynamic zones: motivations, challenges, and opportunities to catalyze spectrum coexistence. IEEE Communications Magazine 61 (6): 156–162. https: //doi.org/10.1109/MCOM.005.2200389. Appendix
-
[31]
The cir- cular outline shows the full visible sky horizon to horizon and the curved black dotted line is the predicted path of a satellite across the sky from TLE information
An illustration showing how θM and θP are calculated for three candidate detections C1, C2 and C3 from three separate images. The cir- cular outline shows the full visible sky horizon to horizon and the curved black dotted line is the predicted path of a satellite across the s...
2017
-
[32]
van Haarlem, M
arXiv: 2008.05918 [astro-ph.IM]. van Haarlem, M. P., Wise, M. W., Gunst, A. W., Heald, G., McKean, J. P., Hessels, J. W. T., de Bruyn, A. G., et al
2008 arXiv
-
[34]
for each dataset (continued) Frequency Dataset start date Telescope NORAD I.D
Individual identifications per NORAD I.D. for each dataset (continued) Frequency Dataset start date Telescope NORAD I.D. Name Identifications XX Identifications YY Closest range (km) Furthest range (km) 137.5 2023-03-17 12:19:09.0 EDA2 52181 SPACEBEE-131 18 18 807 977 137.5 20...
2023
-
[35]
for each dataset (continued) Frequency Dataset start date Telescope NORAD I.D
Individual identifications per NORAD I.D. for each dataset (continued) Frequency Dataset start date Telescope NORAD I.D. Name Identifications XX Identifications YY Closest range (km) Furthest range (km) 146.1 2021-11-18 01:08:33.0 EDA2 44398 OBJECT N 35 35 568 1529 146.1 2021-...
2021
-
[36]
for each dataset (continued) Frequency Dataset start date Telescope NORAD I.D
Individual identifications per NORAD I.D. for each dataset (continued) Frequency Dataset start date Telescope NORAD I.D. Name Identifications XX Identifications YY Closest range (km) Furthest range (km) 229.7 2021-11-16 01:10:45.0 AAVS2 37153 STRELA 3 36 32 1541 2975 229.7 202...
2021
-
[40]
04327 [astro-ph.IM]
arXiv: 2006 . 04327 [astro-ph.IM]. Prabu, Steve, Paul Hancock, Xiang Zhang, and Steven Tingay. 2020b. The development of non-coherent passive radar techniques for space situa- tional awareness with the murchison widefield array.Publications of the Astronomical Society of Austr...
2006
-
[123]
org / 10
https : / / doi . org / 10 . 3847 / 1538 - 3881/aabc4f . arXiv: 1801.02634 [astro-ph.IM]. Bassa, C. G., Di Vruno, F., Winkel, B., Józsa, G. I. G., Brentjens, M. A., and Zhang, X
-
[1995]
In Astronomical data analysis software and systems iv, edited by R
A Retrospective View of MIRIAD. In Astronomical data analysis software and systems iv, edited by R. A. Shaw, H. E. Payne, and J. J. E. Hayes, 77:433. Astronomical Society of the Pacific Conference Series. January. arXiv: astro- ph/0612759 [astro-ph]. Sokolowski, M., R. B. Wayt...
-
[1998]
AJ 115, no
The NRAO VLA Sky Survey. AJ 115, no. 5 (May): 1693–1716. https://doi.org/10.1086/300337. Di Vruno, F., B. Winkel, C. G. Bassa, G. I. G. Józsa, M. A. Brentjens, A. Jessner, and S. Garrington
-
[2008]
The Australian square- kilometre-array pathfinder
Science with ASKAP. The Australian square- kilometre-array pathfinder. Experimental Astronomy 22, no. 3 (Decem- ber): 151–273. https://doi.org/10.1007/s10686-008-9124-7. Jonas, J. L
-
[2009]
Annales des Télécommu- nications 64 (October): 625–638
Rfi mitigation of gnss signals for radio astronomy: problems and current techniques. Annales des Télécommu- nications 64 (October): 625–638. https://doi.org/10.1007/s12243-009- 0112-3. Griffiths, Hugh
-
[2010]
ARA&A 48 (September): 127–171
Reionization and Cos- mology with 21-cm Fluctuations. ARA&A 48 (September): 127–171. https : / / doi . org / 10 . 1146 / annurev - astro - 081309 - 130936. arXiv: 0910.3010 [astro-ph.CO]. Perley, R. A., and B. J. Butler
-
[2011]
Computing in Science & Engineering 13 (May): 22–30
The numpy array: a structure for efficient numerical computation. Computing in Science & Engineering 13 (May): 22–30. https://doi.org/10.1109/MCSE.2011.37. Wayth, Randall, Marcin Sokolowski, Jess Broderick, Steven J. Tingay, Raunaq Bhushan, Tom Booler, Riccardo Chiello, et al
2011 doi
-
[2013]
PASA 30 (Jan- uary): e007
The Murchison Widefield Array: The Square Kilometre Array Precursor at Low Radio Frequencies. PASA 30 (Jan- uary): e007. https://doi.org/10.1017/pasa.2012.007. Tingay, S. J., M. Sokolowski, R. Wayth, and D. Ung
2012 doi
-
[2014]
Sidiropoulos, Fulvio Gini, Rama Chellappa, and Sergios Theodoridis, 2:813–855
Chapter 16 - passive bistatic radar, edited by Nicholas D. Sidiropoulos, Fulvio Gini, Rama Chellappa, and Sergios Theodoridis, 2:813–855. Academic Press Library in Signal Processing. Elsevier. https: //doi.org/https://doi.org/10.1016/B978-0-12-396500-4.00016-8. https: //www.sc...
-
[2016]
In2016 international conference on electromagnetics in advanced applications (iceaa),922–923
The australian radio quiet zone — western australia: objectives, implementation and early measurements. In2016 international conference on electromagnetics in advanced applications (iceaa),922–923. https: //doi.org/10.1109/ICEAA.2016.7731554. Zheleva, Mariya, Christopher R. An...
-
[2017]
Advances in Space Research (March)
Tle uncertainty estimation using robust weighted differencing. Advances in Space Research (March). https://doi.org/10.1016/j.asr.2017.02.038. Gilloire, André, and Hervé Sizun
2017 doi
-
[2020]
In Ground-based and airborne telescopes viii, edited by Heather K
A prototype model for evaluating SKA- LOW station calibration. In Ground-based and airborne telescopes viii, edited by Heather K. Marshall, Jason Spyromilio, and Tomonori Usuda, 11445:1449–1468. International Society for Optics and Photonics, SPIE. https://doi.org/10.1117/12.2...
-
[2021]
A&A 655 (November): A5
The Aperture Array Verification System 1: Sys- tem overview and early commissioning results. A&A 655 (November): A5. https://doi.org/10.1051/0004-6361/202040086. arXiv: 2110.03217 [astro-ph.IM]. Caiazzo, M
-
[2022]
Astronomy and Computing 40:100619
Dug insight: a software package for big-data analysis and visualisation, and its demon- stration for passive radar space situational awareness using radio tele- scopes. Astronomy and Computing 40:100619. ISSN: 2213-1337. https: //doi.org/10.1016/j.ascom.2022.100619. https://ww...
-
[2023]
A&A 676 (August): A75
Unintended electromagnetic radiation from Starlink satellites detected with LOFAR between 110 and 188 MHz. A&A 676 (August): A75. https://doi.org/10.1051/0004-6361/202346374. arXiv: 2307.02316 [astro-ph.IM]. Es, A. J. J. van, M. G. Labate, M. F. Waterson, J. Monari, P. Bolli, ...
-
[2571]
arXiv: 2206.02357 [eess.SP]
https://doi.org/10.3390/rs14112571. arXiv: 2206.02357 [eess.SP]. Johnston, S., R. Taylor, M. Bailes, N. Bartel, C. Baugh, M. Bietenholz, C. Blake, et al
Reviewed August 11, 2026 · model on record in the stance chip above.
Discussion (0). Continue with ORCID to comment.