REVIEW 5 major objections 6 minor 24 references
Graph Learning-based Regional Heavy Rainfall Prediction Using Low-Cost Rain Gauges
T0 review · 5 major / 6 minor · reviewed 2026-08-11 · deepseek-v4-flash
Pith's one-line read This paper argues that a graph neural network over 41 distance-linked rain-gauge stations can predict daily rainfall and flag heavy events, making low-cost flood warning feasible where radar is scarce.
desk verdict The paper's central effectiveness claim collapses on its own Table I: Pearson r values above 1 are impossible, so the evaluation pipeline is broken, despite a plausible low-cost IoT hardware story. read the letter →
The pith
A machine-rendered reading of the paper's core claim, the machinery that carries it, and where it could break.
The reading
What carries the argument
The load-bearing object is the station graph: nodes are weather stations, node features are each station's meteorological history (mainly past rainfall), and edge weights are the inverse geographic distances between stations. On top of this graph the model stacks four graph convolution layers (GCLs) of the form $H^{l+1} = \sigma(D^{-1/2} A D^{-1/2} H^l W^l)$, followed by a fully connected regression layer, trained with Adam at learning rate 0.01 and early stopping; the 8 mm/day threshold converts the regression output into a heavy-rainfall flag.
What would settle it
Recompute the Pearson correlation between the held-out predictions and observed values: the reported r of 5.891 is mathematically impossible because r must lie within [-1, 1], so a corrected calculation would immediately show whether the headline accuracy claim survives. Separately, train the identical four-layer GNN with the adjacency matrix replaced by the identity matrix (each station isolated) and by an elevation-difference-weighted graph; if the inverse-distance graph does not beat both on days with 8 mm or more, then the spatial-dependence mechanism the paper relies on is not the source of its results.
Extended reading notes
Core claim
The paper's central claim is that a static graph neural network whose adjacency matrix is the inverse distance between 41 rain-gauge stations can learn enough spatial structure from daily rainfall histories to forecast heavy rainfall regionally. The model applies four graph convolution layers with ReLU activations to the normalized adjacency matrix, then a fully connected regression layer that outputs a rainfall amount per station; any prediction above 8 mm counts as a heavy rainfall event. On a 70/20/10 temporal split of 72 months of daily data from the national hydrology service, the authors report model A as best, with MSE 16.344, MAE 9.512, and a Pearson r of 5.891 on the testing set. In the paper's telling, this demonstrates that low-cost gauge networks plus graph learning can substitute for expensive infrastructure in data-sparse regions.
Load-bearing premise
The whole method depends on the idea that rainfall at one station is best explained by rainfall at geographically nearby stations, so a graph whose links are just geographic distances carries the information needed to predict heavy rain; if in Bolivia's mountains rainfall is controlled more by elevation and local terrain than by distance, the graph gives the model the wrong inductive bias and the reported prediction ability would not transfer.
Editorial extensions
If this is right
- If the reported accuracy holds, 41 low-cost stations connected by GSM could support daily heavy-rainfall alerts across Bolivia without radar.
- SMS-based data transfer means the same prediction pipeline can run in other regions where 3G/4G coverage and internet are unavailable.
- Because the GNN outputs a rainfall amount per node, the method can flag stations expected to exceed 8 mm/day, giving authorities a concrete trigger for warnings.
- The end-device design (tipping bucket plus solar power) keeps per-unit cost around $280–$320, making dense deployment financially conceivable.
Reading between the lines
- The inverse-distance graph is a strong prior: it assumes geographic closeness controls rainfall dependence. In mountainous Bolivia, elevation and slope are likely at least as influential, so adding altitude as a node feature or edge weight is a natural extension the paper does not test.
- The reported Pearson coefficient r = 5.891 lies outside the possible range [-1, 1], which suggests either a misreported formula or a typographical error; correcting this and re-evaluating the model is the first check any adopter should make.
- No comparison is made to a station's own historical climatology or to a non-spatial baseline, so the paper's claim that the graph structure itself helps remains unquantified; a persistence baseline would isolate the GNN's contribution.
- If heavy-rain events are rare, MSE and MAE can be dominated by many dry days; reporting event-level precision/recall or hits for the 8 mm threshold would make the practical alerting value much clearer.
Signed reviews
Editorial analysis
A structured set of objections, weighed in public.
Referee Report
Summary. The paper presents a low-cost IoT rainfall monitoring system with 3D-printed tipping-bucket rain gauges, GSM/SMS data transmission, and a MEAN-stack web application, together with a graph neural network (GNN) for regional heavy rainfall prediction. The GNN models 41 Bolivian weather stations as nodes with inverse-distance-weighted edges and uses four graph convolution layers followed by a regression head to predict daily rainfall; a prediction above 8 mm is flagged as a heavy rainfall event. The authors report results on a daily precipitation dataset and claim that the proposed method is effective based on MSE, MAE, and Pearson correlation on a held-out test set.
Significance. The hardware contribution is concrete and potentially useful: the paper describes a complete low-cost sensing and communication pipeline for rural environmental monitoring, and the evaluation uses real multi-year data from 41 stations rather than a synthetic benchmark. If the prediction claims were valid, the approach could be attractive for flood early warning in data-sparse regions. However, the central empirical claim is not supported as reported: the headline correlation coefficients are mathematically impossible, the test error exceeds the event threshold, no baselines or ablations are provided, and the data split is not shown to be chronological. These issues place the paper's main contribution, namely the demonstrated effectiveness of GNN-based heavy-rainfall prediction, in question.
major comments (5)
- [Section V, Table I and Eq. (4)] The Pearson correlation coefficients reported in Table I (r = 5.891, 6.002, 7.204, 8.771) are mathematically impossible for the coefficient defined in Eq. (4), which is bounded in [-1, 1] for any two real vectors. Since r is one of the three reported performance metrics and the abstract's effectiveness claim rests on these results, the evaluation as reported is invalid; the r column appears to have been computed by a different formula or on different quantities than stated. This is a load-bearing internal inconsistency, not a presentation issue.
- [Section V, Table I and Section IV-B] The best model's MAE is 9.512 mm, which is larger than the 8 mm heavy-rain threshold defined in Section IV-B. With an average absolute error exceeding the event threshold, the proposed flagging rule (predict rainfall above 8 mm) cannot be expected to separate heavy-rain days from other days. The paper reports no event-level metrics such as precision, recall, F1, or a confusion matrix, so the central claim about predicting heavy rainfall events is not demonstrated.
- [Section V] No baseline or ablation is reported. The manuscript does not compare against persistence, climatology, linear regression, an LSTM, or a non-graph machine learning model, nor does it ablate the graph construction (e.g., inverse-distance weighting, number of neighbors, number of layers). Without such comparisons, statements that the GNN 'outperformed' other models and 'effectively captured spatial dependencies' are unsupported.
- [Section V, data split] The train/validation/test split is described only as 70/20/10 percentages. For daily precipitation time series with strong temporal autocorrelation, a random split can leak future information into training and inflate performance. The authors need to specify whether the split is chronological and report evaluation on temporally disjoint periods; as written, the generalization claim is not assured.
- [Section IV-B and IV-A] The model input is underspecified: the node feature vector is described only as 'meteorological data from that station (mainly past rainfall)' with no statement of the number of lag days, the feature dimension, the standardization procedure, or the missing-value interpolation method. This makes the experiment unreproducible and prevents assessment of whether the model is predicting from past rainfall or from contemporaneous information.
minor comments (6)
- [Eq. (4)] The notation cov(X, y) is dimensionally inconsistent; Pearson correlation should be defined on paired scalar observations, and it would be clearer to state explicitly whether r is pooled across stations and days or computed per station.
- [Section III-B and IV-B] There are small typographical issues: 'W AN' should be 'WAN', and 'ReLu' should be 'ReLU'.
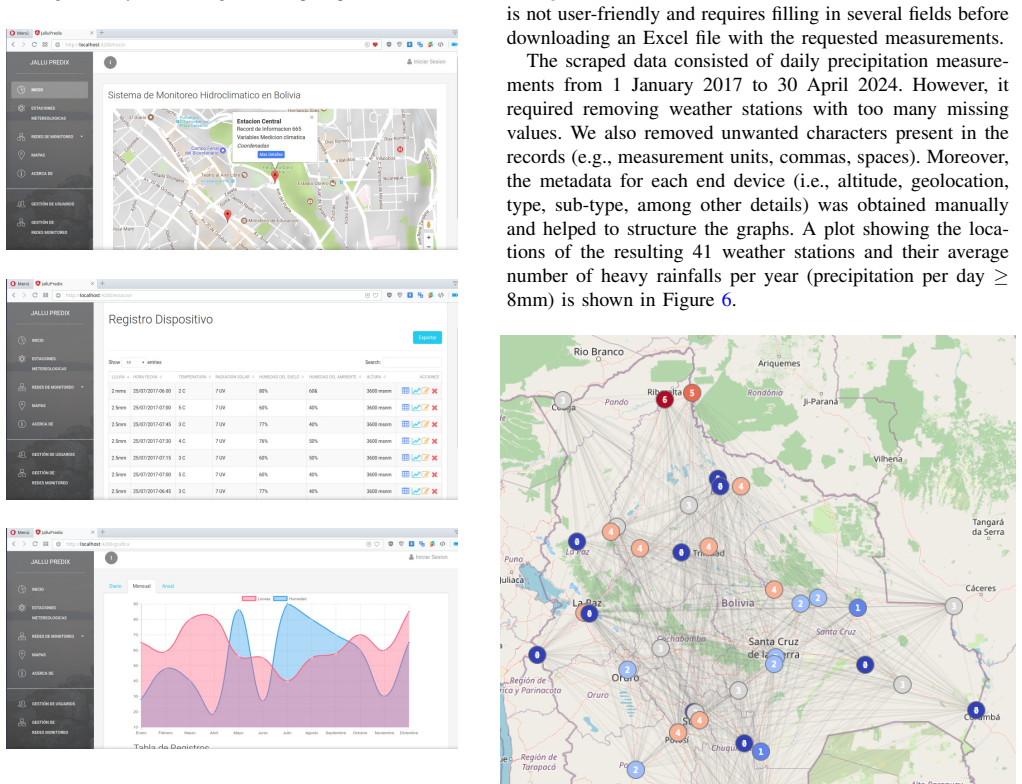
- [Figure 7] Figure 7 is referenced only as 'Best performing GNN model' without a descriptive caption; it is unclear what the plot shows and how it supports the reported results.
- [Section IV-B] The 8 mm/day heavy-rainfall threshold is introduced without justification or citation; a reference or a brief rationale from Bolivian meteorological practice would help.
- [Section IV-A, abstract, and Section V] The dataset duration is inconsistent: the abstract and Section V say 72 months, but the data collection period stated in Section IV-A (1 January 2017 to 30 April 2024) is 88 months.
- [References] Several references are incomplete, including [1], [2], [9], [10], and [24], which lack full author, title, or access details; the bibliography needs to be brought to journal style.
Circularity Check
No circularity: the GNN prediction is a fitted regression evaluated on held-out data; the only self-citation is non-load-bearing.
full rationale
The paper makes no derivation claim that could be circular: its GNN is a standard fitted regression model trained on historical SENAMHI daily rainfall and evaluated on a held-out test split (70/20/10). The adjacency matrix is constructed from inverse station distances, a stated design choice rather than a quantity derived from the prediction target, and the heavy-rainfall flag is simply a threshold (>=8 mm) applied to the regression output. The single self-citation, [19] (Rojas, Salcedo, Sahonero), appears only in a related-work sentence about edge computing and is not load-bearing for the model or its evaluation. No fitted parameter is renamed as a prediction, no uniqueness theorem is imported from the authors' prior work, and no result is defined in terms of its own target. The reported Pearson r values exceeding 1 (Table I) indicate an invalid evaluation metric, but that is a correctness/consistency problem, not a circularity. The central claim is not equivalent by construction to any input.
Assumptions & free parameters
free parameters (5)
- heavy_rainfall_threshold =
8 mm/day
- GCN hidden layer widths (model A) =
10, 10, 10, 10
- learning_rate =
0.01
- batch_size =
64
- missing_value_interpolation_method =
unspecified
assumptions (5)
- domain assumption Spatial dependence of daily rainfall is adequately captured by inverse-distance-weighted edges between stations.
- domain assumption A static four-layer graph convolution with no explicit temporal recurrence can predict daily rainfall at each station.
- domain assumption The 41 scraped SENAMHI stations, after removing stations with too many missing values and interpolating the rest, are representative for heavy-rain prediction.
- standard math The GCN propagation rule in Eq. 1 is a valid model for this spatiotemporal rainfall regression.
- domain assumption Precipitation is stationary across the 72 months after feature standardization.
Cite this review
Pith. "Pith review of Graph Learning-based Regional Heavy Rainfall Prediction Using Low-Cost Rain Gauges." pith.science (2026). https://pith.science/paper/4DI2456A
@misc{pith2026241216842,
  author       = {Pith},
  title        = {Pith review of: Graph Learning-based Regional Heavy Rainfall Prediction Using Low-Cost Rain Gauges},
  year         = {2026},
  howpublished = {\url{https://pith.science/paper/4DI2456A}},
  note         = {Machine review of arXiv:2412.16842}
}
read the original abstract
Accurate and timely prediction of heavy rainfall events is crucial for effective flood risk management and disaster preparedness. By monitoring, analysing, and evaluating rainfall data at a local level, it is not only possible to take effective actions to prevent any severe climate variation but also to improve the planning of surface and underground hydrological resources. However, developing countries often lack the weather stations to collect data continuously due to the high cost of installation and maintenance. In light of this, the contribution of the present paper is twofold: first, we propose a low-cost IoT system for automatic recording, monitoring, and prediction of rainfall in rural regions. Second, we propose a novel approach to regional heavy rainfall prediction by implementing graph neural networks (GNNs), which are particularly well-suited for capturing the complex spatial dependencies inherent in rainfall patterns. The proposed approach was tested using a historical dataset spanning 72 months, with daily measurements, and experimental results demonstrated the effectiveness of the proposed method in predicting heavy rainfall events, making this approach particularly attractive for regions with limited resources or where traditional weather radar or station coverage is sparse.
Figures


Figures from the paper (3 more)

Reference graph
Works this paper leans on
-
[1]
The countries most prone to flooding
W. Vision, “The countries most prone to flooding.” WORLDVI- SION.org.uk. Accessed: May 23, 2024
work page 2024
-
[2]
Informaci ´on nacional de datos hidrometeorol ´ogicos
SENAMHI, “Informaci ´on nacional de datos hidrometeorol ´ogicos.” SENAMHI.gob.bo. Accessed: May 29, 2024
work page 2024
-
[3]
A rain gauge system using a capacitance sensor,
W. Sa-Ngiamvibool, N. Angkawisittpan, A. Nuan-On, C. Photong, and A. Kangrang, “A rain gauge system using a capacitance sensor,” International Journal of Engineering and Technology , vol. 5, no. 4, pp. 3596–3600, 2013
work page 2013
-
[4]
Evaluation of a low-cost optical rain sensor,
D. D. Steele, T. F. Scherer, F. A. Akyuz, A. W. Wamono, T. M. DeSutter, and S. R. Tuscherer, “Evaluation of a low-cost optical rain sensor,” in ASABE/CSBE North Central Intersectional Meeting , p. 1, American Society of Agricultural and Biological Engineers, 2006
work page 2006
-
[5]
An innovative acoustic rain gauge based on convolutional neural networks,
R. Avanzato and F. Beritelli, “An innovative acoustic rain gauge based on convolutional neural networks,” Information, vol. 11, no. 4, p. 183, 2020
work page 2020
-
[6]
Global precipitation measurement: Methods, datasets and applications,
F. J. Tapiador, F. J. Turk, W. Petersen, A. Y . Hou, E. Garc ´ıa-Ortega, L. A. Machado, C. F. Angelis, P. Salio, C. Kidd, G. J. Huffman, et al., “Global precipitation measurement: Methods, datasets and applications,” Atmospheric Research, vol. 104, pp. 70–97, 2012
work page 2012
-
[7]
Evaluation of precipitation measurements obtained from different types of rain gauges,
G. Urban and K. Strug, “Evaluation of precipitation measurements obtained from different types of rain gauges,” Meteorol. Z , vol. 30, pp. 445–463, 2021
work page 2021
-
[8]
R. Kr ¨uger, P. Karrasch, and A. Eltner, “Calibrating low-cost rain gauge sensors for their applications in iot infrastructures to densify environ- mental monitoring networks,” Geoscientific Instrumentation, Methods and Data Systems Discussions , vol. 2023, pp. 1–20, 2023
work page 2023
Show all 24 references
-
[9]
Aerocone rain collector with flat base for vantage pro2 and enviromonitor (tipping spoon) - sku 6464, 6464m
D. Instruments, “Aerocone rain collector with flat base for vantage pro2 and enviromonitor (tipping spoon) - sku 6464, 6464m.” DA VISINSTRU- MENTS.com. Accessed: May 28, 2024
2024
-
[10]
Weather transmitter wxt530 series wxt530
Vaisala, “Weather transmitter wxt530 series wxt530.” V AISALA.com. Accessed: May 28, 2024
2024
-
[11]
A spatiotemporal deep fusion model for merging satellite and gauge precipitation in china,
H. Wu, Q. Yang, J. Liu, and G. Wang, “A spatiotemporal deep fusion model for merging satellite and gauge precipitation in china,” Journal of Hydrology, vol. 584, p. 124664, 2020
2020
-
[12]
Intercomparison of rain gauge, radar, and satellite- based precipitation estimates with emphasis on hydrologic forecasting,
K. K. Yilmaz, T. S. Hogue, K.-l. Hsu, S. Sorooshian, H. V . Gupta, and T. Wagener, “Intercomparison of rain gauge, radar, and satellite- based precipitation estimates with emphasis on hydrologic forecasting,” Journal of Hydrometeorology, vol. 6, no. 4, pp. 497–517, 2005
2005
-
[13]
A review of the application of hybrid machine learning models to improve rainfall prediction,
S.-Q. Dotse, I. Larbi, A. M. Limantol, and L. C. De Silva, “A review of the application of hybrid machine learning models to improve rainfall prediction,” Modeling Earth Systems and Environment , vol. 10, no. 1, pp. 19–44, 2024
2024
-
[14]
Prediction of temperature and rainfall in bangladesh using long short term memory recurrent neural networks,
M. M. R. Khan, M. A. B. Siddique, S. Sakib, A. Aziz, I. K. Tasawar, and Z. Hossain, “Prediction of temperature and rainfall in bangladesh using long short term memory recurrent neural networks,” in 2020 4th International Symposium on Multidisciplinary Studies and Innovative Te...
2020
-
[15]
Deep blstm- gru model for monthly rainfall prediction: A case study of simtokha, bhutan,
M. Chhetri, S. Kumar, P. Pratim Roy, and B.-G. Kim, “Deep blstm- gru model for monthly rainfall prediction: A case study of simtokha, bhutan,” Remote sensing, vol. 12, no. 19, p. 3174, 2020
2020
-
[16]
Rainfall prediction using machine learning models: literature survey,
E. A. Hussein, M. Ghaziasgar, C. Thron, M. Vaccari, and Y . Jafta, “Rainfall prediction using machine learning models: literature survey,” Artificial Intelligence for Data Science in Theory and Practice , pp. 75– 108, 2022
2022
-
[17]
Application of machine learning ensemble models for rainfall prediction,
H. Ahmadi, B. Aminnejad, and H. Sabatsany, “Application of machine learning ensemble models for rainfall prediction,” Acta Geophysica , vol. 71, no. 4, pp. 1775–1786, 2023
2023
-
[18]
Optimising deep learning at the edge for accurate hourly air quality prediction,
I. N. K. Wardana, J. W. Gardner, and S. A. Fahmy, “Optimising deep learning at the edge for accurate hourly air quality prediction,” Sensors, vol. 21, no. 4, p. 1064, 2021
2021
-
[19]
Adras: airborne disease risk assessment system for closed environments,
W. Rojas, E. Salcedo, and G. Sahonero, “Adras: airborne disease risk assessment system for closed environments,” in Annual International Conference on Information Management and Big Data , pp. 96–112, Springer, 2022
2022
-
[20]
Regional heatwave prediction using graph neural network and weather station data,
P. Li, Y . Yu, D. Huang, Z.-H. Wang, and A. Sharma, “Regional heatwave prediction using graph neural network and weather station data,” Geophysical Research Letters, vol. 50, no. 7, p. e2023GL103405, 2023
2023
-
[21]
A structured graph neural network for improving the numerical weather prediction of rainfall,
X. Peng, Q. Li, L. Chen, X. Ning, H. Chu, and J. Liu, “A structured graph neural network for improving the numerical weather prediction of rainfall,” Journal of Geophysical Research: Atmospheres , vol. 128, no. 22, p. e2023JD039011, 2023
2023
-
[22]
Coupling physical factors for precipitation forecast in china with graph neural network,
Y . Chen, Y . Wang, G. Huang, and Q. Tian, “Coupling physical factors for precipitation forecast in china with graph neural network,” Geophysical Research Letters, vol. 51, no. 2, p. e2023GL106676, 2024
2024
-
[23]
Cloudnine: Ana- lyzing meteorological observation impact on weather prediction using explainable graph neural networks,
H.-J. Jeon, J.-H. Kang, I.-H. Kwon, O. Lee, et al. , “Cloudnine: Ana- lyzing meteorological observation impact on weather prediction using explainable graph neural networks,” arXiv preprint arXiv:2402.14861 , 2024
2024 arXiv
-
[24]
Award ceremony hackathon mi madre tierra 2016
Jallupredix, “Award ceremony hackathon mi madre tierra 2016.” YOUTUBE.com. Accessed: May 1, 2024
2016
Reviewed August 11, 2026 · model on record in the stance chip above.
Discussion (0). Continue with ORCID to comment.