REVIEW 2 major objections 4 minor 1 cited by
Emergent cell migration from cell shape deformations and T1 transitions
T0 review · 2 major / 4 minor · reviewed 2026-08-10 · deepseek-v4-flash
Pith's one-line read Although the four-cell neighbor swaps called T1 transitions occur randomly in time for any one cell, the paper shows that their spatial distribution is biased by cell shape, and that this asymmetry gives cells a directional tendency that…
desk verdict A clean new statistical decomposition of successive T1 transitions undermined by a migration claim that no measured cell displacement supports. read the letter →
The pith
A machine-rendered reading of the paper's core claim, the machinery that carries it, and where it could break.
The reading
What carries the argument
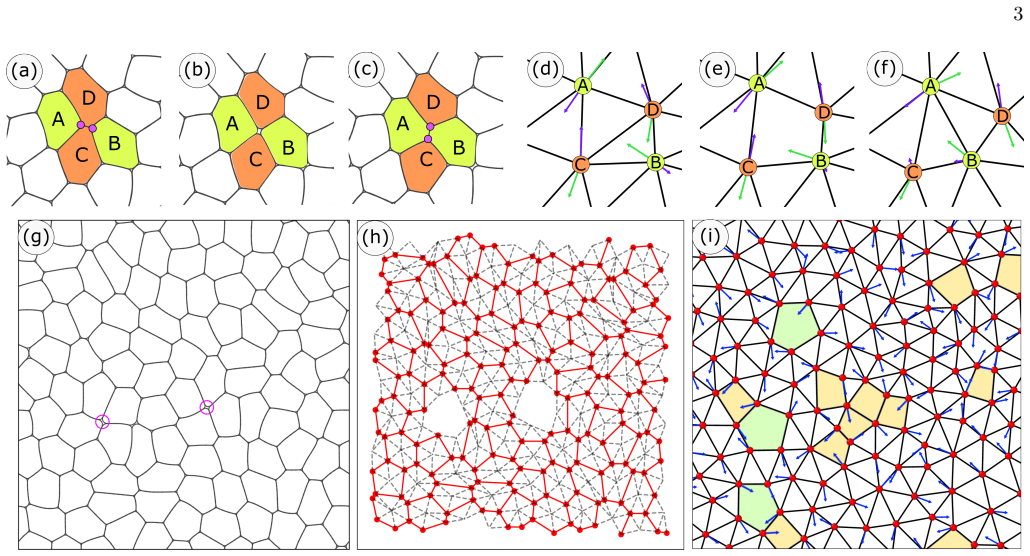
The central object is the T1 transition, a four-cell topological rearrangement in which the junction between two cells shrinks away while two other cells form a new junction roughly perpendicular to the old one. The argument is carried by the cell shape index $p=\mathrm{Perimeter}/\sqrt{\mathrm{Area}}$, a measure of elongation, and by the relative orientation $\xi$ between vertices created in the first of two successive T1s and vertices destroyed in the second, measured around the cell's center of mass. Histograms of $\xi$ for the four successive-T1 scenarios are the load-bearing quantity: a non-uniform histogram means the next rearrangement tends to occur on a particular side of the cell, which is the microscopic mechanism proposed for directed migration. The waiting-time distributions and radial distribution functions support the temporal randomness and spatial correlation of the events.
What would settle it
Track the center of mass of each cell through a loser-gainer or gainer-loser pair of successive T1s in the multi-phase field model and average the displacement conditioned on the scenario: if the mean displacement is zero, or points opposite to the direction implied by the relative-orientation histograms, then the non-uniform spatial distribution does not by itself produce directed migration.
Extended reading notes
Core claim
The paper's central claim is that T1 transitions, random in time for a single cell, are spatially correlated across the tissue and biased by cell shape. Cells that lose neighbors relax toward a rounder shape, while cells that gain neighbors elongate; the paper documents this dual effect with the shape index $p=\mathrm{Perimeter}/\sqrt{\mathrm{Area}}$. For each of the four ways a cell can participate in two successive T1s, losing twice, losing then gaining, gaining then losing, or gaining twice, the authors measure the relative orientation between vertices created by the first T1 and vertices annihilated by the second, and find non-uniform histograms. These non-uniform distributions are the evidence that successive T1s happen preferentially on one side of a cell, giving the cell a directional bias. The paper concludes that such biases chain together into coherent flow patterns at tissue scales.
Load-bearing premise
The load-bearing premise is that the non-uniform spatial distribution of successive T1s actually produces net cell displacement; the simulations measure the geometry of the T1 locations but do not directly measure cell migration or tissue flow.
Editorial extensions
If this is right
- T1 events can be described as temporally random with an activity-dependent rate, while their spatial distribution is correlated over several cell diameters.
- Neighbor loss relaxes a cell and neighbor gain stretches it, so the same rearrangement has opposite mechanical effects on the cells that shed a contact and those that form a new one.
- Successive T1s do not occur uniformly around a cell; the distributions differ between lose-gain and gain-lose, so the order of topology changes matters for the cell's directional response.
- The orientation bias persists when the model's activity vector no longer aligns with cell elongation, pointing to cell shape deformation, not polarity alignment, as the source of the spatial organization.
- Chains of these biased rearrangements can organize into coherent, tissue-scale flows, linking single-cell topology changes to collective migration.
Reading between the lines
- Editorial inference: the same relative-orientation histograms could be gathered from live monolayers by tracking tri-cellular vertices; positive results would make the geometric bias a directly observable tissue property rather than a simulation-only statistic.
- Editorial inference: if shape deformation is the driver, then suppressing deformation, for example by raising junctional tension or lowering deformability in the model, should weaken the orientation bias and the associated flow coherence; this is a parameter sweep the paper does not report.
- Editorial inference: because a gainer-gainer chain implies a neighboring loser-loser chain, the cell-level directional bias may be compensated at the level of neighbor pairs, possibly producing local shear rather than pure translation; quantifying that compensation would test how the coherent flow actually forms.
Signed reviews
Editorial analysis
A structured set of objections, weighed in public.
Referee Report
Summary. The paper studies the spatiotemporal statistics of T1 transitions in two complementary models of epithelial monolayers: a multi-phase field (MPF) model with deformable cells and an active elastic solid (AES) model with point-like cells. The authors report three main results: (i) successive T1 transitions involving a given cell follow an exponential waiting-time distribution, i.e., a Poisson process in time; (ii) T1 events are spatially correlated, as quantified by radial distribution functions of T1 epicenters; and (iii) cell shape responds asymmetrically to T1 events, with loser cells relaxing and gainer cells elongating. The central claim is that non-uniform spatial distributions of vertices created and annihilated in successive T1s (Figures 5f-5i) lead to directed cell migration and, through chaining of T1s, to coherent tissue-scale flow patterns. The paper presents these statistics from simulations but does not directly measure cell displacement or flow.
Significance. If the causal link between the observed T1 asymmetry and net cell migration is established, the paper would provide a concrete single-cell topological mechanism for collective migration in epithelia, connecting local junction remodelling to tissue-scale flow. The strengths are that the exponential waiting-time distributions, the radial distribution functions, and the shape-index statistics are computed directly from simulations, and the authors include robustness checks for the alpha = 0 case and for varying activity and deformability. The two-model approach (MPF and AES) strengthens the generality of the temporal Poisson statistics. However, the headline claim about directed migration and coherent flow currently rests on geometric orientation histograms rather than on measured cell displacements or flow fields, so the paper's significance is conditional on additional direct evidence.
major comments (2)
- [Section VI, Figs. 5f-5i; Abstract and Conclusions] The central claim that asymmetric spatial patterns of successive T1 transitions 'promote directed cell migration, and form the backbone for coherent flow patterns at tissue scales' is not directly supported by the data shown. The paper never presents cell-center displacements, velocity autocorrelations, mean-squared displacements, or tissue-scale velocity fields. The non-uniform orientation histograms of vertices in Figures 5f-5i are geometric biases of where rearrangements occur, but they do not by themselves establish net cell motion. Moreover, in the MPF model, T1 transitions are triggered by the same self-propelled activity that moves cells (Eqs. A1, A4-A5), so the observed spatial bias could be a consequence of an already-directed motion selecting where T1s occur rather than the T1s generating the motion. A concrete test would be to compute the mean-squared displacement or velocity autocorrelation of cells conditioned on the four scenarios in Figure 5, or to measure the tissue-scale velocity field and its correlation with the T1 orientation histograms.
- [Section VI, paragraph after Fig. 5k] The statement that 'these distributions remain similar even if activity and deformability are varied suggesting a universal emergent behaviour' is not supported by any displayed figure or quantitative comparison. The supplemental material shows only the alpha = 0 case (Supp. Fig. 2), not variations of v0 and Ca for the relative-orientation histograms. To make the universality claim, the authors should either include the histograms for varied v0 and Ca or provide a quantitative similarity measure (e.g., histogram overlap or a distance metric).
minor comments (4)
- [Section VI] In the paragraph discussing Figure 5, the text refers to 'Figure 5g' for both the loser-gainer and the gainer-loser scenarios; the second reference should likely be Figure 5h.
- [Introduction] The word 'emply' should be 'employ' in the sentence 'we emply two complementary modeling approaches'.
- [Appendix B] The neighbor criterion is described once as 'cells i and j are considered neighbours if and only if they are closest in distance to their midpoint than any other third cell' and then given explicitly in equations; the verbal phrasing is ambiguous and should be reworded to match the exact mathematical condition.
- [Section III, Fig. 2] The claim that waiting times are 'exponentially distributed' is made by eye; providing the mean rates and, if possible, a goodness-of-fit or a log-linear plot would strengthen the statistical statement.
Circularity Check
No circular reduction found; the migration/flow claim is an under-supported inference from directly measured T1 statistics, not a fitted or self-defined prediction.
full rationale
The paper is a simulation study with no fitted parameter that is subsequently relabeled as a prediction. The central observables—waiting-time distributions (Fig. 2), radial distribution functions (Fig. 3), shape-index responses (Fig. 4), and relative-orientation histograms of successive T1 vertices (Figs. 5f-i)—are measured directly from the MPF and AES dynamics, and none of them is defined in terms of the migration or flow claim. The sentence "the non-uniform distributions in Figures 5f-5i suggest an effective directed migration of the cells" is an interpretive causal inference, explicitly hedged by "suggest" and "could lead to emergent flow patterns at larger scales." The absence of a direct cell-displacement or flow-field measurement makes the claim under-supported, but under-support is a correctness or validation gap, not a circular reduction: the histogram inputs do not by construction equal the migration output, and no equation in the paper identifies the two. Citations to the authors' prior work ([8], [9], [17], [23], [25]) provide model provenance, the quadrupolar-flow mechanism from T1s, and a reference value for polar order; these are background physics used to interpret the new statistics, not definitions that force the reported result. The paper also acknowledges in the Conclusions that longer chains of successive T1 events are needed to understand emergent fluidization patterns, indicating that the tissue-scale extrapolation is open rather than predetermined. Therefore no specific circular step can be exhibited.
Assumptions & free parameters
free parameters (4)
- v0 (cell self-propulsion speed) =
0.5 (MPF default; varied in Figs. 2-3)
- Ca (capillarity number / deformability) =
0.2 (default; varied in Supplemental Fig. 1)
- alpha (activity-shape alignment rate) =
0.1 (default); 0 in Supplemental Fig. 2
- Dr (rotational diffusion) =
0.01 (MPF); 0.025/0.15 (AES)
assumptions (4)
- domain assumption The MPF free energy functional (Eqs. A2-A3) is a valid representation of epithelial monolayer mechanics, including cortical tension, repulsion, and adhesion.
- domain assumption The AES model with the geometric neighbour rule (r_ij^2 > r_ik^2 + r_jk^2) captures the same T1 physics as the MPF model.
- domain assumption Exponential waiting-time distributions are sufficient evidence for a Poisson process.
- ad hoc to paper The non-uniform vertex-orientation histograms (Figures 5f-5i) are causally related to directed cell migration.
Cite this review
Pith. "Pith review of Emergent cell migration from cell shape deformations and T1 transitions." pith.science (2026). https://pith.science/paper/KMIQI4JR
@misc{pith2026241219686,
  author       = {Pith},
  title        = {Pith review of: Emergent cell migration from cell shape deformations and T1 transitions},
  year         = {2026},
  howpublished = {\url{https://pith.science/paper/KMIQI4JR}},
  note         = {Machine review of arXiv:2412.19686}
}
read the original abstract
T1 transitions, which are localised cell rearrangements, play an important role in the fluidization of epithelial monolayers. Using a multi-phase field model and an active elastic solid model, we show that although each cell undergoes T1 transitions in time as uncorrelated, random events, the spatial distribution of these events is highly correlated and is dependent on cell shape. T1 transitions have a dual effect. Cells losing neighbours tend to relax their shape, while those gaining neighbours tend to elongate. By analysing the statistics of successive T1 transitions undergone by a deformable cell, we find asymmetric spatial distributions related to how cells lose or gain neighbours. These asymmetric spatial patterns of T1 transitions promote directed cell migration, and form the backbone for coherent flow patterns at tissue scales.
Figures


Figures from the paper (4 more)


Forward citations
Cited by 1 Pith paper
-
Collective migration and topological phase transitions in confluent epithelia
Activity in confluent epithelia renormalizes the core energy of hexatic dislocations, producing a Kosterlitz-Thouless-Halperin-Nelson-Young type melting transition whose correlation-length exponent can range up to 1 d...
Reference graph
Works this paper leans on
-
[1]
B. Ladoux and R. M. M` ege, Mechanobiology of collective cell behaviours, Nature Reviews Molecular Cell Biology 18, 743 (2017)
work page 2017
-
[2]
V. Hakim and P. Silberzan, Collective cell migration: A physics perspective, Reports on Progress in Physics 80, 076601 (2017)
work page 2017
-
[3]
P. Friedl and D. Gilmour, Collective cell migration in morphogenesis, regeneration and cancer, Nature Reviews Molecular Cell Biology 10, 445 (2009)
work page 2009
-
[4]
A. Brugu´ es, E. Anon, V. Conte, J. H. Veldhuis, M. Gupta, J. Colombelli, J. J. Mu˜ noz, G. W. Brod- land, B. Ladoux, and X. Trepat, Forces driving epithelial wound healing, Nature Physics 10, 683 (2014)
work page 2014
-
[5]
K. D. Irvine and E. Wieschaus, Cell intercalation dur- ing Drosophila germband extension and its regulation by pair-rule segmentation genes, Development 120, 827 (1994)
work page 1994
-
[6]
D. Weaire and N. Rivier, Soap, cells and statistics— random patterns in two dimensions, Contemporary Physics 25, 59 (1984)
work page 1984
-
[7]
Stavans, The evolution of cellular structures, Reports on Progress in Physics 56, 733 (1993)
J. Stavans, The evolution of cellular structures, Reports on Progress in Physics 56, 733 (1993)
work page 1993
-
[8]
H. P. Jain, A. Voigt, and L. Angheluta, Robust statistical properties of T1 transitions in a multi-phase field model of cell monolayers, Scientific Reports 13, 10096 (2023)
work page 2023
Show all 33 references
-
[9]
H. P. Jain, A. Voigt, and L. Angheluta, From cell interca- lation to flow, the importance of T1 transitions, Physical Review Research 6, 033176 (2024)
2024
-
[10]
Bertet, L
C. Bertet, L. Sulak, and T. Lecuit, Myosin-dependent junction remodelling controls planar cell intercalation and axis elongation, Nature 429, 667 (2004)
2004
-
[11]
J. T. Blankenship, S. T. Backovic, J. S. Sanny, O. Weitz, and J. A. Zallen, Multicellular Rosette Formation Links Planar Cell Polarity to Tissue Morphogenesis, Develop- mental Cell 11, 459 (2006)
2006
-
[12]
Mongera, P
A. Mongera, P. Rowghanian, H. J. Gustafson, E. Shelton, D. A. Kealhofer, E. K. Carn, F. Serwane, A. A. Lucio, J. Giammona, and O. Camp` as, A fluid-to-solid jamming transition underlies vertebrate body axis elongation, Na- ture 561, 401 (2018)
2018
-
[13]
S. Kim, M. Pochitaloff, G. A. Stooke-Vaughan, and O. Camp` as, Embryonic tissues as active foams, Nature Physics 17, 859 (2021)
2021
-
[14]
Mongera, M
A. Mongera, M. Pochitaloff, H. J. Gustafson, G. A. Stooke-Vaughan, P. Rowghanian, S. Kim, and O. Cam- p` as, Mechanics of the cellular microenvironment as probed by cells in vivo during zebrafish presomitic meso- derm differentiation, Nature Materials 22, 135 (2023)
2023
-
[15]
D. Bi, J. H. Lopez, J. M. Schwarz, and M. L. Manning, Energy barriers and cell migration in densely packed tis- sues, Soft matter 10, 1885 (2014)
2014
-
[16]
M. E. Rosa and M. A. Fortes, Nucleation and glide of dislocations in a monodisperse two-dimensional foam un- der uniaxial deformation, Philosophical Magazine A 77, 1423 (1998)
1998
-
[17]
Wenzel, S
D. Wenzel, S. Praetorius, and A. Voigt, Topological and geometrical quantities in active cellular structures, Jour- nal of Chemical Physics 150, 10.1063/1.5085766 (2019)
2019 doi
-
[18]
Mueller, J
R. Mueller, J. M. Yeomans, and A. Doostmohammadi, Emergence of active nematic behavior in monolayers of isotropic cells, Physical review letters 122, 048004 (2019)
2019
-
[19]
T. B. Saw, A. Doostmohammadi, V. Nier, L. Kocgozlu, S. Thampi, Y. Toyama, P. Marcq, C. T. Lim, J. M. Yeo- mans, and B. Ladoux, Topological defects in epithelia govern cell death and extrusion, Nature 544, 212 (2017)
2017
-
[20]
Armengol-Collado, L
J.-M. Armengol-Collado, L. N. Carenza, J. Eckert, D. Krommydas, and L. Giomi, Epithelia are multiscale active liquid crystals, Nature Physics 19, 1773 (2023)
2023
-
[21]
Nonomura, Study on Multicellular Systems Using a Phase Field Model, PLOS ONE 7, e33501 (2012)
M. Nonomura, Study on Multicellular Systems Using a Phase Field Model, PLOS ONE 7, e33501 (2012)
2012
-
[22]
H. P. Jain, D. Wenzel, and A. Voigt, Impact of contact inhibition on collective cell migration and proliferation, Physical Review E 105, 034402 (2022)
2022
-
[23]
Ferrante, A
E. Ferrante, A. E. Turgut, M. Dorigo, and C. Huepe, Elasticity-based mechanism for the collective motion of self-propelled particles with springlike interactions: a model system for natural and artificial swarms, Physical review letters 111, 268302 (2013)
2013
-
[24]
L˚ ang, A
E. L˚ ang, A. L˚ ang, P. Blicher, T. Rognes, P. G. Dommer- snes, and S. O. Bøe, Topology-guided polar ordering of collective cell migration, Science Advances 10, eadk4825 (2024)
2024
-
[25]
R. D. Ho, S. O. Bøe, D. K. Dysthe, and L. Anghe- luta, Role of tissue fluidization and topological defects in epithelial tubulogenesis, Physical Review Research 6, 023315 (2024)
2024
-
[26]
S. B. Nissen, S. Rønhild, A. Trusina, and K. Sneppen, Theoretical tool bridging cell polarities with development of robust morphologies, Elife 7, e38407 (2018)
2018
-
[27]
D. Bi, X. Yang, M. C. Marchetti, and M. L. Manning, Motility-driven glass and jamming transitions in biologi- cal tissues, Physical Review X 6, 021011 (2016)
2016
-
[28]
J. A. Park, J. H. Kim, D. Bi, J. A. Mitchel, N. T. Qazvini, K. Tantisira, C. Y. Park, M. McGill, S. H. Kim, B. Gweon, J. Notbohm, R. Steward, S. Burger, S. H. Randell, A. T. Kho, D. T. Tambe, C. Hardin, S. A. Shore, E. Israel, D. A. Weitz, D. J. Tschumperlin, E. P. Henske, S. ...
2015
-
[29]
S. Alt, P. Ganguly, and G. Salbreux, Vertex models: From cell mechanics to tissue morphogenesis, Philosoph- ical Transactions of the Royal Society B: Biological Sci- ences 372 (2017)
2017
-
[30]
Salvalaglio, M
M. Salvalaglio, M. Selch, A. Voigt, and S. M. Wise, Dou- bly degenerate diffuse interface models of anisotropic sur- face diffusion, Mathematical Methods in the Applied Sci- ences , 1 (2020)
2020
-
[31]
Vey and A
S. Vey and A. Voigt, AMDiS: Adaptive multidimensional simulations, Computing and Visualization in Science 10, 57 (2007)
2007
-
[32]
Witkowski, S
T. Witkowski, S. Ling, S. Praetorius, and A. Voigt, Software concepts and numerical algorithms for a scal- able adaptive parallel finite element method, Advances in Computational Mathematics 41, 1145 (2015)
2015
-
[33]
Praetorius and A
S. Praetorius and A. Voigt, Collective Cell Behaviour – a Cell-Based Parallelisation Approach for a Phase Field Active Polar Gel Model , NIC Series No. 49 (Forschungszentrum J ¨ulich GmbH, Zentralbibliothek, J¨ulich, 2018). Supplementary Material Harish P. Jain, Richard D.J.G....
2018 arXiv
Reviewed August 10, 2026 · model on record in the stance chip above.
Discussion (0). Continue with ORCID to comment.