REVIEW 5 major objections 6 minor 31 references
Text2Insight: Transform natural language text into insights seamlessly using multi-model architecture
T0 review · 5 major / 6 minor · reviewed 2026-08-10 · deepseek-v4-flash
Pith's one-line read Text2Insight claims a five-model pipeline can turn a plain-English data request into an accurate SQL query, a fitting chart, and a written insight.
desk verdict A thesis-style engineering write-up whose headline accuracy numbers are circular; the literature review and architecture description have some value, but the evaluation does not support the claims. read the letter →
The pith
A machine-rendered reading of the paper's core claim, the machinery that carries it, and where it could break.
The reading
What carries the argument
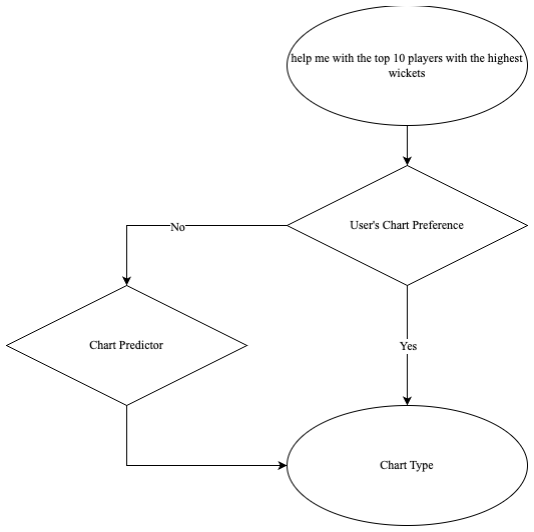
The load-bearing object is the sequential multi-model pipeline: the input CSV is read with Pandas and NumPy to extract shape, column names, data types, primary key, and schema, then loaded into SQLite; a pre-trained decoder-only Llama3 model converts natural-language text into an SQL query; Spacy's en_core_web_sm model refines the query by matching tokens in the generated SQL to the closest column names via word similarity; the refined query executes on the SQLite database to produce a data subset; a chart-predictor method inspects the subset's data types (categorical, continuous, univariate, bivariate, multivariate, time-series) and selects among ten chart types, or honors an explicit chart preference; Matplotlib or Seaborn render the chart; and Llama3 again generates insights. Two BERT models extend the system: a distilbert question-answering model with TF-IDF context retrieval, and a bert-base-uncased sequence classifier for binary and ten-class match prediction.
What would settle it
Run Text2Insight on a fresh table with non-obvious column names (for example, 'TTL' instead of 'total_runs') and a query asking for 'total runs'; if the Spacy refinement replaces the generated column token with a dissimilar schema name, or leaves it unmatched, the SQL query fails or returns the wrong rows, and the claimed end-to-end accuracy does not reproduce. A quantitative version would compare 100 generated-and-refined SQL queries against reference SQL on a held-out table and count errors the paper's metrics did not capture.
Extended reading notes
Core claim
The paper claims that Text2Insight, a multi-model pipeline, reliably turns a user's natural-language request and a tabular CSV file into a validated SQL query, a chart, and a written insight. In the pipeline, a pre-trained Llama3 model generates an initial SQL query; Spacy's en_core_web_sm similarity index refines it by replacing column-like tokens with the closest names in the input schema; the refined query runs against a SQLite version of the CSV; a chart-predictor method chooses among ten chart types from the data types of the resulting subset; and Llama3 again produces a 500-word insight summary. The paper also reports a BERT-based question-answering model at 89% accuracy and a BERT-based match-outcome predictor at roughly 70% (binary) and 49% (ten-class) accuracy on IPL cricket data. The headline claim is that Text2Insight's text-to-SQL stage reaches 99.25% syntactic accuracy with BLEU-score correctness at a 0.5 threshold, and that the end-to-end model handles simple and complex queries on its cricket dataset.
Load-bearing premise
The pipeline depends on Spacy's word-similarity step matching whatever column-like words the LLM puts in the SQL query to the actual column names in a user-supplied CSV; if that lexical match fails, the query errors or silently returns the wrong subset.
Editorial extensions
If this is right
- Users can obtain a chart and a 500-word insight from a plain-English query without manually choosing chart type or axes.
- The SQL-refinement step lets the same pipeline work with arbitrary CSV column names by similarity matching, rather than requiring a fixed schema vocabulary.
- Queries that do not specify a chart still receive a visualization, because the chart predictor selects among ten chart types based on the data types in the result subset.
- The BERT question-answering model answers factual natural-language questions about historical match data, including player scores and match outcomes.
- The BERT predictive model forecasts match winners in both binary (two teams) and ten-team classification settings from natural-language match contexts.
Reading between the lines
- The reported 99% figures describe SQL syntax and BLEU similarity at a 0.5 threshold; they do not by themselves establish that the final chart answers the user's intent, since a syntactically valid query can still select the wrong columns.
- The chart predictor's ten-chart, data-type-driven rules suggest the system is most reliable on small subsets; wide tables or mixed-type schemas would likely fall through to the default bar or line chart, so cross-domain generality is an open question.
- The QA and predictive models were trained and tested only on IPL cricket contexts; applying the same recipe to healthcare, finance, or research tables would require new labeled context datasets and would likely shift the reported accuracies.
- A stronger test than BLEU would be execution-based: compare the rows returned by the refined SQL with the rows a human expects, since that directly checks the semantic correctness the pipeline is designed for.
Editorial analysis
A structured set of objections, weighed in public.
Referee Report
Summary. This thesis-style manuscript proposes Text2Insight, a multi-model pipeline that converts natural-language queries over a user-supplied CSV file into SQL, executes the SQL to obtain a data subset, predicts a chart type, generates a chart with Matplotlib/Seaborn, and produces natural-language insights with Llama3. The system also includes a BERT-based question-answering model and a BERT-based predictive model for cricket match outcomes. The headline empirical claims are 99% accuracy, 100% precision, 99% recall, and 99% F1-score with a BLEU score of 0.5 for the full Text2Insight system, plus 89% QA accuracy and roughly 70% accuracy for the binary predictive model.
Significance. If the stated performance were real, the work would be a useful demonstration of composing off-the-shelf LLMs, NER-based refinement, and rule-based chart selection into an NL-to-visualization system. The authors do describe a plausible pipeline and honestly list several limitations in Section 6.2. However, the central quantitative claims are not supported by the evaluation: the 99% overall accuracy is built on a circular BLEU-based correctness definition, the end-to-end evaluation is a set of five hand-picked examples with no scoring protocol, the chart-type predictor has no measured accuracy, and the insight-generation component is not evaluated at all. The paper ships no code, no data, and no reproducible evaluation harness, so the contribution is currently a system description rather than a validated result.
major comments (5)
- [§5.2.1 (Table 5.2, Figure 5.2)] The reported 100% accuracy, precision, recall, and F1 for the Text2SQL model are circular. The paper defines a generated SQL query as 'correct' when its BLEU score against the reference query is at least 0.5, and then computes the confusion matrix from exactly that thresholded BLEU score. BLEU measures n-gram surface overlap, not whether the query returns the intended rows and columns; a high-BLEU query can still select wrong columns or omit conditions, while a semantically equivalent query with different aliases or ordering can receive low BLEU. The abstract's 99% accuracy claim and the end-to-end 'BLEU score of 0.5' therefore rest on this circular definition. A non-circular evaluation, such as execution-match accuracy on the Spider dev split, is required before any correctness claim can be made.
- [§5.3 (Figures 5.4–5.8)] The end-to-end evaluation consists of five hand-picked input queries on a single ODI dataset, one of which is an intentional error case. There is no sampling procedure, no error rate, no comparison baseline, and no scoring rubric for what constitutes a correct chart or insight. These examples can at most demonstrate that the pipeline produces plausible output on selected inputs; they cannot support the headline '99% accuracy' statement. A systematic evaluation over a defined query set with human or automated correctness labels is needed.
- [§5.2.2 (Table 5.3)] The chart-type prediction method is not actually evaluated. Table 5.3 restates the method's own decision rules (e.g., categorical plus quantitative implies bar chart) rather than reporting accuracy on a test set. The text immediately notes that the method fails on negative preferences such as 'not a bar chart' and does not generalize to subsets with more than five columns. No confusion matrix, accuracy figure, or error analysis is provided, so the chart predictor's contribution to the claimed end-to-end performance is unmeasured.
- [§5.2.3 (Figure 5.3)] The insight-generation model receives no evaluation of its own. The section defers to Figure 5.3, which is reproduced from Meta's official page for Llama3, and the accompanying text cites the model's pre-training on 15 trillion tokens. These are not measurements of the quality of the insights generated by the Text2Insight pipeline. Since insight generation is an advertised component of the system, the absence of any metric for it means that no part of the '99% accuracy' claim is accounted for by this stage.
- [§3.3.3 and §6.2] The SQL refinement step is load-bearing for the system's claim of working on arbitrary user-supplied CSVs. It uses Spacy's 'en_core_web_sm' similarity index to replace words in the LLM-generated SQL with the closest column names in the user's schema. The paper provides no evaluation of this mapping on unseen schemas, no ablation showing how much the refinement improves execution success, and no failure analysis. The only evaluation involving refinement uses the Spider dev dataset, where the schema of the reference query is known in advance, so it does not test the difficult case of an arbitrary CSV schema. Given that the Section 6.2 discussion acknowledges the model performs best on small subsets, the robustness of this step remains an open question that directly affects the end-to-end claim.
minor comments (6)
- [§4.4.1 vs. §4.7] The statistical analysis states there are 1,093 matches, 12 teams, and 34 cities, while the chapter summary in Section 4.7 reports 19 teams and 36 cities; these numbers need to be reconciled.
- [§3.3.2 and §6.2] The paper describes Llama3 as 'trained on 15 trillion parameters' in Section 3.3.2 but later says '15 trillion tokens' in Section 6.2; the latter is the correct quantity for pre-training data.
- [§5.2.1] The text says the spider-clean-text-to-sql dataset is divided into train (6,016), dev (665), and test (1,929), then states that 'due to the smaller size of the train dataset, the study utilizes only the train component,' yet the reported evaluation uses 665 queries, which is the dev-set size. Please clarify which split was actually used.
- [§5.4 (Table 5.4)] Table 5.4 lists a runtime of 14.2854 without units, while the text says 'an evaluation runtime of 14.28 minutes'; the units should be made consistent.
- [§5.2.3 (Figure 5.3)] Figure 5.3 is captioned 'Performance Matrix for Llama 3' but is taken from Meta's official page; it should be explicitly labeled as an external source and clearly distinguished from the paper's own experimental results.
- [Title and Abstract] The title and abstract use 'Text2Insight' while the body consistently uses 'Text2Insights'; pick one spelling and use it throughout.
Circularity Check
Headline 99-100% metrics are largely circular: SQL 'correctness' is defined as BLEU>=0.5 and then measured against that same threshold, while the chart-predictor 'evaluation' restates the method's own hand-written rules.
-
self definitional
[Section 5.2.1, text around Figure 5.2 and Table 5.2]
"After obtaining BLEU scores for all the generated queries, the study conducts threshold analysis with different values of BLEU. ... When the threshold value is set to 0.5, it is observed that all the generated queries are mostly similar to the actual ones. ... When a threshold of 0.5 for the BLEU score is selected, it can be observed from Figure 5.2 that the model correctly generates SQL queries, indicating its performance. Additionally, the accuracy, precision, recall, and F1-score are observed to be 1.0, as shown in Table 5.2."
The paper defines SQL-query 'correctness' as BLEU >= 0.5 against the reference query, then constructs the confusion matrix by thresholding that same BLEU score. The reported 1.0 accuracy/precision/recall/F1 is therefore a direct consequence of the evaluation definition, not evidence that the queries retrieve the correct rows. BLEU measures n-gram surface overlap, so a semantically wrong query can pass and a semantically equivalent query can fail. The abstract's precision (100%) and the blended 99-100% accuracy figures inherit this tautology.
-
self definitional
[Section 5.2.2, Table 5.3 and surrounding text]
"When the chart type is not specified in the input query, the observed results vary depending on the number of columns available in the subset of the dataset. If the subset of the dataset contains univariate, bivariate, categorical, and continuous columns, the method can identify the chart type as shown in Table 5.3. For instance, if there is one numeric datatype and one categorical datatype column, the resulting chart type is a bar chart."
The 'evaluation' of the chart-type prediction method is a restatement of the hand-written rules from Section 3.3.5. Table 5.3 lists the same condition-to-chart mapping that the implementation branches on (categorical+quantitative -> bar chart, continuous+univariate -> box plot, etc.), and the paper then 'observes' that the method returns those chart types. There is no independent benchmark or external ground truth; the expected outputs are defined by the rules being tested, so the reported agreement is circular.
full rationale
The strongest quantitative claim of the paper, the 99-100% accuracy/precision/recall/F1 headline in the abstract, rests on the Text2SQL evaluation. The syntax check in Section 5.2.1 is not circular: it verifies parsability and legitimately reports 99.25% syntactic validity. However, the semantic 'correctness' evaluation is circular: the paper declares a generated SQL query correct when BLEU >= 0.5 and then computes a confusion matrix from that same thresholded score, guaranteeing the 1.0 metrics in Table 5.2. BLEU does not measure whether the query returns the right subset of data, so even the threshold is only a surface-similarity proxy, not a correctness label. The abstract's precision of 100% is exactly this circular number. The chart-predictor evaluation is also self-referential: Table 5.3 reproduces the method's own rules, and the accompanying text reports as 'observed results' what are in fact the implemented condition-output branches, with no external dataset or independent annotation. The end-to-end evaluation in Section 5.3 adds only five hand-picked examples, one of which is an error case, with no sampling procedure or baseline. By contrast, the question-answering and predictive models are evaluated on held-out test splits with standard metrics, and those results are not circular. The paper does not rely on a load-bearing self-citation chain; the circularity is internal to the evaluation definitions. Because the central headline metric is forced by the BLEU-threshold definition and the chart-prediction check restates its own rules, the score is 8 rather than a lower partial-circularity score.
Assumptions & free parameters
free parameters (1)
- BLEU threshold =
0.5
assumptions (4)
- domain assumption The provided dataset is assumed clean and sufficiently prepared without preprocessing
- ad hoc to paper Spacy similarity reliably maps SQL keywords to schema columns
- ad hoc to paper BLEU threshold 0.5 indicates SQL query correctness
- domain assumption Spider dev set is representative of user queries against arbitrary CSV datasets
Cite this review
Pith. "Pith review of Text2Insight: Transform natural language text into insights seamlessly using multi-model architecture." pith.science (2026). https://pith.science/paper/5O2RTXHX
@misc{pith2026241219718,
  author       = {Pith},
  title        = {Pith review of: Text2Insight: Transform natural language text into insights seamlessly using multi-model architecture},
  year         = {2026},
  howpublished = {\url{https://pith.science/paper/5O2RTXHX}},
  note         = {Machine review of arXiv:2412.19718}
}
read the original abstract
The growing demand for dynamic, user-centric data analysis and visualization is evident across domains like healthcare, finance, and research. Traditional visualization tools often fail to meet individual user needs due to their static and predefined nature. To address this gap, Text2Insight is introduced as an innovative solution that delivers customized data analysis and visualizations based on user-defined natural language requirements. Leveraging a multi-model architecture, Text2Insight transforms user inputs into actionable insights and dynamic visualizations. The methodology begins with analyzing the input dataset to extract structural details such as columns and values. A pre-trained Llama3 model converts the user's natural language query into an SQL query, which is further refined using a Named Entity Recognition (NER) model for accuracy. A chart predictor determines the most suitable visualization type, while the Llama3 model generates insights based on the SQL query's results. The output is a user-friendly and visually informative chart. To enhance analysis capabilities, the system integrates a question-answering model and a predictive model using the BERT framework. These models provide insights into historical data and predict future trends. Performance evaluation of Text2Insight demonstrates its effectiveness, achieving high accuracy (99%), precision (100%), recall (99%), and F1-score (99%), with a BLEU score of 0.5. The question-answering model attained an accuracy of 89% and the predictive model achieved 70% accuracy. These results validate Text2Insight as a robust and viable solution for transforming natural language text into dynamic, user-specific data analysis and visualizations.
Figures


Figures from the paper (37 more)








Reference graph
Works this paper leans on
-
[1]
and Parikh, D., (2015) VQA: Visual Question Answering
Agrawal, A., Lu, J., Antol, S., Mitchell, M., Zitnick, C.L., Batra, D. and Parikh, D., (2015) VQA: Visual Question Answering. [online] Available at: http://arxiv.org/abs/1505.00468. Anon (n.d.) WebNLG2020
arXiv 2015
-
[2]
SQLformer: Deep Auto-Regressive Query Graph Generation for Text-to-SQL Translation
Bazaga, A., Liò, P. and Micklem, G., (2023) SQLformer: Deep Auto -Regressive Query Graph Generation for Text-to-SQL Translation. [online] Available at: http://arxiv.org/abs/2310.18376
work page Pith review arXiv 2023
-
[3]
and Zhou, J., (2023) Text -to-SQL Empowered by Large Language Models: A Benchmark Evaluation
Gao, D., Wang, H., Li, Y., Sun, X., Qian, Y., Ding, B. and Zhou, J., (2023) Text -to-SQL Empowered by Large Language Models: A Benchmark Evaluation. [online] Available at: http://arxiv.org/abs/2308.15363
arXiv 2023
-
[4]
CycleGT: Unsupervised Graph-to-Text and Text-to-Graph Generation via Cycle Training
Guo, Q., Jin, Z., Qiu, X., Zhang, W., Wipf, D. and Zhang, Z., (2020) CycleGT: Unsupervised Graph-to-Text and Text -to-Graph Generation via Cycle Training. [online] Available at: http://arxiv.org/abs/2006.04702
work page Pith review arXiv 2020
-
[5]
Gupta, S., Ai, X. and Kavuluru, R., (2023) Comparison of pipeline, sequence-to-sequence, and GPT models for end -to-end relation extraction: experiments with the rare disease use -case. [online] Available at: http://arxiv.org/abs/2311.13729
arXiv 2023
-
[6]
and Zhang, H., (2023) ChartLlama: A Multimodal LLM for Chart Understanding and Generation
Han, Y., Zhang, C., Chen, X., Yang, X., Wang, Z., Yu, G., Fu, B. and Zhang, H., (2023) ChartLlama: A Multimodal LLM for Chart Understanding and Generation. [online] Available at: http://arxiv.org/abs/2311.16483
arXiv 2023
-
[7]
and McMillan, C., (2022) Semantic Similarity Metrics for Evaluating Source Code Summarization
Haque, S., Eberhart, Z., Bansal, A. and McMillan, C., (2022) Semantic Similarity Metrics for Evaluating Source Code Summarization. In: IEEE International Conference on Program Comprehension. IEEE Computer Society, pp.36–47
work page 2022
-
[8]
Huang, Z., Shen, Y., Li, X., Wei, Y., Cheng, G., Zhou, L., Dai, X. and Qu, Y., (2019) GeoSQA: A Benchmark for Scenario-based Question Answering in the Geography Domain at High School Level. [online] Available at: http://arxiv.org/abs/1908.07855
work page Pith review arXiv 2019
Show all 31 references
-
[9]
and De Rijke, M., (2007) Machine learning for question answering from tabular data
Khalid, M.A., Jijkoun, V. and De Rijke, M., (2007) Machine learning for question answering from tabular data. In: Proceedings - International Workshop on Database and Expert Systems
2007
-
[10]
and Chakrabarti, S., (2023) CRUSH4SQL: Collective Retrieval Using Schema Hallucination For Text2SQL
Kothyari, M., Dhingra, D., Sarawagi, S. and Chakrabarti, S., (2023) CRUSH4SQL: Collective Retrieval Using Schema Hallucination For Text2SQL. [online] Available at: http://arxiv.org/abs/2311.01173
2023 arXiv
-
[11]
and Cheng, G., (2021) TSQA: Tabular Scenario Based Question Answering
Li, X., Sun, Y. and Cheng, G., (2021) TSQA: Tabular Scenario Based Question Answering. [online] Available at: http://arxiv.org/abs/2101.11429
2021 arXiv
-
[12]
and Li, G., (2021) nvBench: A Large -Scale Synthesized Dataset for Cross - Domain Natural Language to Visualization Task
Luo, Y., Tang, J. and Li, G., (2021) nvBench: A Large -Scale Synthesized Dataset for Cross - Domain Natural Language to Visualization Task. [online] Available at: http://arxiv.org/abs/2112.12926
2021 arXiv
-
[13]
and Schütze, H., (2024) ToPro: Token-Level Prompt Decomposition for Cross -Lingual Sequence Labeling Tasks
Ma, B., Nie, E., Yuan, S., Schmid, H., Färber, M., Kreuter, F. and Schütze, H., (2024) ToPro: Token-Level Prompt Decomposition for Cross -Lingual Sequence Labeling Tasks. [online] Available at: http://arxiv.org/abs/2401.16589
2024 arXiv
-
[14]
and Susnjak, T., (2023) Chat2VIS: Fine -Tuning Data Visualisations using Multilingual Natural Language Text and Pre-Trained Large Language Models
Maddigan, P. and Susnjak, T., (2023) Chat2VIS: Fine -Tuning Data Visualisations using Multilingual Natural Language Text and Pre-Trained Large Language Models. [online] Available at: http://arxiv.org/abs/2303.14292
2023 arXiv
-
[15]
and Hoque, E., (2022) ChartQA: A Benchmark for Question Answering about Charts with Visual and Logical Reasoning
Masry, A., Long, D.X., Tan, J.Q., Joty, S. and Hoque, E., (2022) ChartQA: A Benchmark for Question Answering about Charts with Visual and Logical Reasoning. [online] Available at: http://arxiv.org/abs/2203.10244
2022 arXiv
-
[16]
and Stasko, J., (2021) NL4DV: A toolkit for generating analytic specifications for data visualization from natural language queries
Narechania, A., Srinivasan, A. and Stasko, J., (2021) NL4DV: A toolkit for generating analytic specifications for data visualization from natural language queries. IEEE Transactions on Visualization and Computer Graphics, 272, pp.369–379
2021
-
[17]
and Takasu, A., (2023) TabIQA: Table Questions Answering on Business Document Images
Nguyen, P., Ly, N.T., Takeda, H. and Takasu, A., (2023) TabIQA: Table Questions Answering on Business Document Images. [online] Available at: http://arxiv.org/abs/2303.14935. Payak Avinash, (2023) AUTOMATIC TEXT SUMMARIZATION AND KEYWORD EXTRACTION USING NATURAL LANGUAGE PROCE...
2023 arXiv
-
[18]
Bin, Meem, F., Mukta, Md.S.H
Rashid, Md.M., Jahan, H.K., Huzzat, A., Rahul, R.A., Zakir, T. Bin, Meem, F., Mukta, Md.S.H. and Shatabda, S., (2021) Text2Chart: A Multi-Staged Chart Generator from Natural Language Text. [online] Available at: http://arxiv.org/abs/2104.04584
2021 arXiv
-
[19]
and Li, Z., (2023a) MAC- SQL: A Multi -Agent Collaborative Framework for Text -to-SQL
Wang, B., Ren, C., Yang, J., Liang, X., Bai, J., Zhang, Q.-W., Yan, Z. and Li, Z., (2023a) MAC- SQL: A Multi -Agent Collaborative Framework for Text -to-SQL. [online] Available at: http://arxiv.org/abs/2312.11242
2023 arXiv
-
[20]
and Shah, S., (2023b) DocGraphLM: Documental Graph Language Model for Information Extraction
Wang, D., Ma, Z., Nourbakhsh, A., Gu, K. and Shah, S., (2023b) DocGraphLM: Documental Graph Language Model for Information Extraction. In: SIGIR 2023 - Proceedings of the 46th International ACM SIGIR Conference on Research and Development in Information Retrieval . Association...
2023
-
[21]
and Qu, H., (2022) A Survey on ML4VIS: Applying Machine Learning Advances to Data Visualization
Wang, Q., Chen, Z., Wang, Y. and Qu, H., (2022) A Survey on ML4VIS: Applying Machine Learning Advances to Data Visualization. IEEE Transactions on Visualization and Computer Graphics, 2812, pp.5134–5153
2022
-
[22]
and Crespo -Quinones, C., (2023) Natural Language Models for Data Visualization Utilizing nvBench Dataset
Wang, S. and Crespo -Quinones, C., (2023) Natural Language Models for Data Visualization Utilizing nvBench Dataset. [online] Available at: http://arxiv.org/abs/2310.00832
2023 arXiv
-
[23]
and Zeng, Z., (2023c) DBCopilot: Scaling Natural Language Querying to Massive Databases
Wang, T., Lin, H., Han, X., Sun, L., Chen, X., Wang, H. and Zeng, Z., (2023c) DBCopilot: Scaling Natural Language Querying to Massive Databases. [online] Available at: http://arxiv.org/abs/2312.03463
2023 arXiv
-
[24]
and Qu, H., (2022) AI4VIS: Survey on Artificial Intelligence Approaches for Data Visualization
Wu, A., Wang, Y., Shu, X., Moritz, D., Cui, W., Zhang, H., Zhang, D. and Qu, H., (2022) AI4VIS: Survey on Artificial Intelligence Approaches for Data Visualization. IEEE Transactions on Visualization and Computer Graphics, 2812, pp.5049–5070. 131
2022
-
[25]
and He, L., (2023) DCQA: Document-Level Chart Question Answering towards Complex Reasoning and Common-Sense Understanding
Wu, A., Xiao, L., Wu, X., Yang, S., Xu, J., Zhuang, Z., Xie, N., Jin, C. and He, L., (2023) DCQA: Document-Level Chart Question Answering towards Complex Reasoning and Common-Sense Understanding. [online] Available at: http://arxiv.org/abs/2310.18983
2023 arXiv
-
[26]
and Radev, D., (2018) Spider: A Large -Scale Human-Labeled Dataset for Complex and Cross -Domain Semantic Parsing and Text -to-SQL Task
Zhang, Z. and Radev, D., (2018) Spider: A Large -Scale Human-Labeled Dataset for Complex and Cross -Domain Semantic Parsing and Text -to-SQL Task. [online] Availa ble at: http://arxiv.org/abs/1809.08887
2018 arXiv
-
[27]
and Charnois, T., (2023) GLiNER: Generalist Model for Named Entity Recognition using Bidirectional Transformer
Zaratiana, U., Tomeh, N., Holat, P. and Charnois, T., (2023) GLiNER: Generalist Model for Named Entity Recognition using Bidirectional Transformer. [online] Available at: http://arxiv.org/abs/2311.08526
2023 arXiv
-
[28]
and Yu, K., (2023a) ACT -SQL: In-Context Learning for Text-to-SQL with Automatically -Generated Chain -of-Thought
Zhang, H., Cao, R., Chen, L., Xu, H. and Yu, K., (2023a) ACT -SQL: In-Context Learning for Text-to-SQL with Automatically -Generated Chain -of-Thought. [online] Available at: http://arxiv.org/abs/2310.17342
2023 arXiv
-
[29]
and Zhang, Y., (2024) CFRet -DVQA: Coarse-to-Fine Retrieval and Efficient Tuning for Document Visual Question Answering
Zhang, J., Yu, Y. and Zhang, Y., (2024) CFRet -DVQA: Coarse-to-Fine Retrieval and Efficient Tuning for Document Visual Question Answering. [online] Available at: http://arxiv.org/abs/2403.00816
2024 arXiv
-
[30]
and Yang, H., (2023b) Natural Language Interfaces for Tabular Data Querying and Visualization: A Survey
Zhang, W., Wang, Y., Song, Y., Wei, V.J., Tian, Y., Qi, Y., Chan, J.H., Wong, R.C.-W. and Yang, H., (2023b) Natural Language Interfaces for Tabular Data Querying and Visualization: A Survey. [online] Available at: http://arxiv.org/abs/2310.17894
2023 arXiv
-
[31]
and Chua, T.-S., (2021) TAT- QA: A Question Answering Benchmark on a Hybrid of Tabular and Textual Content in Finance
Zhu, F., Lei, W., Huang, Y., Wang, C., Zhang, S., Lv, J., Feng, F. and Chua, T.-S., (2021) TAT- QA: A Question Answering Benchmark on a Hybrid of Tabular and Textual Content in Finance. [online] Available at: http://arxiv.org/abs/2105.07624
2021 arXiv
Reviewed August 10, 2026 · model on record in the stance chip above.
Discussion (0). Continue with ORCID to comment.