A MUSE View of the Optical Torus within the Supernova Remnant 1E 0102.2-7219
Pith reviewed 2026-06-26 23:53 UTC · model grok-4.3
The pith
MUSE observations show that no single physical model accounts for both neutral and high-ionization lines in the optical torus of supernova remnant 1E 0102.2-7219.
A machine-rendered reading of the paper's core claim, the machinery that carries it, and where it could break.
Core claim
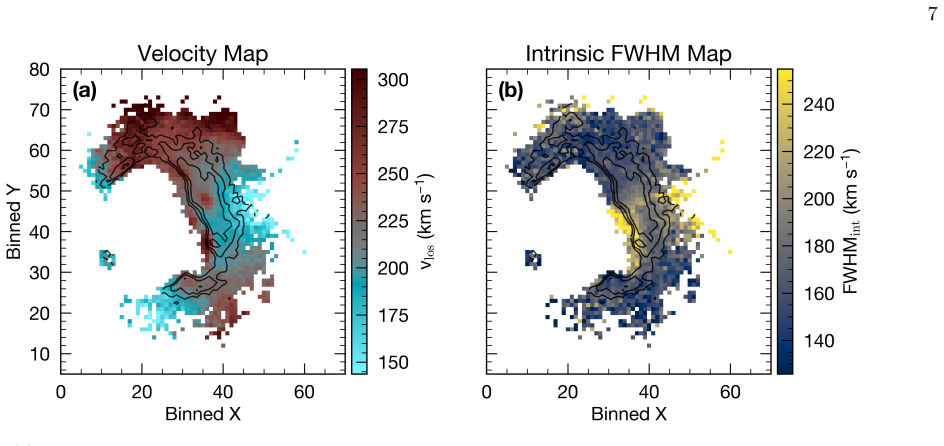
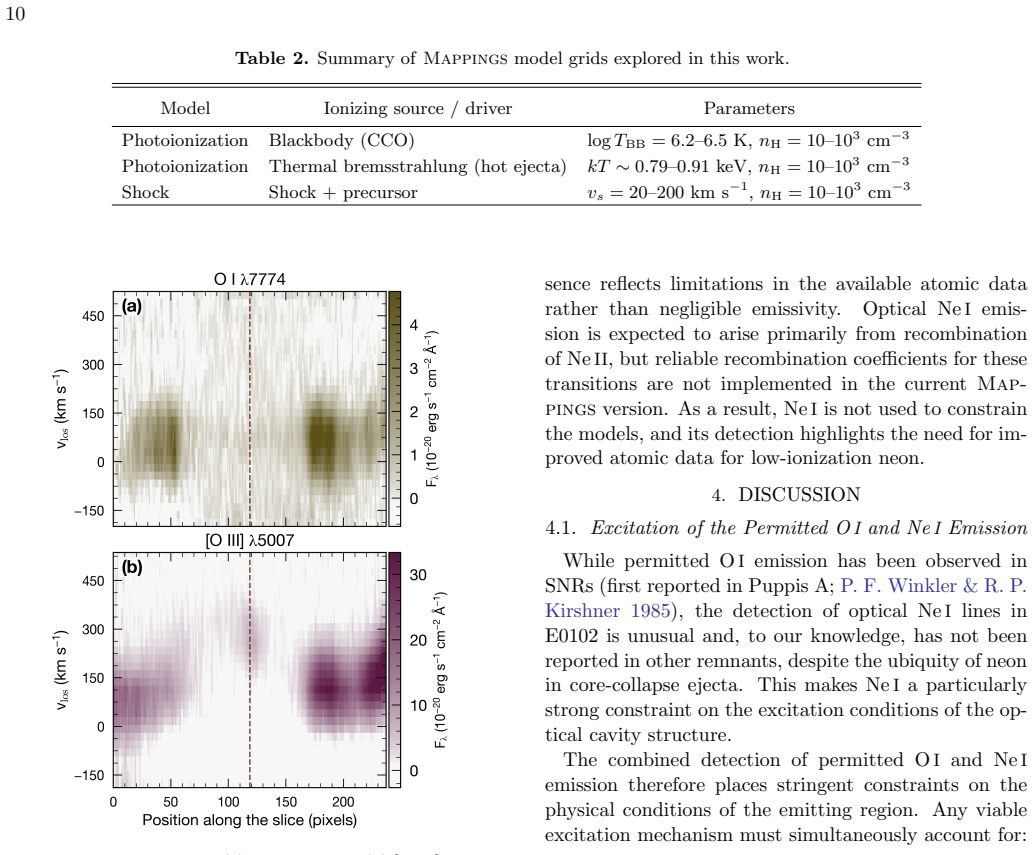
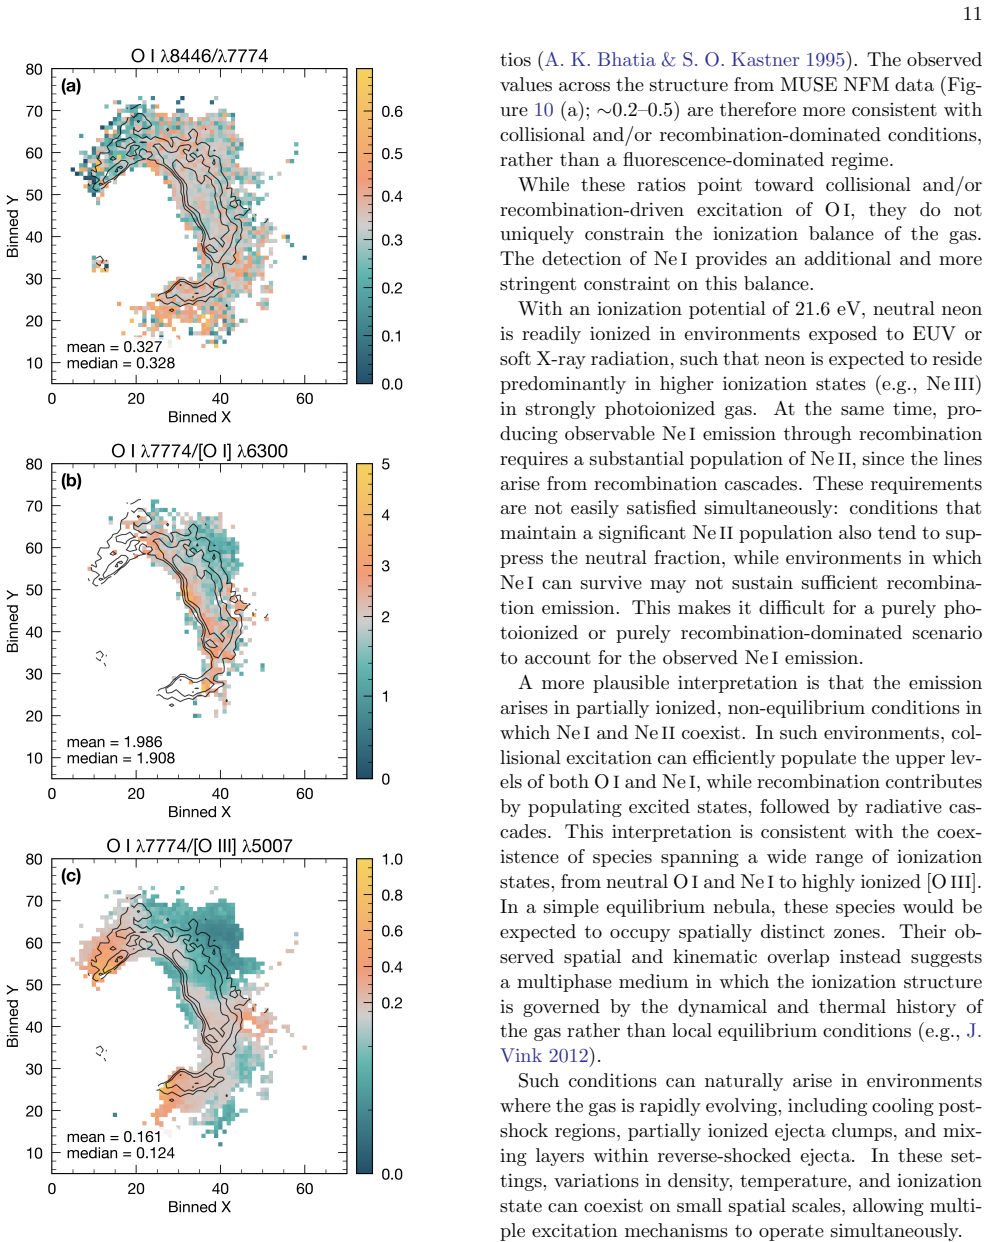
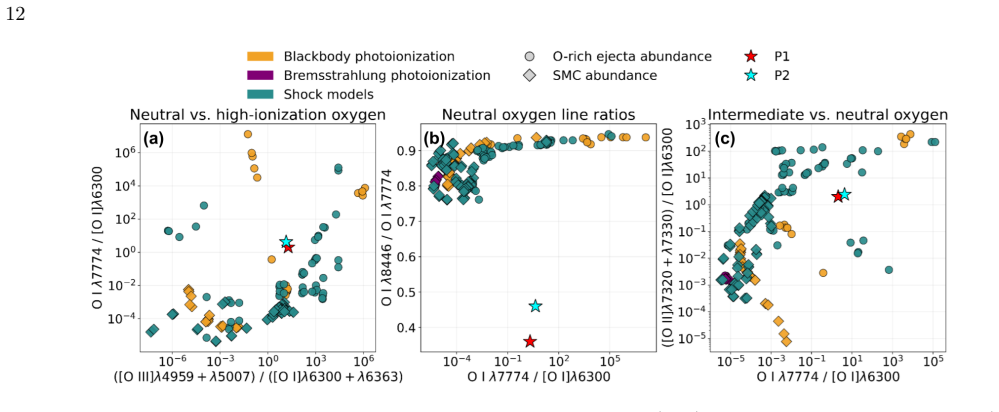
The improved spatial resolution resolves the previously identified torus into a cavity-like structure with a sharply defined inner edge and diffuse, outer filamentary substructure. The emission shows continuous velocity connectivity, broad intrinsic line widths, and co-spatial contributions from neutral and partially ionized species, including O I, Ne I, [O I], [O II], and [O III]. Spatially resolved line-ratio maps indicate that the emission arises from a multiphase, non-equilibrium medium rather than a single homogeneous component. Comparison with photoionization and shock models shows that no single-component model within the explored parameter space can simultaneously reproduce both the
What carries the argument
Spatially resolved line-ratio maps tested against grids of photoionization and shock models, which together demonstrate that multiple physical conditions must coexist.
If this is right
- Shocks propagating through density inhomogeneities in the supernova ejecta shape the observed cavity morphology and line excitation.
- Neutral and high-ionization emission arise from co-spatial but physically distinct regions within the same structure.
- The medium is out of equilibrium, with broad line widths reflecting the effects of shocks or turbulence.
- Alternative ionization mechanisms tied to the central compact object candidate or binary evolution remain possible but are not required by the current data.
Where Pith is reading between the lines
- Other oxygen-rich supernova remnants with central compact objects may display similarly complex line ratios that also require multi-component modeling.
- Higher-resolution integral-field spectroscopy could directly map the density jumps at the cavity edge and test the shock-inhomogeneity picture.
- Multi-wavelength monitoring could check whether the central source contributes variable ionization that is currently hidden within the shock-dominated emission.
Load-bearing premise
The ranges covered by the photoionization and shock model grids are broad enough that the absence of a single-component fit is not simply due to missing parts of parameter space.
What would settle it
Discovery of one set of density, ionization parameter, and shock velocity values that simultaneously matches the observed strengths of both neutral lines such as O I and high-ionization lines such as [O III] inside the existing model grids or a modest extension of them.
Figures
read the original abstract
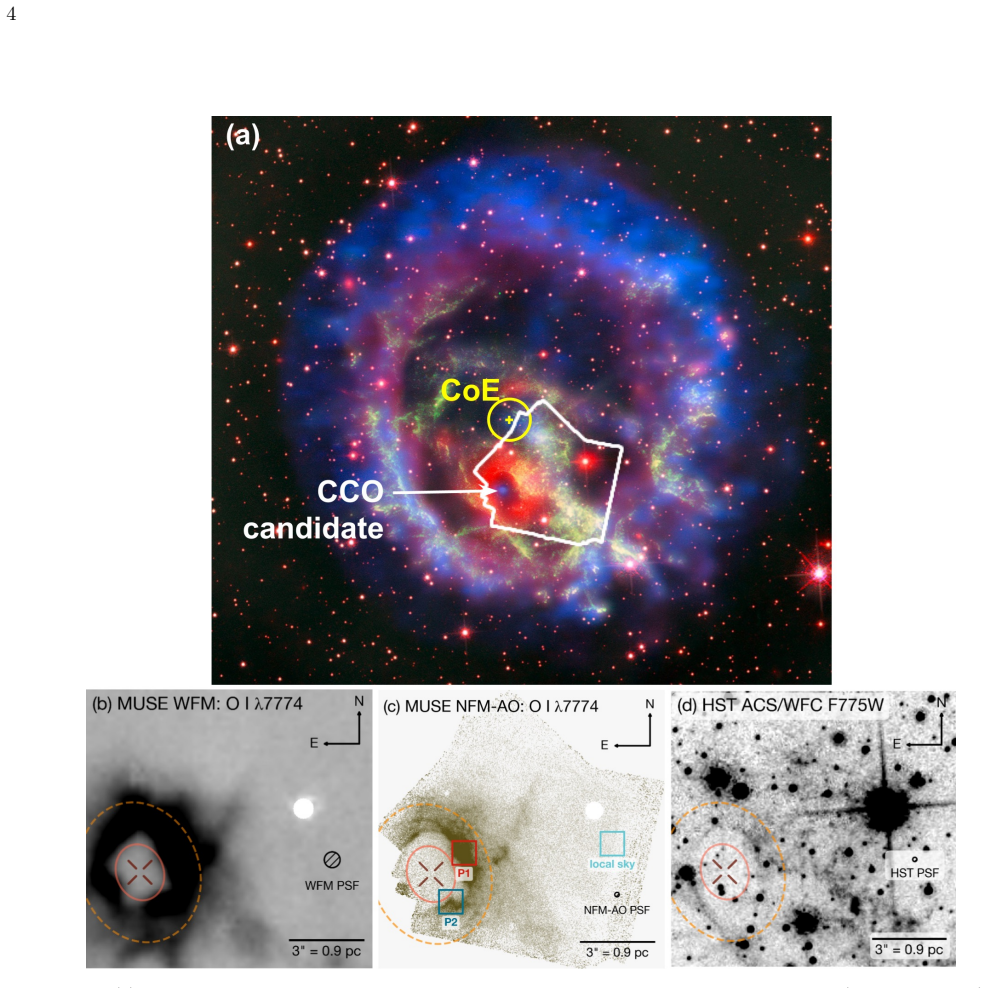
We present new MUSE Narrow Field Mode with Adaptive Optics observations of the optical torus surrounding a Central Compact Object (CCO) candidate within the oxygen-rich supernova remnant 1E 0102.2-7219 (E0102) located in the Small Magellanic Cloud. These data provide nearly an order-of-magnitude improvement in spatial resolution over previous MUSE Wide Field Mode observations. The improved spatial resolution resolved the previously identified torus into a cavity-like structure with a sharply defined inner edge and diffuse, outer filamentary substructure. The emission shows continuous velocity connectivity, broad intrinsic line widths, and co-spatial contributions from neutral and partially ionized species, including O I, Ne I, [O I], [O II], and [O III]. Spatially resolved line-ratio maps indicate that the emission arises from a multiphase, non-equilibrium medium rather than a single homogeneous component. Comparison with photoionization and shock models shows that no single-component model within the explored parameter space can simultaneously reproduce both the strong neutral and high-ionization diagnostics, indicating that multiple physical conditions must coexist. We favor an interpretation in which shocks propagating through density inhomogeneities in the ejecta shape the observed morphology and excitation, while also considering alternative mechanisms linked to the central source, binary evolution, or interaction with an embedded object within the remnant.
Editorial analysis
A structured set of objections, weighed in public.
Referee Report
Summary. The paper reports MUSE Narrow Field Mode adaptive-optics observations of the optical torus around the CCO candidate in the oxygen-rich SNR 1E 0102.2-7219. These data resolve the torus into a cavity-like structure with a sharply defined inner edge and diffuse filamentary outer substructure, showing continuous velocity fields, broad line widths, and co-spatial emission from neutral (O I, Ne I, [O I]) and higher-ionization ([O II], [O III]) species. Spatially resolved line-ratio maps are compared to grids of photoionization and shock models; the authors conclude that no single-component model within the explored parameter space simultaneously reproduces the strong neutral and high-ionization diagnostics, implying a multiphase, non-equilibrium medium best explained by shocks propagating through density inhomogeneities in the ejecta.
Significance. If the model-comparison result holds, the work supplies spatially resolved evidence that optical tori in young oxygen-rich SNRs require multiple physical conditions rather than a single homogeneous zone, with direct implications for ejecta structure, CCO environments, and non-equilibrium ionization modeling. The nearly order-of-magnitude gain in spatial resolution over prior MUSE WFM data is a clear observational advance, and the explicit statement that the conclusion is limited to the explored grids is a positive transparency measure.
major comments (1)
- [model-comparison section] Abstract and model-comparison section: The central claim that 'no single-component model within the explored parameter space' reproduces both the neutral (O I/[O I]) and high-ionization ([O III]) diagnostics is load-bearing for the multiphase conclusion. The manuscript must explicitly tabulate or describe the full ranges sampled for density, ionization parameter, shock velocity, pre-shock density, and abundances (including O-rich ejecta patterns) so that readers can verify whether viable single-zone solutions lie outside the grids rather than being excluded by the data.
minor comments (2)
- [abstract] The abstract and text use both '1E 0102.2-7219' and 'E0102'; a single consistent designation should be adopted after first use.
- [results section] Line-ratio maps are described as indicating multiphase gas, but the precise diagnostic ratios (e.g., [O I]/Hα vs. [O III]/Hβ) and their error maps are not referenced to a specific figure or table; adding these cross-references would improve traceability.
Simulated Author's Rebuttal
We thank the referee for their constructive review and for highlighting the need for greater transparency in the model-comparison analysis. We address the single major comment below.
read point-by-point responses
-
Referee: [model-comparison section] Abstract and model-comparison section: The central claim that 'no single-component model within the explored parameter space' reproduces both the neutral (O I/[O I]) and high-ionization ([O III]) diagnostics is load-bearing for the multiphase conclusion. The manuscript must explicitly tabulate or describe the full ranges sampled for density, ionization parameter, shock velocity, pre-shock density, and abundances (including O-rich ejecta patterns) so that readers can verify whether viable single-zone solutions lie outside the grids rather than being excluded by the data.
Authors: We agree that the claim requires explicit documentation of the explored grids to allow independent verification. In the revised manuscript we will add a table (or expanded methods subsection) that lists the full sampled ranges for density, ionization parameter, shock velocity, pre-shock density, and abundances, including the specific O-rich ejecta abundance patterns adopted from the literature. This addition will make the parameter-space coverage transparent without altering the scientific conclusion. revision: yes
Circularity Check
No circularity: observational data compared to external model grids
full rationale
The paper reports MUSE observations of emission lines in the SNR torus and compares observed line ratios (O I, [O I], [O III], etc.) to grids of photoionization and shock models. The central claim—that no single-component model reproduces both neutral and high-ionization diagnostics—is reached by direct inspection of model outputs against data within the stated parameter ranges. No equation or result is defined in terms of itself, no fitted parameter is relabeled as a prediction, and no load-bearing premise rests on a self-citation chain. The model grids are external (standard codes with varied density, ionization parameter, velocity, abundance), and the conclusion follows from their failure to match, without reduction to the paper's own inputs by construction. This is a standard observational-model comparison workflow; the analysis is self-contained against external benchmarks.
Axiom & Free-Parameter Ledger
axioms (2)
- domain assumption Line identifications for O I, Ne I, [O I], [O II], and [O III] are correct and uncontaminated.
- domain assumption The parameter space searched in the photoionization and shock models is representative of the physical conditions present.
Reference graph
Works this paper leans on
-
[1]
Alsaberi, R. Z. E., Filipovi´ c, M. D., Dai, S., et al. 2024, MNRAS, 527, 1444, doi: 10.1093/mnras/stad3300 Astropy Collaboration, Robitaille, T. P., Tollerud, E. J., et al. 2013, ˚ a, 558, A33, doi: 10.1051/0004-6361/201322068 Astropy Collaboration, Price-Whelan, A. M., Sip˝ ocz, B. M., et al. 2018, 156, 123, doi: 10.3847/1538-3881/aabc4f Astropy Collabo...
-
[2]
Ground-based and Airborne Instrumentation for Astronomy III , year = 2010, editor =
Bacon, R., Accardo, M., Adjali, L., et al. 2010, in Society of Photo-Optical Instrumentation Engineers (SPIE) Conference Series, Vol. 7735, Ground-based and Airborne Instrumentation for Astronomy III, ed. I. S. McLean, S. K. Ramsay, & H. Takami, 773508, doi: 10.1117/12.856027
-
[3]
2021, ApJ, 912, 33, doi: 10.3847/1538-4357/abe2a7
Banovetz, J., Milisavljevic, D., Sravan, N., et al. 2021, ApJ, 912, 33, doi: 10.3847/1538-4357/abe2a7
-
[4]
Bhatia, A. K., & Kastner, S. O. 1995, ApJS, 96, 325, doi: 10.1086/192121
-
[5]
Blair, W. P., Morse, J. A., Raymond, J. C., et al. 2000, ApJ, 537, 667, doi: 10.1086/309077
-
[6]
Bowen, I. S. 1947, PASP, 59, 196, doi: 10.1086/125951
-
[7]
Chevalier, R. A., & Kirshner, R. P. 1979, ApJ, 233, 154, doi: 10.1086/157377
-
[8]
Dopita, M. A. 1987, Australian Journal of Physics, 40, 789, doi: 10.1071/PH870789
-
[9]
Dopita, M. A., Tuohy, I. R., & Mathewson, D. S. 1981, ApJL, 248, L105, doi: 10.1086/183635
-
[10]
English, J., Richardson, M. L. A., Ferrand, G., & Deg, N. 2024, CosmosCanvas: Useful color maps for different astrophysical properties,, Astrophysics Source Code Library, record ascl:2401.005 http://ascl.net/2401.005
2024
-
[11]
Finkelstein, S. L., Morse, J. A., Green, J. C., et al. 2006, ApJ, 641, 919, doi: 10.1086/500570
-
[12]
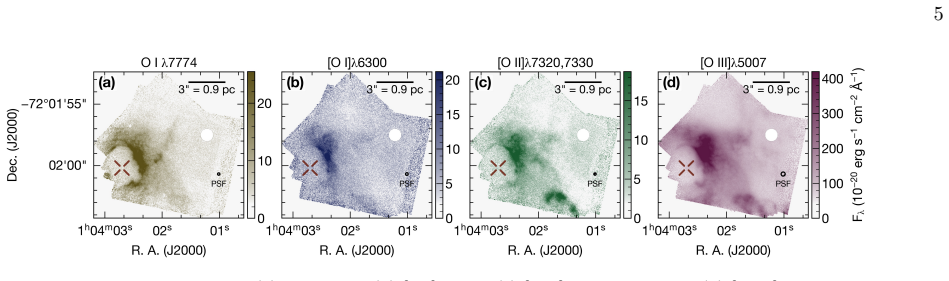
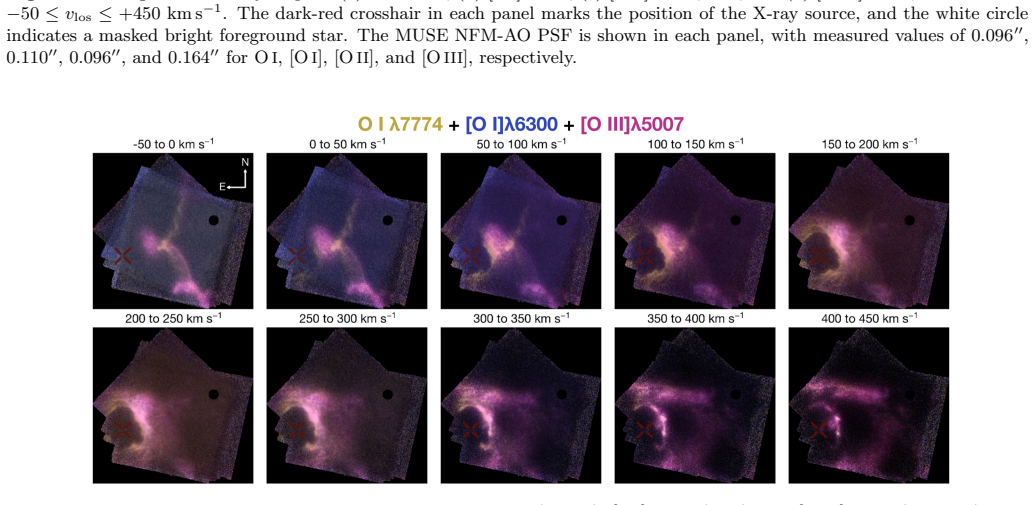
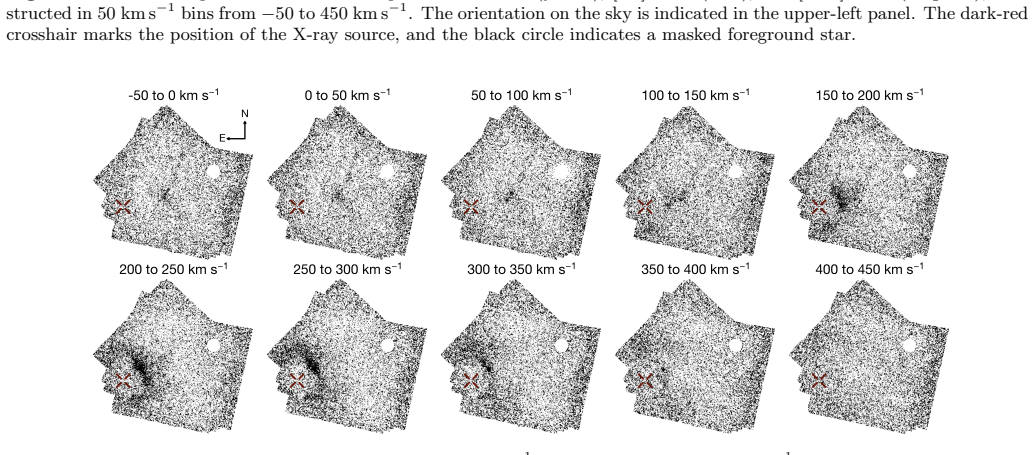
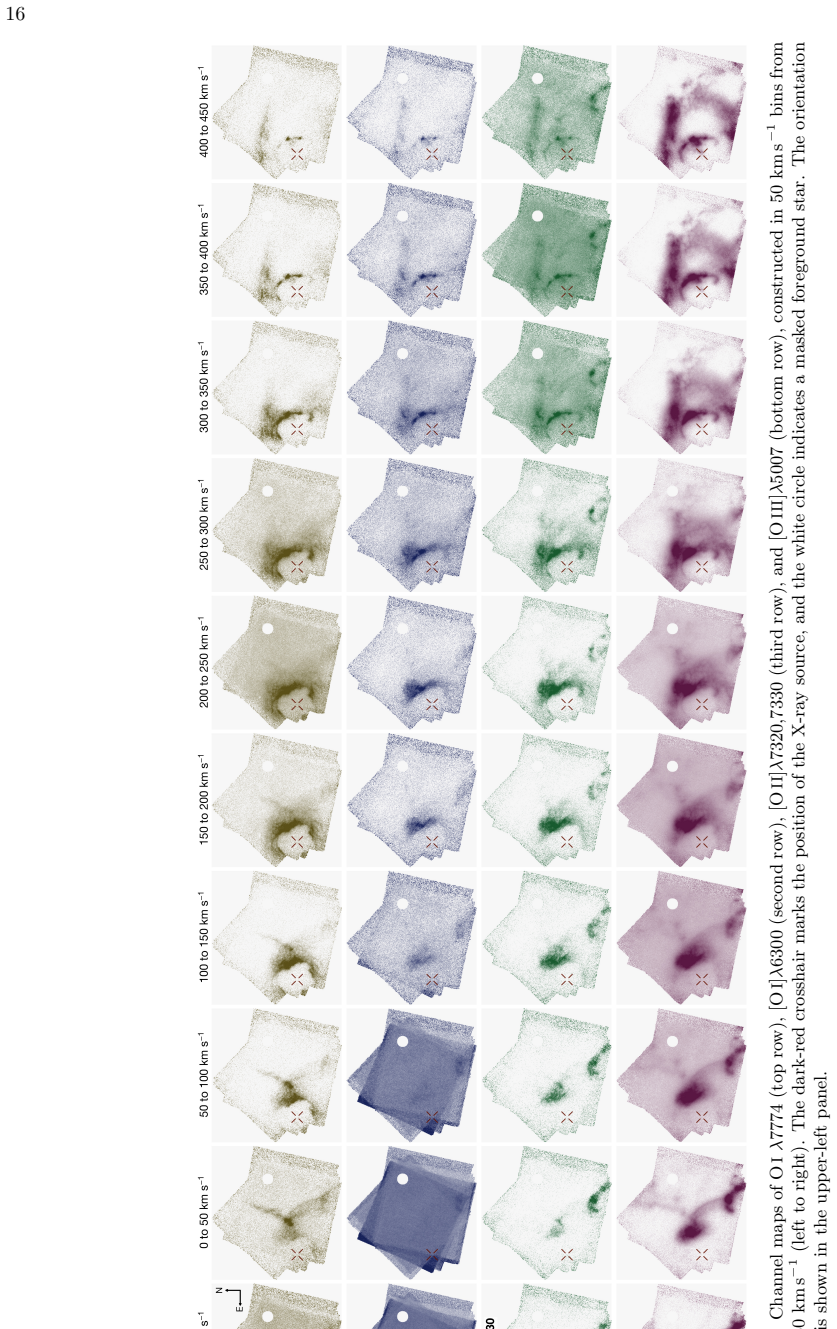
Fitzpatrick, E. L. 1999, PASP, 111, 63, doi: 10.1086/316293 16 Figure 12.Channel maps of OIλ7774 (top row), [OI]λ6300 (second row), [OII]λ7320,7330 (third row), and [OIII]λ5007 (bottom row), constructed in 50 km s −1 bins from −50 to +450 km s−1 (left to right). The dark-red crosshair marks the position of the X-ray source, and the white circle indicates ...
-
[13]
M., Ballester P., Forchi V., Garc \' a-Dabl \'o C
Freudling, W., Romaniello, M., Bramich, D. M., et al. 2013, A&A, 559, A96, doi: 10.1051/0004-6361/201322494
-
[14]
Gotthelf, E. V., Halpern, J. P., & Alford, J. 2013, ApJ, 765, 58, doi: 10.1088/0004-637X/765/1/58
-
[15]
Graczyk, D., Pietrzy´ nski, G., Thompson, I. B., et al. 2020, ApJ, 904, 13, doi: 10.3847/1538-4357/abbb2b
-
[16]
Hebbar, P. R., Heinke, C. O., & Ho, W. C. G. 2020, MNRAS, 491, 1585, doi: 10.1093/mnras/stz2570
-
[17]
Hunter, J. D. 2007, Computing in Science & Engineering, 9, 90, doi: 10.1109/MCSE.2007.55
-
[18]
1981, PASJ, 33, 1, doi: 10.1093/pasj/33.1.1
Itoh, H. 1981, PASJ, 33, 1, doi: 10.1093/pasj/33.1.1
-
[19]
1986, PASJ, 38, 717, doi: 10.1093/pasj/38.5.717
Itoh, H. 1986, PASJ, 38, 717, doi: 10.1093/pasj/38.5.717
-
[20]
Kastner, S. O., & Bhatia, A. K. 1995, ApJ, 439, 346, doi: 10.1086/175178
-
[21]
Li, C.-J., Seitenzahl, I. R., Ishioka, R., et al. 2021, ApJ, 915, 20, doi: 10.3847/1538-4357/abf7c5
-
[22]
Long, X., Gaetz, T. J., & Plucinsky, P. P. 2020, ApJ, 904, 70, doi: 10.3847/1538-4357/abc075
-
[23]
Osterbrock, D. E., Fulbright, J. P., Martel, A. R., et al. 1996, PASP, 108, 277, doi: 10.1086/133722
-
[24]
Reynolds, C. S., Kara, E. A., Mushotzky, R. F., et al. 2023, in Society of Photo-Optical Instrumentation Engineers (SPIE) Conference Series, Vol. 12678, UV, X-Ray, and Gamma-Ray Space Instrumentation for Astronomy XXIII, ed. O. H. Siegmund & K. Hoadley, 126781E, doi: 10.1117/12.2677468
-
[25]
Russell, S. C., & Dopita, M. A. 1992, ApJ, 384, 508, doi: 10.1086/170893
-
[26]
Seabold, S., & Perktold, J. 2010, SciPy 2010, doi: 10.25080/Majora-92bf1922-011
-
[27]
Seitenzahl, I. R., Vogt, F. P. A., Terry, J. P., et al. 2018, ApJL, 853, L32, doi: 10.3847/2041-8213/aaa958
-
[28]
Seward, F. D., & Mitchell, M. 1981, ApJ, 243, 736, doi: 10.1086/158641
-
[29]
Suherli, J. 2026, velociwrap: velocity-consistent (pseudo-RGB) channel maps for astronomical datacubes, v1.0.0 Zenodo, doi: 10.5281/zenodo.20604383
-
[30]
Suherli, J., Seitenzahl, I. R., Safi-Harb, S., et al. 2026, ApJL, 997, L36, doi: 10.3847/2041-8213/ae27c4
-
[31]
2018, MAPPINGS V: Astrophysical plasma modeling code,, Astrophysics Source Code Library, record ascl:1807.005 http://ascl.net/1807.005
Sutherland, R., Dopita, M., Binette, L., & Groves, B. 2018, MAPPINGS V: Astrophysical plasma modeling code,, Astrophysics Source Code Library, record ascl:1807.005 http://ascl.net/1807.005
2018
-
[32]
Sutherland, R. S., & Dopita, M. A. 1995, ApJ, 439, 381, doi: 10.1086/175181
-
[33]
Sutherland, R. S., & Dopita, M. A. 2017, ApJS, 229, 34, doi: 10.3847/1538-4365/aa6541
-
[34]
2012, A&A Rv, 20, 49, doi: 10.1007/s00159-011-0049-1
Vink, J. 2012, A&A Rv, 20, 49, doi: 10.1007/s00159-011-0049-1
-
[35]
Virtanen, P., Gommers, R., Oliphant, T. E., et al. 2020, Nature Methods, 17, 261, doi: 10.1038/s41592-019-0686-2
-
[36]
Vogt, F., & Dopita, M. A. 2010, ApJ, 721, 597, doi: 10.1088/0004-637X/721/1/597
-
[37]
Vogt, F. P. A. 2019, brutifus: Python module to post-process datacubes from integral field spectrographs,, Astrophysics Source Code Library, record ascl:1903.004 http://ascl.net/1903.004
2019
-
[38]
Vogt, F. P. A., Bartlett, E. S., Seitenzahl, I. R., et al. 2018, Nature Astronomy, 2, 465, doi: 10.1038/s41550-018-0433-0
-
[39]
2017a, A&A, 602, L4, doi: 10.1051/0004-6361/201730756 19
Ghavamian, P. 2017a, A&A, 602, L4, doi: 10.1051/0004-6361/201730756 19
-
[40]
Vogt, F. P. A., Seitenzahl, I. R., Dopita, M. A., & Ruiter, A. J. 2017b, PASP, 129, 058012, doi: 10.1088/1538-3873/129/975/058012
-
[41]
M., Palsa , R., Streicher , O., et al
Weilbacher, P. M., Palsa, R., Streicher, O., et al. 2020, A&A, 641, A28, doi: 10.1051/0004-6361/202037855
-
[42]
Winkler, P. F., & Kirshner, R. P. 1985, ApJ, 299, 981, doi: 10.1086/163764
-
[43]
Patnaude, D. J. 2019, ApJ, 874, 14, doi: 10.3847/1538-4357/ab09ea
discussion (0)
Sign in with ORCID, Apple, or X to comment. Anyone can read and Pith papers without signing in.