REVIEW 3 major objections 5 minor 23 references
Multi-Head Explainer: A General Framework to Improve Explainability in CNNs and Transformers
T0 review · 3 major / 5 minor · reviewed 2026-08-10 · deepseek-v4-flash
Pith's one-line read A modular framework, the Multi-Head Explainer, claims to make CNNs and Transformers both more accurate and more interpretable by inserting attention-gated deep supervision into existing architectures.
desk verdict A well-written engineering paper whose explainability and accuracy claims are contradicted by its own tables and a circular evaluation metric. read the letter →
The pith
A machine-rendered reading of the paper's core claim, the machinery that carries it, and where it could break.
The reading
What carries the argument
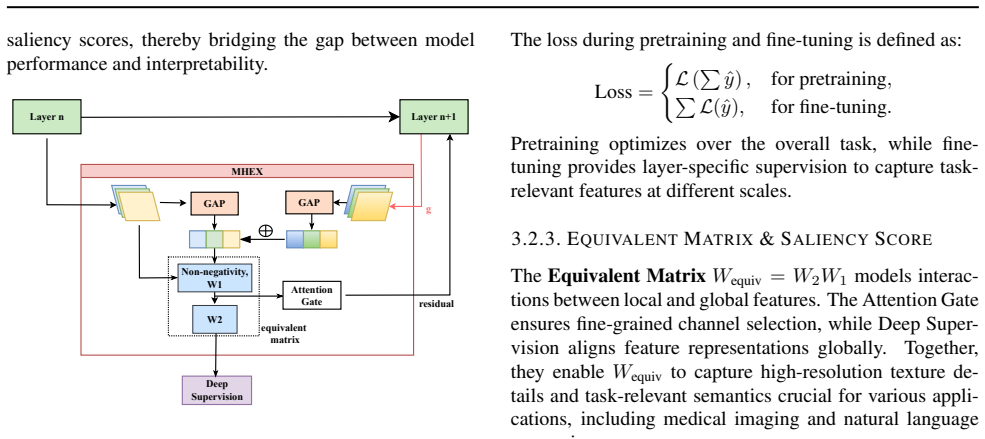
The load-bearing object is the Equivalent Matrix $W_{\mathrm{equiv}}=W_2W_1$, which combines the two learned matrices of each MHEX block into a single class-to-feature map. The Attention Gate computes channel weights $g=\sigma(W_1\cdot \mathrm{GAP}(x+x_{\mathrm{global}}))$ to emphasize task-relevant features, Deep Supervision optimizes the equivalent matrix at multiple depths so shallow layers learn fine details, and the ReLU non-negativity constraint plus the salience-sharpness filter remove negative and class-unspecific channels before the CAM or token scores are computed. For images the final CAM aggregates layer-wise maps with weight $\alpha_l$; for text the saliency score sums contributions from the first three layers to avoid over-smoothing. The quantitative comparison also depends on the EAD metric, whose area weighting $f(x)=5x/(1+256x^5)$ peaks when the saliency map covers 25 percent of the image.
What would settle it
A direct test: on a dataset with small ground-truth objects, compute EAD for MHEX and for a method that perfectly outlines the object. If the perfect-outline method scores worse purely because the map covers less than 25 percent of the image, then EAD, and the quantitative explainability advantage built on it, fails.
Extended reading notes
Core claim
MHEX's central claim is that a single, modular scaffold can improve both classification accuracy and explanation quality in CNNs and Transformers at the same time. The scaffold consists of an Attention Gate that reweights feature channels by local and global context, Deep Supervision that trains early layers with the classification objective, and an Equivalent Matrix $W_{\mathrm{equiv}}=W_2W_1$ that maps activated features to class scores. After fine-tuning, the extra prediction heads can be discarded, leaving the original network intact while the learned matrix still supports detailed saliency maps for images or token saliency scores for text. The paper evaluates this claim on ImageNet1k, four MedMNIST biomedical datasets, and AG News, reporting that MHEX-Net matches or exceeds ResNet-18 baselines and that its saliency maps resemble semantic segmentation, whereas Grad-CAM, SHAP, and Layer-CAM produce coarser or more fragmented highlights.
Load-bearing premise
The quantitative case that MHEX explains better than other methods rests on the EAD metric, whose weighting function assumes a good saliency map covers about 25 percent of the input image; if compact explanations are legitimate, the comparison does not hold.
Editorial extensions
If this is right
- If the accuracy gains replicate, MHEX gives a low-cost way to attach explainability to existing ResNet and BERT models, adding only $1920 \times n_{\mathrm{classes}} + 0.69$M parameters to ResNet-18.
- Because the MHEX prediction heads can be removed after fine-tuning, the original model architecture and inference cost are largely preserved while the learned equivalent matrix still provides explanations.
- On medical imaging, MHEX saliency maps approach semantic segmentation, so they could serve as a coarse localizer of pathological regions without training a separate segmentation network.
- If EAD becomes a standard metric, explainability methods will be pressured to emit maps covering about a quarter of the image rather than small or scattered regions.
- For text, the three-layer saliency aggregation means MHEX-BERT avoids the uniform attention that plagues deep transformers, keeping explanations informative.
Reading between the lines
- The paper's AG News comparison shows SHAP achieves a higher Average Drop than MHEX-BERT, so the intrinsic saliency scores are not necessarily more faithful under perturbation; a natural extension is to calibrate MHEX scores against drop-based measures.
- Because EAD peaks at 25 percent coverage, applying the same metric to fine-grained tasks like tumor detection could unfairly penalize a correct compact map; re-weighting by object size is a testable fix.
- The authors' own note that GNNs lack residual connections suggests the framework's portability depends on introducing residual links, making graph and segmentation applications a concrete next step rather than an automatic gain.
Editorial analysis
A structured set of objections, weighed in public.
Referee Report
Summary. The paper introduces the Multi-Head Explainer (MHEX), a modular framework combining an Attention Gate, Deep Supervision, and an Equivalent Matrix, and claims that it improves both classification accuracy and explainability when integrated into ResNet and BERT. The authors report experiments on ImageNet1k, four MedMNIST datasets, and AG News, and propose new evaluation metrics (SAD and EAD) for saliency quality. The central claims are that MHEX 'not only improves classification accuracy but also produces highly interpretable and detailed saliency scores' (Abstract) and 'consistently outperforms the baseline in most tasks' (Section 4.2).
Significance. If the central claims were supported, MHEX would be a practically useful and easily deployable module for improving interpretability in CNNs and Transformers, with modest extra parameters and the ability to remove the prediction heads after fine-tuning. The paper includes several strengths: the code is made available, the Appendix documents training details and derivations, and the authors are candid about limitations (e.g., SHAP attaining higher AVG Drop on AG News, and the caveat that the collaboration metric needs further validation). However, the main empirical evidence for the explainability claim is internally contradictory and partly circular, and the accuracy comparison against unmatched official benchmarks is not interpretable as a controlled improvement. These issues bear directly on the paper's two central claims.
major comments (3)
- [Section 4.5, Table 3] The text states that on PathMNIST 'MHEX-Net effectively captures these details, resulting in superior performance across all three metrics,' but Table 3 reports lower-is-better metrics where MHEX is the worst method on every row. Specifically, for PathMNIST, MHEX has SAD=0.2082 vs. Grad-CAM=0.1181 and Layer-CAM=0.1069; AVG Drop=0.4276 vs. 0.1522 and 0.1247; EAD=0.0710 vs. 0.0650 and 0.0600. For BloodMNIST, MHEX's EAD is 0.1894 vs. 0.1106 and 0.0808. These numbers directly contradict the claim of superior explainability and must be corrected or the claims substantially revised.
- [Appendix B.1, Section 3.5.3, Section 4.3] The EAD metric is defined using a weighting function f(x)=5x/(1+256x^5) that is solved from the conditions f(0.25)=1 and f'(0.25)=0, i.e., the metric is constructed to reward saliency maps covering about 25% of the image. No independent evidence is given that 25% coverage is the correct target for colon pathology or blood-cell images. Since MHEX maps are described as 'closely resembling semantic segmentation' (Section 4.3) and therefore have broad coverage, the EAD comparison appears tuned to MHEX's output geometry rather than to an external notion of faithfulness. The paper should justify E=0.25 or rely on metric-free or standard evaluation protocols.
- [Section 4.2, Table 1, Appendix D] Table 1 compares MHEX-Net accuracy against official benchmark values (MedMNIST and PyTorch ResNet-18), not against baselines retrained with the same training schedule, optimizer, augmentation, and epochs described in Appendix D. Therefore the reported gains (e.g., ImageNet 70.57 vs. 69.75) are uninterpretable as effects of the MHEX module. Moreover, the AG News row shows MHEX-BERT (93.63) below the reported BERT baseline (94.56), which contradicts the claim in the text that MHEX consistently outperforms the baseline in most tasks. A matched, same-schedule comparison is needed for any accuracy claim.
minor comments (5)
- [Title/Abstract] The arXiv title reads 'A General Framework' while the paper's title reads 'A General Scalable Framework'; please make them consistent.
- [Appendix D.3] The heading 'Fine-Tunin on BERT' contains a typo; it should read 'Fine-Tuning on BERT'.
- [Figure 7 caption] The caption states 'All correlations are significant (p = 0)', but p-values cannot equal zero; please report p < 0.0001 or similar.
- [Section 3.2.3] In the Transformer saliency formula, the meaning of the summation limit D is not defined; please state that D is the hidden/feature dimension.
- [Section 4.5] The AG News paragraph reports that SHAP achieved a higher AVG Drop than MHEX-BERT, which is an honest but important caveat; this should be reflected in the abstract and conclusion, where the claim of generally superior explainability is stated without this qualification.
Circularity Check
No circular derivation is exhibited: MHEX's construction is not equivalent to its evaluation, although the EAD metric is arbitrary and Table 3 contradicts the text's claims.
full rationale
No load-bearing step in the paper reduces a claimed prediction to its own inputs by construction. MHEX is assembled from cited components (attention gate, deep supervision) plus linear weight products, and the saliency maps are defined as weighted combinations of activations; the accuracy comparisons are against external benchmarks. The EAD weighting function is indeed solved from f(0.25)=1 and f'(0.25)=0 in Appendix B.1, making the 25%-coverage optimum an arbitrary design choice rather than an independently grounded measure of faithfulness. However, this is a metric-validity problem, not circularity: MHEX's loss and saliency construction do not optimize EAD, and the reported EAD values in Table 3 actually place MHEX below Grad-CAM and Layer-CAM on both PathMNIST and BloodMNIST. The text's assertion of 'superior performance across all three metrics' contradicts its own table (Section 4.5), and the AG News row of Table 1 shows MHEX-BERT below the BERT baseline; these are serious reporting/correctness issues, but they are not instances of a derivation collapsing into its inputs. The only self-citation is the GAT paper (Veličković et al., 2017), in which co-author Liò appears; it is cited in Appendix E only as an example of GNNs lacking residual connections and is not load-bearing for the central claims. Accordingly, no circular step can be exhibited, and the appropriate finding is no significant circularity.
Assumptions & free parameters
free parameters (5)
- alpha (negative contribution weight) =
0 to 0.5 depending on dataset
- SS (salience sharpness threshold) =
1/nclass + epsilon with epsilon in [0.1,0.3]
- alpha_l (layer aggregation weight for CAM) =
0.9
- L (number of BERT layers used for saliency) =
3
- E (optimal saliency area for EAD weighting) =
0.25
assumptions (4)
- domain assumption Features T in the entropy-reduction derivation follow a standard normal distribution N(0,1).
- domain assumption ReLU non-negativity improves saliency interpretability.
- ad hoc to paper A good saliency map covers approximately 25% of the image area.
- domain assumption Attention weights are not meaningful explanations (Jain and Wallace 2019).
Cite this review
Pith. "Pith review of Multi-Head Explainer: A General Framework to Improve Explainability in CNNs and Transformers." pith.science (2026). https://pith.science/paper/RAGNCFNP
@misc{pith2026250101311,
  author       = {Pith},
  title        = {Pith review of: Multi-Head Explainer: A General Framework to Improve Explainability in CNNs and Transformers},
  year         = {2026},
  howpublished = {\url{https://pith.science/paper/RAGNCFNP}},
  note         = {Machine review of arXiv:2501.01311}
}
read the original abstract
In this study, we introduce the Multi-Head Explainer (MHEX), a versatile and modular framework that enhances both the explainability and accuracy of Convolutional Neural Networks (CNNs) and Transformer-based models. MHEX consists of three core components: an Attention Gate that dynamically highlights task-relevant features, Deep Supervision that guides early layers to capture fine-grained details pertinent to the target class, and an Equivalent Matrix that unifies refined local and global representations to generate comprehensive saliency maps. Our approach demonstrates superior compatibility, enabling effortless integration into existing residual networks like ResNet and Transformer architectures such as BERT with minimal modifications. Extensive experiments on benchmark datasets in medical imaging and text classification show that MHEX not only improves classification accuracy but also produces highly interpretable and detailed saliency scores.
Figures


Figures from the paper (11 more)


Reference graph
Works this paper leans on
-
[1]
Abnar, S. and Zuidema, W. Quantifying attention flow in transformers. arXiv preprint arXiv:2005.00928,
arXiv 2005
-
[6]
URL http://arxiv.org/abs/1810.04805. Dovonon, G. J.-S., Bronstein, M. M., and Kusner, M. J. Setting the record straight on transformer over- smoothing,
-
[9]
Jiang, P.-T., Zhang, C.-B., Hou, Q., Cheng, M.-M., and Wei, Y
URL https://arxiv.org/abs/ 1902.10186. Jiang, P.-T., Zhang, C.-B., Hou, Q., Cheng, M.-M., and Wei, Y . Layercam: Exploring hierarchical class activa- tion maps for localization. IEEE Transactions on Image Processing, 30:5875–5888,
arXiv 1902
-
[11]
Lee, C.-Y ., Xie, S., Gallagher, P., Zhang, Z., and Tu, Z
URL https: //arxiv.org/abs/1908.08593. Lee, C.-Y ., Xie, S., Gallagher, P., Zhang, Z., and Tu, Z. Deeply-supervised nets,
arXiv 1908
-
[14]
A unified approach to interpreting model pre- dictions
Lundberg, S. A unified approach to interpreting model pre- dictions. arXiv preprint arXiv:1705.07874,
-
[16]
Muhammad, M. B. and Yeasin, M. Eigen-cam: Class activation map using principal components. In 2020 International Joint Conference on Neural Networks (IJCNN), pp. 1–7,
work page 2020
-
[17]
doi: 10.1109/IJCNN48605. 2020.9206626. Park, J. Bam: Bottleneck attention module. arXiv preprint arXiv:1807.06514,
-
[18]
URL https://arxiv.org/ abs/2103.06104. Petsiuk, V . Rise: Randomized input sampling for explanation of black-box models. arXiv preprint arXiv:1806.07421,
Show all 23 references
-
[19]
U-net: Con- volutional networks for biomedical image segmentation
Ronneberger, O., Fischer, P., and Brox, T. U-net: Con- volutional networks for biomedical image segmentation. In Medical image computing and computer-assisted intervention–MICCAI 2015: 18th international confer- ence, Munich, Germany, October 5-9, 2015, proceed- ings, part III...
2015
-
[21]
Graph attention networks.arXiv preprint arXiv:1710.10903,
Veliˇckovi´c, P., Cucurull, G., Casanova, A., Romero, A., Lio, P., and Bengio, Y . Graph attention networks.arXiv preprint arXiv:1710.10903,
-
[22]
Yang, J., Shi, R., and Ni, B
URL https://arxiv.org/abs/2211.03064. Yang, J., Shi, R., and Ni, B. Medmnist classification de- cathlon: A lightweight automl benchmark for medical image analysis. In IEEE 18th International Symposium on Biomedical Imaging (ISBI), pp. 191–195,
-
[23]
The weighting functionf (x) = 5· x 1+256x5 , which max- imizes evaluation when the saliency map covers approximately 25% of the input image area. 11 B.2. Insertion and Deletion Curves For each sample, the saliency score Sj is used to rank pix- els by their importance. The mode...
2018
-
[2014]
Li, R., Wang, X., Huang, G., Yang, W., Zhang, K., Gu, X., Tran, S
URL https:// arxiv.org/abs/1409.5185. Li, R., Wang, X., Huang, G., Yang, W., Zhang, K., Gu, X., Tran, S. N., Garg, S., Alty, J., and Bai, Q. A compre- hensive review on deep supervision: Theories and ap- plications,
-
[2015]
Hu, J., Shen, L., and Sun, G
URL https: //arxiv.org/abs/1512.03385. Hu, J., Shen, L., and Sun, G. Squeeze-and-excitation net- works. In Proceedings of the IEEE conference on com- puter vision and pattern recognition , pp. 7132–7141,
-
[2016]
Therefore, a key consideration is how to introduce residual links within these frameworks to seamlessly in- tegrate MHEX
and Graph Attention Networks (GATs) (Veliˇckovi´c et al., 2017), typically lack residual connec- tions. Therefore, a key consideration is how to introduce residual links within these frameworks to seamlessly in- tegrate MHEX. Additionally, MHEX can also be applied to medical i...
2017
-
[2017]
and Rastegari, M
Mehta, S. and Rastegari, M. Mobilevit: light- weight, general-purpose, and mobile-friendly vision transformer. arXiv preprint arXiv:2110.02178,
-
[2018]
Deng, J., Dong, W., Socher, R., Li, L.-J., Li, K., and Fei-Fei, L
URL https://arxiv.org/ abs/1801.10130. Deng, J., Dong, W., Socher, R., Li, L.-J., Li, K., and Fei-Fei, L. Imagenet: A large-scale hierarchical image database. In 2009 IEEE conference on computer vision and pattern recognition, pp. 248–255. IEEE,
2009 arXiv
-
[2019]
Cohen, T
URL https://arxiv.org/abs/ 1906.04341. Cohen, T. S., Geiger, M., Koehler, J., and Welling, M. Spherical cnns,
1906 arXiv
-
[2020]
Chattopadhay, A., Sarkar, A., Howlader, P., and Balasubra- manian, V . N. Grad-cam++: Generalized gradient-based visual explanations for deep convolutional networks. In 2018 IEEE winter conference on applications of com- puter vision (WACV), pp. 839–847. IEEE,
2018
-
[2021]
Kipf, T. N. and Welling, M. Semi-supervised classifica- tion with graph convolutional networks. arXiv preprint arXiv:1609.02907,
-
[2022]
Liu, Z., Mao, H., Wu, C.-Y ., Feichtenhofer, C., Darrell, T., and Xie, S
URL https://arxiv.org/abs/ 2207.02376. Liu, Z., Mao, H., Wu, C.-Y ., Feichtenhofer, C., Darrell, T., and Xie, S. A convnet for the 2020s. In Proceedings of the IEEE/CVF Conference on Computer Vision and Pat- tern Recognition (CVPR), pp. 11976–11986, June
-
[2023]
T., Dosovitskiy, A., Brox, T., and Ried- miller, M
Springenberg, J. T., Dosovitskiy, A., Brox, T., and Ried- miller, M. Striving for simplicity: The all convolutional net. arXiv preprint arXiv:1412.6806,
-
[2024]
He, K., Zhang, X., Ren, S., and Sun, J
URL https://arxiv.org/ abs/2401.04301. He, K., Zhang, X., Ren, S., and Sun, J. Deep residual learning for image recognition,
Reviewed August 10, 2026 · model on record in the stance chip above.
Discussion (0). Continue with ORCID to comment.