REVIEW 5 major objections 5 minor 22 references
Real-Time Bus Departure Prediction Using Neural Networks for Smart IoT Public Bus Transit
T0 review · 5 major / 5 minor · reviewed 2026-08-10 · deepseek-v4-flash
Pith's one-line read Bus departure times predicted to within 80 seconds across 151 routes
desk verdict A clean FCNN case study for bus departure deviation whose headline RMSE is undercut by random train/test splitting and a missing persistence baseline. read the letter →
The pith
A machine-rendered reading of the paper's core claim, the machinery that carries it, and where it could break.
The reading
What carries the argument
The central mechanism is the FCNN with a one-bus-stop lookback: each training example corresponds to the segment between two consecutive stops of a trip, with 173 input features describing the current stop (deviation from schedule, lateness status, day type, rush hour, stop-to-stop distance, weather one-hots, route and direction one-hots, and coordinates) and a single output neuron giving the predicted departure-time deviation at the next stop. The predicted deviation is added to the scheduled next-stop time to produce an actual departure estimate. This design lets one network serve all 151 routes, captures nonlinear feature interactions, and keeps the model small enough to run on IoT-class hardware.
What would settle it
Train the same model on the first two months of MBTA 2023 data and test on the third month, holding out a contiguous future period, and compare RMSE with the reported 77.8 seconds; if the temporal-split RMSE exceeds roughly 120 seconds or degrades by more than 50 percent, the central real-time prediction claim is not supported.
Extended reading notes
Core claim
On the authors' own terms, the discovery is that a single FCNN with three hidden layers (512, 128, 64 neurons), 173 input features, and a one-bus-stop lookback window predicts the next stop's departure time deviation across the entire MBTA network with 77.83 seconds RMSE on a held-out test set, compared with a 161.44 seconds RMSE for linear regression. The model uses Min-Max scaled features grouped into time, distance, weather, and traffic categories, and is trained with MSE loss and the Adam optimizer. The paper also shows diminishing returns beyond three hidden layers: four- and five-layer variants improve RMSE by less than 1 percent while multiplying parameter count and FLOPs, supporting the choice of a compact architecture suitable for IoT deployment. Reported inference time is 28.7 microseconds per prediction, excluding network latency.
Load-bearing premise
The paper assumes each bus-stop record is independent, so randomly splitting the data into training and test sets does not let information from the same trip, route, or day leak between the two; if that assumption fails, the reported 77.8-second RMSE overstates how well the model predicts future, unseen departures.
Editorial extensions
If this is right
- A single citywide model, rather than per-route models, can provide next-stop departure predictions with under-80-second RMSE for every route in the network.
- Because the model needs only the current stop's deviation plus static features, it can be updated in real time as each bus reaches a stop, supporting countdown displays and mobile apps.
- The compact 163K-parameter architecture makes edge deployment feasible: per-request inference takes about 28.7 microseconds, excluding communication latency.
- Replacing a linear regression baseline (RMSE 161.4s) with the FCNN more than halves prediction error, indicating that nonlinear feature interactions carry much of the signal.
Reading between the lines
- The random 70/20/10 split likely overstates real-world accuracy, because trips from the same route, day, or vehicle can appear in both training and test sets; a temporal split would give a fairer estimate for truly future departures.
- Since the model predicts only one stop ahead, errors accumulate over a multi-stop trip; a route with 14 stops could see several times the per-stop RMSE by journey's end.
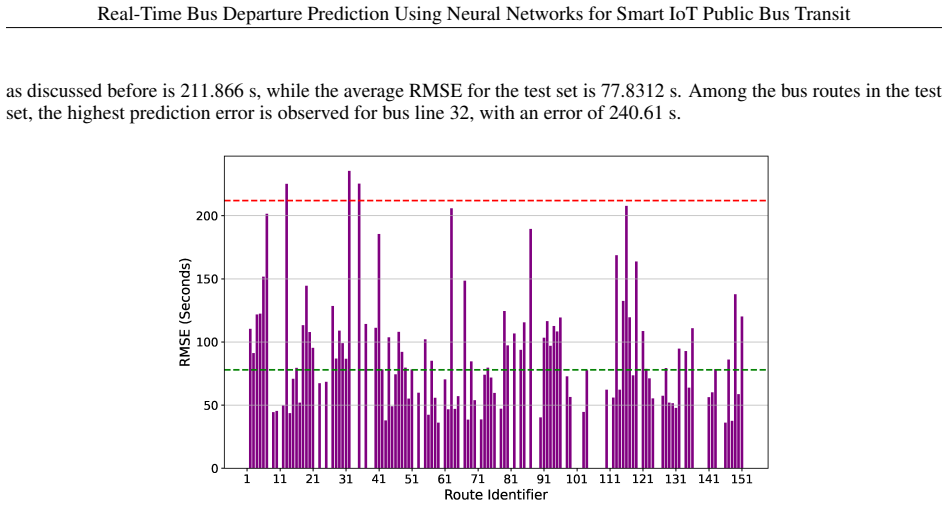
- High-error route 32 (RMSE 240.6s) suggests stop-level features such as passenger dwell time are missing; adding automated passenger counters could be a direct test of that hypothesis.
- The same pipeline should transfer to other GTFS-compliant transit agencies, but the weather, rush-hour, and stop-spacing thresholds would need recalibration from local data.
Signed reviews
Editorial analysis
A structured set of objections, weighed in public.
Referee Report
Summary. The paper develops a fully connected neural network (FCNN) that predicts the departure time deviation at the next bus stop for MBTA buses, using a one-stop lookback of the current-stop deviation together with time, distance, weather, and route features. The dataset integrates three public sources: MBTA 2023 departure records (restricted to the first quarter), Visual Crossing weather data, and MBTA stop geodata. After cleaning and outlier removal, trips are segmented into consecutive stop pairs, and the model is trained with MSE loss. An architecture search over one to five hidden layers selects a three-layer model (512, 128, 64 neurons) with test RMSE 77.83 s and MAE 55.63 s, compared against a linear regression with RMSE 161.44 s. The paper also reports per-route RMSE, MAPE with a discussion of its limitations, and a model-level inference time of 28.7 microseconds.
Significance. If the reported evaluation were sound, the paper would be a useful applied contribution: it addresses a practical real-time prediction task on a large public dataset, provides a compact model suitable for IoT-style deployment, and includes a sensible feature engineering pipeline and an architecture ablation. The strengths are the concrete, reproducible data source, the clear single-output regression setup, the explicit treatment of computational complexity (FLOPs/parameters) for IoT constraints, and the honest discussion of MAPE's interpretability problems. However, the central claim—"significant improvement," predicting deviations to under 80 seconds (abstract and Section 6)—is an evaluation claim, and the current evaluation protocol does not establish it. The reported accuracy is best interpreted as interpolation accuracy on a random sample of segments rather than as a measure of real-time predictive generalization to future, unseen departures.
major comments (5)
- [Section 5.3] The evaluation uses a random 70/20/10 split of the row-level preprocessed data. After the segmentation in Section 4.2, each Half-Trip ID produces multiple consecutive stop-pair examples that share route, vehicle, date, weather, and nearby stop context. A random split can therefore place examples from the same trip in both training and testing. Since the input includes the current-stop departure deviation, test examples become near-duplicates of training examples rather than unseen future departures. This does not measure the real-time generalization claimed in the abstract and conclusion. Please re-evaluate with a temporal holdout (e.g., train on January-February, validate and test on March) or at least a grouped split by Half-Trip ID and by Service Date, and report the resulting RMSE/MAE.
- [Section 5.3] No persistence or trivial baseline is reported. Because the current-stop departure deviation is a key input and the target is the next-stop deviation, the natural baseline "predict the next deviation equals the current deviation" is likely very strong for this task. The paper compares only against linear regression (RMSE 161.44 s). Without the persistence baseline, the claim that the FCNN achieves a "significant improvement" is unsupported even under a leak-free split. Please add this baseline, ideally alongside route-level and time-of-day stratified results.
- [Section 5.1 and Table 2] The architecture is selected using the test RMSE: Table 2 reports test RMSE for every candidate architecture and the three-layer model is chosen because it balances accuracy and complexity. This makes the reported 77.83 s test RMSE an optimistically biased estimate of the selected model's error. Please separate model selection from evaluation—for example, use the validation split for architecture choice and report test error only for the final model—or use nested cross-validation.
- [Section 4.1] The outlier removal with k=2 in Equations (1)-(2) discards 406,969 points (about 6.4% of the data), including many long delays that are precisely the events a real-time prediction system must handle. The thresholds are computed on the full dataset before any train/test separation, so information from the test period influences the preprocessing. Please justify the choice of k, examine sensitivity to k, and ensure that outlier detection is fit only on the training portion in any temporal evaluation.
- [Sections 5.2 and 5.3] No error bars, repeated runs, or statistical significance tests are reported. The differences among some architectures in Table 2 are very small (e.g., 76.8411 vs. 76.8323 seconds for four- and five-layer models), and without multiple seeds or confidence intervals it is unclear whether these differences are meaningful. Please report mean and standard deviation over several random seeds, or at least state whether the reported numbers are from a single run.
minor comments (5)
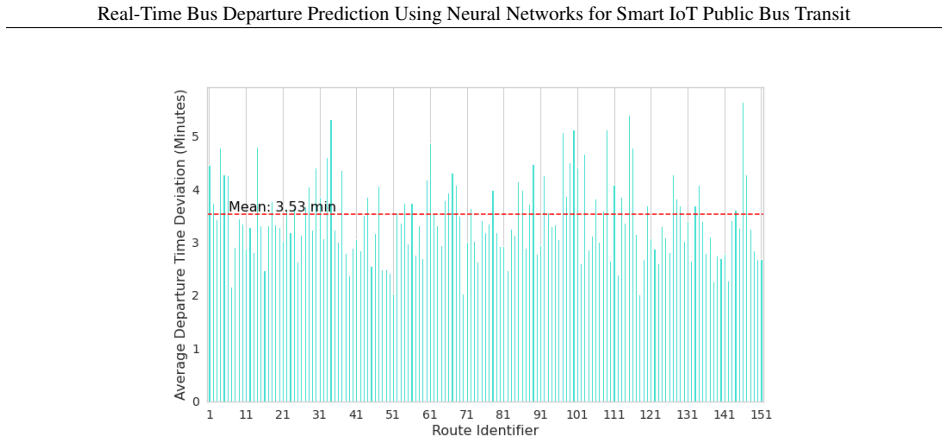
- [Abstract and Section 4.1] The abstract and conclusion say the average deviation is "nearly 4 minutes," but the preprocessed dataset mean is 211.866 s (3 min 31 s); the original dataset mean is 261.84 s (4 min 22 s). The text should disambiguate which dataset the average refers to.
- [Section 4.2] The description of "current stop lateness status" is ambiguous: the bullet says it is derived from the "status of the previous stop" but then says it is determined by whether the deviation at the current stop is positive or negative. Please clarify which stop is used.
- [Equation (4)] The RMSE equation uses i as both the sample index and the stop index; the indexing of m and the summation over samples should be distinguished from the stop index i in Section 4.2.
- [Section 5.3] The reported inference time of 28.7 microseconds omits the hardware and software stack; without specifying the device (the experiments otherwise use Tesla V100 GPUs), this number does not support the IoT-deployment claim. Please state the benchmarking environment.
- [References] Several citations are incomplete or malformed (e.g., "axi," "apt," "str," "tsg," and the Visual Crossing URL), and the reference "Sto" is used for both a dataset and a definition of rush hour. Please clean up the reference list and unify citation keys.
Circularity Check
No significant circularity: the next-stop deviation target is distinct from the current-stop input features, and no load-bearing derivation reduces to a fitted parameter or self-citation.
full rationale
The paper's derivation chain is self-contained. The target variable is the next-stop departure time deviation, ddep(n,i+1), computed as the difference between actual and scheduled departure times at the next stop, and is recovered from the predicted deviation via tpred(n,i+1) = tsched(n,i+1) + ddep(n,i+1) (Eq. 3). The model inputs include the observed current-stop deviation and features derived from it, but the target is not defined in terms of the network weights, the current-stop deviation, or any fitted parameter, so the self-definitional and fitted-input-called-prediction patterns do not apply. The architecture ablation selects among FCNN sizes using test RMSE, but this is model selection on a fixed dataset and does not make the reported test error equal to a training objective by construction; RMSE is computed independently on the test portion via Eq. 4. Citations to the authors' prior FCNN work (Rashvand et al. 2024a) are motivational and descriptive, not load-bearing premises or uniqueness constraints. A separate validity concern is that the 70/20/10 random row split may leak same-trip information because each Half-Trip ID yields multiple segment-level examples, which could inflate generalization estimates; however, that is an experimental protocol issue, not circularity. The test target remains a distinct quantity from the training inputs, and no equation forces the predicted value to equal the fitted input. Therefore no circular step is exhibited.
Assumptions & free parameters
free parameters (3)
- Outlier detection constant k =
2
- Optimal hidden layer sizes for selected FCNN =
512, 128, 64
- Distance threshold for 'far status' feature =
1488 meters
assumptions (4)
- domain assumption Actual Time labels in the MBTA departure dataset are accurate and complete.
- domain assumption Randomly splitting trip records into 70/20/10 yields independent training and test sets.
- domain assumption Next-stop departure deviation depends only on current-stop features (one-stop lookback Markov property).
- domain assumption Weather data matched by date and city represent the conditions each bus experienced.
Cite this review
Pith. "Pith review of Real-Time Bus Departure Prediction Using Neural Networks for Smart IoT Public Bus Transit." pith.science (2026). https://pith.science/paper/WL4IH6EJ
@misc{pith2026250110514,
  author       = {Pith},
  title        = {Pith review of: Real-Time Bus Departure Prediction Using Neural Networks for Smart IoT Public Bus Transit},
  year         = {2026},
  howpublished = {\url{https://pith.science/paper/WL4IH6EJ}},
  note         = {Machine review of arXiv:2501.10514}
}
read the original abstract
Bus transit plays a vital role in urban public transportation but often struggles to provide accurate and reliable departure times. This leads to delays, passenger dissatisfaction, and decreased ridership, particularly in transit-dependent areas. A major challenge lies in the discrepancy between actual and scheduled bus departure times, which disrupts timetables and impacts overall operational efficiency. To address these challenges, this paper presents a neural network-based approach for real-time bus departure time prediction tailored for smart IoT public transit applications. We leverage AI-driven models to enhance the accuracy of bus schedules by preprocessing data, engineering relevant features, and implementing a fully connected neural network that utilizes historical departure data to predict departure times at subsequent stops. In our case study analyzing bus data from Boston, we observed an average deviation of nearly 4 minutes from scheduled times. However, our model, evaluated across 151 bus routes, demonstrates a significant improvement, predicting departure time deviations with an accuracy of under 80 seconds. This advancement not only improves the reliability of bus transit schedules but also plays a crucial role in enabling smart bus systems and IoT applications within public transit networks. By providing more accurate real-time predictions, our approach can facilitate the integration of IoT devices, such as smart bus stops and passenger information systems, that rely on precise data for optimal performance.
Figures


Figures from the paper (7 more)




Reference graph
Works this paper leans on
-
[4]
doi:10.1016/J.TRA.2022.04.006. Alltransit. https://alltransit.cnt.org/. Accessed: April
-
[5]
doi:10.1016/J.RETREC.2020.100870. Ehab I. Diab, Madhav G. Badami, and Ahmed M. El-Geneidy. Bus transit service reliability and improvement strategies: Integrating the perspectives of passengers and transit agencies in north america. Transport Reviews, 35(3):292– 328,
arXiv 2020
-
[8]
Shengping Bi, Jianyong Hu, Lingyun Shao, Tong Feng, and Andrea Appolloni
doi:10.1016/J.IJTST.2021.11.003. Shengping Bi, Jianyong Hu, Lingyun Shao, Tong Feng, and Andrea Appolloni. Can public transportation development improve urban air quality? evidence from china. Urban Climate , 54:101825, Mar
-
[13]
Mbta struggles to recover ridership post-pandemic - Axios Boston
doi:10.21203/rs.3.rs-4844614/v1. Mbta struggles to recover ridership post-pandemic - Axios Boston. https://www.axios.com/local/boston/ 2023/12/18/transit-ridership-mbta-pandemic-recovery . Accessed: Aug. 03,
-
[14]
Mbta slow to bring riders back post-pandemic – nbc boston. https://www.nbcboston.com/news/local/ mbta-trails-other-major-transit-agencies-in-bringing-back-riders-data-shows/3013493/ . Accessed: Aug. 03,
-
[16]
Available at: https://arxiv.org/abs/2304.06467. Sanchita Basak, Fangzhou Sun, Saptarshi Sengupta, and Abhishek Dubey. Data-driven optimization of public transit schedule. In Big Data Analytics: 7th International Conference, BDA 2019, Ahmedabad, India, December 17–20, 2019, Proceedings 7, pages 265–284. Springer,
work page Pith review arXiv 2019
-
[18]
doi:10.22266/IJIES2020.0229.29. Asad Abdi and Chintan Amrit. A review of travel and arrival-time prediction methods on road networks: classification, challenges and opportunities. PeerJ Computer Science, 7:e689,
-
[20]
Faruk Serin, Yigit Alisan, and Metin Erturkler
doi:10.1109/MT-ITS49943.2021.9529328. Faruk Serin, Yigit Alisan, and Metin Erturkler. Predicting bus travel time using machine learning methods with three-layer architecture. Measurement, 198:111403, Jul
arXiv 2021
Show all 22 references
-
[21]
Arastoo Zibaeirad, Farnoosh Koleini, Shengping Bi, Tao Hou, and Tao Wang
doi:10.1016/J.MEASUREMENT.2022.111403. Arastoo Zibaeirad, Farnoosh Koleini, Shengping Bi, Tao Hou, and Tao Wang. A comprehensive survey on the security of smart grid: Challenges, mitigations, and future research opportunities. arXiv preprint arXiv:2407.07966,
2022
-
[22]
Enhancing automatic modulation recognition for iot applications using transformers
Narges Rashvand, Kenneth Witham, Gabriel Maldonado, Vinit Katariya, Nishanth Marer Prabhu, Gunar Schirner, and Hamed Tabkhi. Enhancing automatic modulation recognition for iot applications using transformers. IoT, 5(2): 212–226, 2024b. Cong Bai, Zhong-Ren Peng, Qing-Chang Lu, ...
2015
- [23]
-
[2013]
URL https://digitalcommons.usf.edu/jpt/ vol16/iss3/2
doi:10.5038/2375-0901.16.3.2. URL https://digitalcommons.usf.edu/jpt/ vol16/iss3/2. 13 Real-Time Bus Departure Prediction Using Neural Networks for Smart IoT Public Bus Transit Masoud Fadaei Oshyani and Oded Cats. Real-time bus departure time predictions: Vehicle trajectory an...
-
[2014]
Sanaz Sadat Hosseini, Babak Rahimi Ardabili, Mona Azarbayjani, and Hamed Tabkhi
doi:10.1109/ITSC.2014.6958099. Sanaz Sadat Hosseini, Babak Rahimi Ardabili, Mona Azarbayjani, and Hamed Tabkhi. Demographic disparities, service efficiency, safety, and user satisfaction in public bus transit system: A survey-based case study in the city of charlotte, nc. Rese...
2014
-
[2015]
URL https://www.tandfonline.com/doi/abs/10.1080/ 01441647.2015.1005034
doi:10.1080/01441647.2015.1005034. URL https://www.tandfonline.com/doi/abs/10.1080/ 01441647.2015.1005034. The real reason buses were losing riders even before covid-19 — streetsblog usa. https://usa.streetsblog.org/ 2020/08/26/the-real-reason-buses-were-losing-riders-even-bef...
2015
-
[2017]
Ankit Taparia and Mike Brady
doi:10.1016/J.TRPRO.2017.05.381. Ankit Taparia and Mike Brady. Bus journey and arrival time prediction based on archived avl/gps data using machine learning. In 2021 7th International Conference on Models and Technologies for Intelligent Transportation Systems (MT-ITS), pages 1–6,
2017 doi
-
[2018]
URL https://journals.sagepub.com/doi/abs/10.1111/cico.12278
doi:10.1111/CICO.12278. URL https://journals.sagepub.com/doi/abs/10.1111/cico.12278. Youngjin Lee and Bumsoo Lee. What’s eating public transit in the united states? reasons for declining tran- sit ridership in the 2010s. Transportation Research Part A: Policy and Practice , 15...
-
[2019]
Jalaney Jabamony and Ganesh Ramaswamy Shanmugavel
doi:10.1007/978-3-030-37188-3_16. Jalaney Jabamony and Ganesh Ramaswamy Shanmugavel. Iot based bus arrival time prediction using artificial neural network (ann) for smart public transport system (spts). International Journal of Intelligent Engineering and Systems , 13(1):312–323, Feb
-
[2020]
URL https: //digitalcommons.usf.edu/jpt/vol22/iss1/1
doi:10.5038/2375-0901.22.1.1. URL https: //digitalcommons.usf.edu/jpt/vol22/iss1/1. Narges Rashvand, Sanaz Sadat Hosseini, Mona Azarbayjani, and Hamed Tabkhi. Real-time bus arrival prediction: A deep learning approach for enhanced urban mobility. In 13th International Conferen...
-
[2021]
URL https://www.ncbi.nlm.nih.gov/pmc/articles/PMC8251298/
doi:10.1111/JORS.12527. URL https://www.ncbi.nlm.nih.gov/pmc/articles/PMC8251298/. Kenneth L. Covington. Overcoming spatial mismatch: The opportunities and limits of transit mode in addressing the black–white unemployment gap. City & Community , 17(1):211–235,
-
[2022]
Gregory D
doi:10.1016/J.TRA.2022.01.002. Gregory D. Erhardt, Jawad M. Hoque, Vaneet Goyal, Simon Berrebi, Candace Brakewood, and Kari E. Watkins. Why has public transit ridership declined in the united states? Transportation Research Part A: Policy and Practice, 161: 68–87, Jul
2022 doi
-
[2023]
Ridership report - american public transportation association
doi:10.1016/J.JPUBTR.2023.100046. Ridership report - american public transportation association. https://www.apta.com/ research-technical-resources/transit-statistics/ridership-report/ . Accessed: Sep. 17,
2023
-
[2024]
Alejandro Tirachini and Oded Cats
doi:10.1016/J.UCLIM.2024.101825. Alejandro Tirachini and Oded Cats. Covid-19 and public transportation: Current assessment, prospects, and re- search needs. Journal of Public Transportation , 22(1):1,
2024
Reviewed August 10, 2026 · model on record in the stance chip above.
Discussion (0). Continue with ORCID to comment.