REVIEW 3 major objections 6 minor 38 references
Solar irradiance statistical analysis in Mexico City from 2018 to 2021
T0 review · 3 major / 6 minor · reviewed 2026-08-10 · deepseek-v4-flash
Pith's one-line read By analyzing four years of hourly UVA readings from eleven Mexico City monitoring stations, this paper concludes that solar irradiance did not vary from 2018 to 2021.
desk verdict A straightforward descriptive analysis of Mexico City UVA data with a plausible no-change result, but the zero-dropping rule and uneven coverage need a sensitivity test before the conclusion is secure. read the letter →
The pith
A machine-rendered reading of the paper's core claim, the machinery that carries it, and where it could break.
The reading
What carries the argument
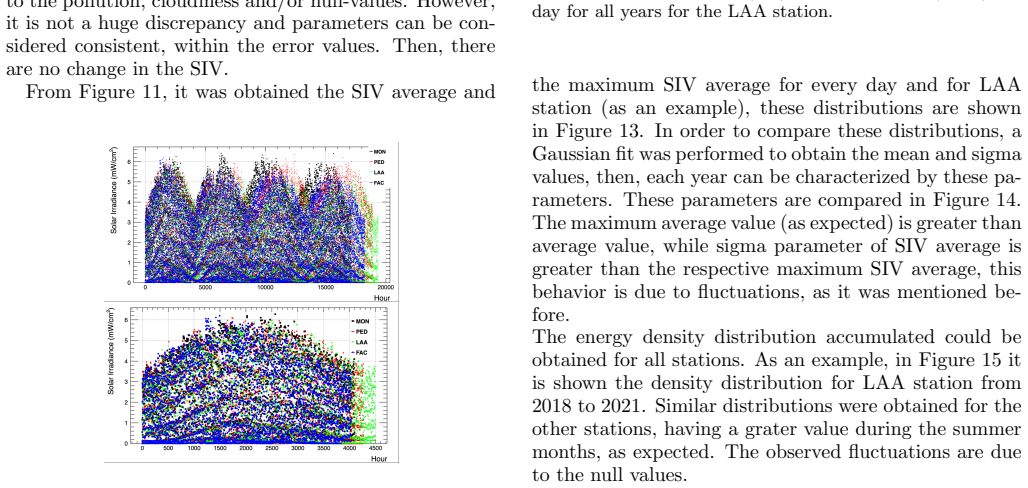
The central object is the one-hour SIV distribution at each station, built after omitting every zero reading. The paper splits each histogram into a falling exponential part, whose slope parameter characterizes the most probable value, and an upper Gaussian part, whose mean and $\sigma$ characterize the maximum-value range; monthly and yearly comparisons are carried by these fitted parameters. The no-change argument also leans on energy integrals (J/cm$^{2}$) obtained from SIV-versus-hour curves and on linear-fit slopes of daily ratios of 2018, 2019, and 2020 values relative to 2021, which are found consistent with zero.
What would settle it
Recompute the annual averages, maxima, most probable values, and energy integrals with a consistent treatment of zeros and missing hours—for instance, including zeros only during daytime hours or weighting each day by the number of recorded hours—and compare the four years. If the July 2018 LAA month, which has only 13 recorded days, is completed from neighboring-year climatology, or if missing hours are found to correlate with cloudiness or station outages, the quoted ranges and zero slopes may shift enough to change the conclusion.
Extended reading notes
Core claim
For hourly UVA surface irradiance (mW/cm$^{2}$) at the eleven stations considered, the paper argues that every descriptor used—annual averages in the range (1.7, 2.3) mW/cm$^{2}$, annual maxima in (5.40, 6.42) mW/cm$^{2}$, a most probable value stable to within 0.0010 mW/cm$^{2}$, monthly mean and maximum distributions, the $\sigma$ and mean of Gaussian fits to the upper part of each distribution, and the slopes of daily ratio fits relative to 2021—is consistent within statistical errors across 2018-2021. The only systematic variation is the expected seasonal behavior, with irradiance and accumulated energy peaking in the summer months. From this the paper concludes that solar irradiance did not change over the study period and that the result agrees with previous studies in other parts of the world.
Load-bearing premise
The conclusion that irradiance stayed constant assumes that removing all zero readings does not bias the yearly, monthly, and daily comparisons; if zero or missing hours are more common in some years, months, or stations, the apparent stability could be an artifact of which hours were recorded.
Editorial extensions
If this is right
- If the conclusion is correct, UVA surface irradiance in Mexico City had no four-year trend, so any observed increase in population UV exposure or skin-damage reports in that window would need an explanation other than increasing irradiance.
- The quoted ranges for average and maximum irradiance become a baseline for future years, letting a quick check detect any shift due to ozone recovery, aerosol changes, or urban development.
- The expected summer peak dominates the seasonal signal, so future analyses of irradiance trends must account for season and for data completeness before attributing changes to climate or pollution.
- The result adds a local measurement point to the broader picture that solar irradiance has not shown an upward tendency in recent decades, useful for solar-energy planning and public-health UV alert thresholds.
Reading between the lines
- If missing hours are not randomly distributed—the paper itself notes LAA took data on only 13 days in July 2018—dropping all non-zero values could hide a real year-to-year shift; a sensitivity analysis that imputes or weights by data coverage would test this.
- The two-piece exponential-plus-Gaussian fit describes a bounded, asymmetric histogram; comparing years with a single parametric family or with quantile-based measures might make the no-change claim testable at finer resolution.
- Four years is shorter than the 11-year solar cycle and the timescales of ozone-layer recovery, so extending this method to earlier or later years from the same city data set would show whether the flat conclusion persists.
Editorial analysis
A structured set of objections, weighed in public.
Referee Report
Summary. This manuscript reports a statistical analysis of hourly ultraviolet-A (UVA) solar irradiance values (SIV, in mW/cm²) from eleven SEDEMA meteorological stations in Mexico City and the metropolitan area over 2018–2021. After omitting all zero readings, the authors construct annual, monthly, and daily SIV histograms and report averages, maxima, most probable values (MPV), and energy integrals; they further characterize distributions with an exponential fit to the first part and a Gaussian fit to the last part, and they compare daily maximum and average values across years through ratios of 2018/2019/2020 values to 2021 values with linear fits. On the basis of the year-to-year consistency of these quantities—fit parameters consistent within errors and daily ratio slopes reported as consistent with zero—the paper concludes in Section IV that the SIV 'have remained constant over the period 2018-2021 in CDMX.' The work is a purely descriptive empirical study; it introduces no new methodology and reports no formal hypothesis tests.
Significance. If correct, the no-change conclusion would provide a useful observational baseline for surface UVA irradiance in Mexico City, a region of high skin-cancer incidence where aerosols and pollution are known to modulate surface radiation. The paper has real strengths: it uses a fully public dataset (SEDEMA), covers all eleven stations across four years at hourly resolution, and includes a sensible stability check in the daily ratio-slope comparison of Figures 16–17, with slopes reported as consistent with zero—an ordinary empirical design with no circularity. However, the significance is currently limited: all results depend on a blanket exclusion of zero readings whose missingness structure is never quantified, the headline ranges and MPV claims lack error bars and formal tests, and the reported fit parameters cannot be reproduced without the fit ranges and binning. The evidence, as presented, supports a preliminary observation of stability rather than the strong claim that constancy 'has been shown.'
major comments (3)
- [Section III, first paragraph; Figures 3, 5, 10] The blanket exclusion of all zero SIV values ('All SIV equal to zero were omitted for this analysis') removes not only night-time hours but also daytime null/missing readings, so every annual, monthly, and daily statistic is computed on a coverage-dependent subset of hours. The paper itself attributes observed drops in energy integrals and maxima to null values—for example, LAA took data on only 13 days in July 2018 (Section III B)—yet it never quantifies the missingness pattern or demonstrates that it is stable across the years being compared. The annual maximum, in particular, is the maximum over the observed non-zero hours, so a year with more missing high-irradiance afternoon hours will show a lower maximum even if the underlying irradiance is unchanged; the same coverage bias affects daily means and monthly energy totals. Because the central conclusion that SIV 'have remained constant' (Section IV) is an inference from the observed non-zero samples to the underlying irradiance, the authors need a completeness-matched sensitivity test—for example, restricting all years to a common set of daytime hours, or normalizing energy integrals by the number of recorded hours—before the no-change claim can be supported.
- [Section IV; Figures 3, 4, 17] The headline numerical claims are presented without uncertainty quantification: the annual maximum range (5.40–6.42) mW/cm² and average range (1.7–2.3) mW/cm² are cross-station/cross-year ranges with no error bars; the MPV is said to vary by only 0.0010 mW/cm² with no statement of how that precision is obtained; and the daily slope parameters of Figure 17 are described only qualitatively as 'consistent with zero.' A spread of roughly 19% in annual maxima and 15% in annual averages is not by itself evidence of constancy. To substantiate the claim that it 'has been shown' that SIV remained constant, the authors should report the numerical values of the fitted daily slopes with their confidence intervals and add at least one formal trend test (e.g., linear regression of annual or monthly mean SIV with p-values, or a Mann–Kendall test on the daily series). Without these, the strength of the conclusion exceeds what the presented statistics establish.
- [Section III B; Figures 6, 8, 9] The exponential and Gaussian fits that support the monthly no-change claim are not reproducible as reported: the fitting ranges for the 'first part' (exponential) and 'last part' (Gaussian) of each histogram are never defined, no binning or fitting routine is described, and no criterion is given for when a month's statistics are too few to yield a reliable fit (the paper only says that large error bars arise from months with 'a few statistics'). Because the parameter-consistency comparison in Figures 8 and 9 is the quantitative backbone of the monthly conclusion, the fit ranges and minimum-sample criteria must be stated explicitly; otherwise the apparent stability across years cannot be distinguished from an artifact of the chosen fit windows.
minor comments (6)
- [Throughout] The manuscript contains numerous typographical and grammatical errors, including 'can be can be also damaging' (Abstract), 'tacking' for 'taking' (Section II), 'grater' for 'greater' (Section III C), '20118' for '2018' (Section IV), 'dow' for 'down' (Figure 17 caption), 'F AAC' for 'FAC' (Figure 10 caption), 'Mont Real' for 'Montreal' (Introduction), and 'ditribution' (Figure 4 caption). A thorough language edit is needed.
- [References [16] and [26–29]] Reference [16] ('Arulsamy A. Homo Enthiran, 2018') is a film credit, not a source on the length of the solar cycle, and should be replaced. The concluding claim that the results agree with 'previously studies in various part of the world [26–29]' is not supported by the cited works: [26] and [27] concern modeling of solar-irradiance variability and spectra, while [28] and [29] concern PV irrigation and building energy forecasting; none of them reports constancy of surface UVA irradiance over the study period. Please cite dedicated surface-UV trend studies or soften the claim.
- [Section IV] The daily maximum and average SIV series for LAA is said to be shown 'in Figure 12,' but Figure 12 displays the Gaussian mean and sigma parameters of the Figure 11 distributions; the correct figure for the daily maximum/average series is Figure 13. Please correct the cross-reference.
- [Section III A; Figure 4] The histogram bin width is never stated, although the MPV, the exponential slope, and the Gaussian parameters all depend on it; the claim that the MPV varies by only 0.0010 mW/cm² across stations and years needs the binning and the definition of the MPV to be specified.
- [Introduction] The ultraviolet index (IUV) and its WHO categories are discussed at length but the IUV is never used in the analysis; the abstract mixes SI units (W/m²) with the data units (mW/cm²) without comment. Please either connect the IUV discussion to the SIV analysis or shorten it, and state the data units consistently.
- [Section II] The measurement protocol is described only as an 'actinograph elaborated by OTA KEIKE SEISAKUSHO'; a model number, calibration information, or a reference to the instrument manual would improve the reproducibility of the analysis.
Circularity Check
No significant circularity: the paper reports direct empirical statistics and compares them across years; no claim reduces to its inputs by definition.
full rationale
The manuscript is an observational statistical description of SEDEMA solar irradiance data. The central claim that 'the SIV have remained constant over the period 2018-2021' is supported by direct summary statistics (averages, maxima, MPV, energy integrals) and by comparisons of fitted Gaussian and exponential parameters across years. None of these quantities is defined in terms of the conclusion; rather, each is computed from the measured SIV values and then compared across time. The paper does not fit a parameter to a subset and then predict the same subset, nor does it invoke a self-citation or uniqueness theorem to force its interpretation. The most notable methodological concern is the statement that 'All SIV equal to zero were omitted for this analysis,' which may bias annual comparisons if missing-data patterns differ across years or stations; however, that is a data-quality and inference issue, not circular reasoning. The paper is self-contained against the open SEDEMA dataset and its conclusions are ordinary empirical descriptions, so no circular step can be identified.
Assumptions & free parameters
free parameters (3)
- Exponential fit range =
not stated
- Gaussian fit range =
not stated
- Null-value exclusion rule =
SIV = 0 omitted
assumptions (3)
- domain assumption Zero and missing SIV values can be discarded without biasing annual, monthly, or daily comparisons.
- domain assumption The 11 selected SEDEMA stations are accurate, calibrated, and representative of Mexico City solar irradiance.
- standard math Gaussian, exponential, and linear least-squares fits are adequate characterizations of the SIV distributions and their comparisons.
Cite this review
Pith. "Pith review of Solar irradiance statistical analysis in Mexico City from 2018 to 2021." pith.science (2026). https://pith.science/paper/CV6OIFKA
@misc{pith2026250113934,
  author       = {Pith},
  title        = {Pith review of: Solar irradiance statistical analysis in Mexico City from 2018 to 2021},
  year         = {2026},
  howpublished = {\url{https://pith.science/paper/CV6OIFKA}},
  note         = {Machine review of arXiv:2501.13934}
}
abstract
Solar radiation is made up of three components of electromagnetic waves: infrared, visible and ultraviolet. The infrared component is the cause of thermal energy, the visible spectrum allows to see through the eyes and the ultraviolet component is the most energetic and damaging. Solar radiation has several benefits, such as helping to synthesize vitamin D in the skin, favors blood circulation, among others benefits for the human body. In the Earth, it is the main source of energy for agriculture, also used as an alternative source of energy to hydrocarbons, through solar cells. The solar irradiance represents the surface power density with units W/m$^2$ in SI. Too much exposure can cause damage and an increase in value over the time can be can be also damaging. In this work it was used an open data base provided by Secretar\'ia del Medio Ambiente, from which a statistical analysis was performed of the solar irradiance values measured at various meteorological stations in Mexico City and the so-called metropolitan area, from 2018 to 2021. This analysis was carried out per years, months and days. From the solar irradiance values distributions, it was obtained the averages, maximums and means were it was found there was no variation in the solar irradiance values over this period of years.
Figures


Figures from the paper (8 more)




Reference graph
Works this paper leans on
-
[16]
Ozone de- pletion and climate change: impacts on UV radiation
Bais AF, McKenzie RL, Bernhard G, et al. Ozone de- pletion and climate change: impacts on UV radiation. Photochem. Photobiol. Sci. 1 2015;14:19–52
work page 2015
-
[1]
• Infrared type B (IRB), in a range of 1400- 3000 nm
Infrared radiation (IR): It is the cause of the ther- mal energy, which is classified by • Infrared type A (IRA), in a range of 780- 1400 nm. • Infrared type B (IRB), in a range of 1400- 3000 nm. • Infrared type C (IRC), in a range of 1 mm to 3000 nm
-
[2]
It is in a range of 400-780 nm
Visible radiation (Vi): It is the part of the electro- magnetic spectrum through the human eye sees. It is in a range of 400-780 nm
-
[3]
Solar irradiance statistical analysis in Mexico City from 2018 to 2021
Ultraviolet radiation (UV): It is the most energetic part of the radiation. Similar to IR, the UV is classified by: • UV type A (UV A), in a range of 315-400 nm. • UV type B (UVB), in a range of 280-315 nm. • UV type C (UVC), in a range of 100-280 nm. UVC rays are the most energetic, which makes them the most dangerous for humanity. However, they are ∗ Co...
work page Pith review arXiv 2025
-
[4]
Radiation: The ultraviolet (UV) index
Organization WH. Radiation: The ultraviolet (UV) index. Accessed on Month Day, Year. 2004. https: //www.who.int/news-room/questions-and-answers/ item/radiation-the-ultraviolet-(uv)-index
work page 2004
-
[5]
Effects Of Solar Radiation On The Skin
Buzzell RA. Effects Of Solar Radiation On The Skin. Otolaryngologic Clinics of North America 1993;26:1–11
work page 1993
-
[6]
Effects of solar radiation and an update on photoprotection
Garnacho Saucedo GM, Salido Vallejo R, and Moreno Gim´enez JC. Effects of solar radiation and an update on photoprotection. Anales de Pediatr ´ıa (English Edition) 2020;92:377.e1– 377.e9
work page 2020
-
[7]
Chapter 22 - Effects of solar radiation on detoxifi- cation mechanisms in the skin
Katiyar SK, Afaq F, and Mukhtar H. Chapter 22 - Effects of solar radiation on detoxifi- cation mechanisms in the skin. In: Sun Protection in Man. Ed. by Giacomoni PU. Vol. 3. Comprehensive Series in Photosciences. Elsevier, 2001:419–36
work page 2001
Show all 38 references
-
[8]
The effects of exposure to solar radiation on human health
RE N, SN LRB, L H, et al. The effects of exposure to solar radiation on human health. Photochem Photobiol Sci 2023;5:1011–47
2023
-
[9]
UV radiation and the skin
J D, S J, A AO, and T S. UV radiation and the skin. Int J Mol Sci 2013;6
2013
-
[10]
Various biological effects of solar radiation on skin and their mechanisms: impli- cations for pho- totherapy
Shin DW. Various biological effects of solar radiation on skin and their mechanisms: impli- cations for pho- totherapy. Animal Cells and Systems 2020;24. PMID: 33029294:181–8
2020
-
[11]
The UV index: definition, distribution and factors affecting it
Fioletov VE, Kerr JB, and Fergusson A. The UV index: definition, distribution and factors affecting it. Canadian journal of public health = Revue canadienne de sante publique 2010;101 4:I5–9
2010
-
[12]
The Montreal Proto- col: triumph by treaty
programme U enviroment. The Montreal Proto- col: triumph by treaty. Accessed on Month Day, Year. 2017. url: https://www.unep.org/news- and- stories/story/montreal- protocol-triumph-treaty
2017
-
[13]
Strato- spheric ozone, UV radiation, and climate interactions
Bais AF, McKenzie RL, Bernhard G, et al. Strato- spheric ozone, UV radiation, and climate interactions. Photochem. Photobiol. Sci. 1 2023;22:937–89
2023
-
[14]
UV impacts avoided by the Montreal Protocol
Newman PA and McKenzie R. UV impacts avoided by the Montreal Protocol. Photochem. Photobiol. Sci. 7 2011;10:1152–60
2011
-
[15]
Projected changes in erythe- mal and vitamin D effective irradi- ance over northern- hemisphere high latitudes
Fountoulakis I and Bais AF. Projected changes in erythe- mal and vitamin D effective irradi- ance over northern- hemisphere high latitudes. Photochem. Photobiol. Sci. 7 2015;14:1251– 64
2015
-
[17]
The solar dynamo
Ossendrijver M. The solar dynamo. Astronomy and As- trophysics Review 2003;11:287–367
2003
-
[18]
Predicting Solar cycle 25 using an optimized long short- term memory model based on sunspot area data
Zhu H, Chen H, Zhu W, and He M. Predicting Solar cycle 25 using an optimized long short- term memory model based on sunspot area data. Advances in Space Research 2023;71:3521– 31
2023
-
[19]
Homo Enthiran
Arulsamy A. Homo Enthiran. 2018
2018
-
[20]
Analysis of 40 years of solar radiation data from China, 1961-2000
CHE H, Shi G, Zhang X, et al. Analysis of 40 years of solar radiation data from China, 1961-2000. Geophysical Research Letters 2005;32
1961
-
[21]
An early prediction of the max- imum amplitude of the solar cycle 25
Helal HR and Galal A. An early prediction of the max- imum amplitude of the solar cycle 25. Journal of Ad- vanced Research 2013;4. Special Issue on ”Heliospheric Physics during and after a deep solar minimum”:275–8
2013
-
[22]
The mag- nitude of the effect of air pollution on sunshine hours in China
Wang Y, Yang Y, Zhao N, Liu C, and Wang Q. The mag- nitude of the effect of air pollution on sunshine hours in China. Journal of Geophysical Research (Atmospheres) 2011;117
2011
-
[23]
Global dimming or local dim- ming?: Effect of urbaniza- tion on sunlight availability
Alpert P, Kishcha P, Kaufman YJ, and Schwarzbard R. Global dimming or local dim- ming?: Effect of urbaniza- tion on sunlight availability. Geophysical Research Letter 2005;32, L17802:L17802
2005
-
[24]
Two-decadal aerosol trends as a likely explanation of the global dim- ming/brightening transition
Streets DG, Wu Y, and Chin M. Two-decadal aerosol trends as a likely explanation of the global dim- ming/brightening transition. Geophysical Research Let- ter 2006;33, L15806:L15806
2006
-
[25]
Climate Forcing by Anthropogenic Aerosols
Charlson R, Schwartz S, Hales J, et al. Climate Forcing by Anthropogenic Aerosols. Science (New York, N.Y.) 1992;255:423–30
1992
-
[26]
Aerosols, Climate, and the Hydro- logical Cycle
Ramanathan V, Crutzen P, Kiehl J, and Rosenfeld D. Aerosols, Climate, and the Hydro- logical Cycle. Science (New York, N.Y.) 2002;294:2119–24
2002
-
[27]
The Effects of Solar Variability on Earth’s Climate: A Workshop Report
Council NR. The Effects of Solar Variability on Earth’s Climate: A Workshop Report. Washington, DC: The Na- tional Academies Press, 2012. doi: 10 . 17226 / 13519. url: https : / / nap . nationalacademies . org / catalog / 13519 / the - effects - of - solar - variability-on-ear...
2012
-
[28]
Graphic: Temperature vs Solar Activ- ity
NASA. Graphic: Temperature vs Solar Activ- ity. Accessed on Month Day, Year. 2023. url: https://science.nasa.gov/resource/graphic-temperature- vs-solar-activity/
2023
-
[29]
Solar Irradi- ance Variability: Modeling the Measurements
Lean JL, Coddington O, Marchenko SV, Machol J, De- Land MT, and Kopp G. Solar Irradi- ance Variability: Modeling the Measurements. Earth and Space Science 2020;7. e2019EA000645 2019EA000645:e2019EA000645
2020
-
[30]
Charac- teristics of solar-irradiance spectra from measurements, modeling, and theoretical approach
Thuillier G, Zhu P, Snow M, Zhang P, and Ye X. Charac- teristics of solar-irradiance spectra from measurements, modeling, and theoretical approach. Light: Science & Applications 2022;11:79
2022
-
[31]
A simulation study of techno-economics and resilience of the solar PV irrigation system against grid outages
Chowdhury H, Chowdhury T, Rahman S, Masrur H, and Senjyu T. A simulation study of techno-economics and resilience of the solar PV irrigation system against grid outages. Environmental Science and Pollution Research 2022;29:1–12
2022
-
[32]
Solar irradiance fore- casting and energy op- timization for achieving nearly net zero energy build- ing
Chakkaravarthy N, Subathra M, Pradeep P, and Manoj Kumar N. Solar irradiance fore- casting and energy op- timization for achieving nearly net zero energy build- ing. Journal of Renewable and Sustainable Energy 2018;10:035103
2018
-
[33]
C ´ancer de piel duplica su incidencia cada 10 a˜nos
Salud S de. C ´ancer de piel duplica su incidencia cada 10 a˜nos. url: https://www.notion. so / Enfermedades - por - radiaci - n - solar - 12cc5fb6a30381fd8d6ae6a81974ebcc ? p = 12cc5fb6a3038008b424f764851c268f&pm=c
-
[34]
Al alza, golpes de calor, que- maduras y fallecimientos
Economista. Al alza, golpes de calor, que- maduras y fallecimientos. El Economista. https://www.eleconomista.com.mx/politica/Al-alza- golpes-de-calor-quemaduras-y-fallecimientos-20240512- 0099.html
-
[35]
FM para la
Dermatolog ´ ıa A.C. FM para la. Al a˜ no se diagnostican 16 mil nuevos casos de c´ ancer de piel en M´ exico, alertan es- pecialistas. https://fmd.org.mx/al-ano-se-diagnostican- 16-mil-nuevos-casos-de-cancer-de-piel/
-
[36]
Gallegos Fern ´andez J
Salud S de. Gallegos Fern ´andez J. F. url: https://www.gob.mx/imss/articulos/en- verano- reforzar-cuidados-para-reducir-riesgos-de-cancer-de- piel?idiom=es
-
[37]
Temporadas de calor provocan problemas en la visi´on que muchos no conocen
Mata M. Temporadas de calor provocan problemas en la visi´on que muchos no conocen. url: https : / / www . milenio . com / ciencia - y - salud / edomex - temporadas - calor - provocan-problemas-vision
-
[38]
Radiaci ´on Solar (UV A)
SEDEMA. Radiaci ´on Solar (UV A). url: https :/ / datos .cdmx . gob. mx /ne / dataset / radiacion-solar-uva
Reviewed August 10, 2026 · model on record in the stance chip above.
Discussion (0). Continue with ORCID to comment.